Evaluation of ASTER Satellite Imagery in Comparison with Topographic Map and GPS Datasets for Tracking Tabuk City Digital Elevation Model
Received: 15-Nov-2014 / Accepted Date: 02-Feb-2015 / Published Date: 12-Feb-2015 DOI: 10.4172/2157-7617.1000257
Abstract
Decision makers need cost-effective methods for accurately depicting land surface characteristics as basic tools for locating construction project. ASTER Global Digital Elevation Model V002 with 30 m resolution was used to extract information on terrain surface and drainage network at the micro-catchment level. ASTER data was compared with 39 reference points from integrated Global Positioning System (GPS) and topographic maps. However, there was a gap between ASTER dataset and reference points; thus, a readjustment process of ASTER dataset was required. The results indicate that Global Positioning System (GPS) and topographic maps data sets have good connection with a range of difference around ± 32.7 m. Pearson correlation coefficient of ASTER Pixel values in the connection with GPS and topographic maps data sets indicates a strong positive correlation 0.8, 0.827 respectively. Therefore, a Multiple Linear Regression (MLR) model was used to readjust ASTER data based on topographic maps, and ground points. The ‘best’ fit of MLR model for ASTER was chosen and used to interpolate a multiscale temporal and spatial distribution. The research applied two interpolation techniques: the Inverse Distance Weighting (IDW) and Kriging to better understand the spatial distribution. The results show that there is a slight difference between ASTER data and the other two types of elevation models.
Keywords: Multiple linear regressions; Digital elevation model; Topographic map; ASTER
8746Introduction
Remote sensing and Geographic Information System (GIS) integration is essential for describing land changes in order to drive the most benefits from a huge number of data. Land topographic characteristics such as elevation, streams network boundaries can be extracted from Digital Elevation Models (DEMs), which might be suitable for addressing a wide variety of hydrological questions at micro-catchment scale.
The Advanced Spaceborne Thermal Emission and Reflectance Radiometer (ASTER) is capable to produce Digital Elevation Models (DEMs). The ASTER DEM extraction procedure, validity, and application have been described by Chrysoulakis et al. [1], Falkowski el al. [2], Yastikli et al. [3], and Kumar et al. [4]. However, global elevation datasets are inevitably subjected to errors (Nikolakopoulos K et al. [5], Shortridge and Goodchild [6]). The quality of DEMs is basically affected by terrain dynamic, data resolution, and interpolation method. Terrain dynamic is generally related to human activities including land cover use, while data resolution is related to spatial and temporal resolutions as well as data source and type.
Digital Elevation Model (DEM) is very useful for many hydrological related disciplines, more effectively when integrated with rainfall runoff models to analyse hydrological variables and scenarios for the interaction between the water, its power and motion, and the surrounding environment. Digital Elevation Model (DEM) is the key components to track and visualize those changes. Recently, the availability of many public domain remote sensing datasets has enhanced the research in the field of DEM and terrain analysis. Digital Elevation Model might be generated from a variety of spaceborne resources (Table 1).
| Image Type | Pixel Size (m) | Swath (km) | Availability |
|---|---|---|---|
| QuickBird | 0.6-2.44 | 16.4 | Commercial |
| IKONOS | 0.82-2.0 or 3.2-8 | 11.3 | Commercial |
| SPOT 1-4 | 10 or 20 | 60 | Commercial |
| SPOT 5 | 2.5, 5, or 10 | 60 | Commercial |
| ASTER | 15, 30, 90 | 60 | Public Domain |
| SRTM | 90 | 225 | Public Domain |
| GTOPO30 | 1000 | 45 | Public Domain |
Table 1: Common data sources for DEM generation
In particular, the ASTER DEM is a valuable recourse for terrain surface and drainage network information as it has high resolution and covers all land areas.
The present research evaluates the accuracy of ASTER DEM. This will be accomplished by identifying two types of ground truthing data sets. Implicit in the analysis is an examination of two interpolation techniques on all data used that can improve knowledge and understanding of the ASTER accuracy and limitations. Further, the combined results of statistical analysis and remotely sensed data analysis will develop a more complete understanding of temporal and spatial models results presentation.
Therefore, the aim of this research is to study and document paths valleys of Tabuk city valleys through ASTER datasets. This study project is meant to achieve the following objectives:
(1) To give credible overview over spatial and temporal patterns based on three types of data in the study area; these will help to understand future flood patterns.
(2) Refine a conclusion of using statistical analysis and remote sensing technology for the same purpose of study.
Study Area
The study focuses on the city of Tabuk in northern part of Saudi Arabia shown in Figure 1. The area is characterized by a hyper-arid climate where the rainfall is less than 33 mm per year. The average annual temperature for Tabuk is around 22.1°C. The maximum, minimum, and average temperatures show that the highest records are in June, July, August, while the lowest temperature occurred in December, January and February.
The topography of the area includes two series of mountains with an elevation exceeds 1200 m above sea level. The central part of the catchment (where the city of Tabuk located) is characterized by low relief with an elevation range less than 765 m above sea level. There are a number of major ephemeral streams consisting of multiple substreams across the city of Tabuk and ended in the north part of the catchment. However, those characteristics may explain the occurrence of flash flood events from year to year.
Interpolation Methods
There are many spatial interpolation methods have been developed and implemented to various fields providing information on unknown site from points within the region. Spatial interpolation methods Inverse Distance Weighted (IDW) and Kriging are the most common methods to create a continuous surface from measured points.
The functionality of IDW method is based on the influence of local point that decreases with distance. Both methods were applied in this research. However, the use of limited input points may cause a great uncertainty.
The IDW can be computed by:
 (1)
(1)
Where z(x) is the estimated value of unknown points, zi is the value of known points, w is some function of distance, and di is the distance between sampled and un-sampled points.
 (2)
(2)
Basically, Kriging interpolation method is based on regression against observed z values of surrounding data points weighted according to spatial covariance values [7].
The Kriging interpolation method can be computed by:
 (3)
(3)
Where n is the number of sampled points used to make the estimation,  is the estimated value of unknown points,
  is the measured point. μ is a known stationary mean, assumed to be constant over the whole domain and calculated as the average of the data [7] after Wackernagel, 2003. The parameter λi is kriging weight, and μ(x0) is the mean of samples within the search window.
Data Collection And Pre-processing
In order to describe and validate ASTER elevation distributions in DEM ground data should be gathered. Datasets for this research were primarily collected from three main sources:
(i) ASTER Elevation Model version 2 (ASTER GDEM2) with 30 m resolution from the year 2001. The image was downloaded from the Earth Observing System (EOS) data gateway. Then ASTER image was imported into ERDAS imagine and ArcView software. Once imported, data was processed and converted into vector data to determine the catchment boarders. In order to compare ASTER DEM with other ground datasets the coordinate and the value of matching pixels were extracted. The positions of 39 grids points were selected based on GPS and topographic map points coordinates (Figure 1). It was necessary to re-project all data sets to UTM WGS84.
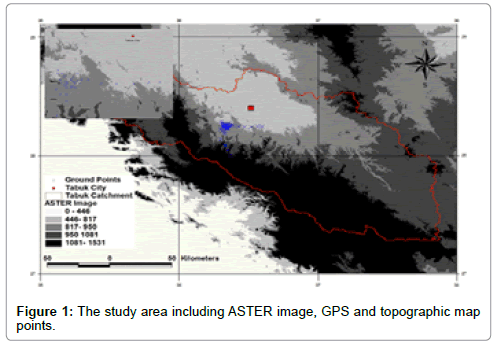
Figure 1: The study area including ASTER image, GPS and topographic map points.
(ii) The 39 Field-Ground points were collected using integrated Global Positioning System (GPS) TOPCON (Figure 1). High quality ground truthing data are required tool for compiling spatial data and readjust ASTER data values. In addition, the accuracy of the GPS is 0.30 m.
(iii) Topographic map points extracted at scale 1:250,000, collected from Saudi Ministry of Interior. Originally, the topographic map derived from aerial photographs acquired as a joint operation in 1988 and published in 1991 (Figure 2).
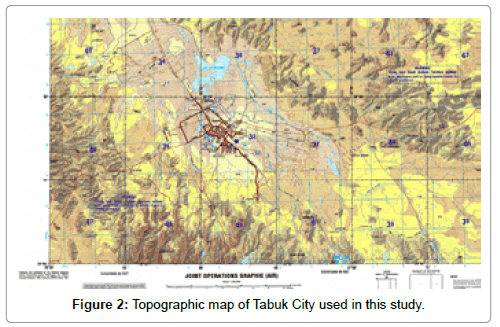
Figure 2: Topographic map of Tabuk City used in this study.
Pearson’s Correlation Coefficient and Multiple Linear Regressions (MLR)
To detect the degree relationship between all data sets Pearson’s correlation coefficient was calculated to measure the strength of a linear relationship:
 (4)
(4)
Multiple linear regressions (MLR) model was carried out to estimate convective and stratiform elevation values from ASTER image among topographic map, and GPS ground truthing records. This process will be fruitful to match ASTER values in all cases within some acceptable range of errors.
Results
The maximum height difference between the GPS points and ASTER values was 275 m, while between Topographic map and ASTER values was 260 m. In most cases, ASTER data values seem to be higher than any of the two data sets GPS and topographic map values. According to the descriptive statistics there are differences with regards to minimum, maximum, mean, and standard deviation values (Table 2).
| Data Type | N | Minimum | Maximum | Mean | Std. Deviation |
|---|---|---|---|---|---|
| Topo | 39 | 717 | 1050 | 776.44 | 73.847 |
| GPS | 39 | 758 | 985 | 799.22 | 49.868 |
| ASTER | 39 | 803 | 1260 | 875.82 | 92.052 |
| Valid N (listwise) | 39 |
Table 2: Descriptive Statistics of GPS, Topographic map, and ASTER values.
Although there is an agreement between GPS and topographic map data sets, the comparison between the 39 points of ASTER pixel values with the ground truthing shows that ASTER values have a gap but still positively correlated (Figure 3 and Table 3).
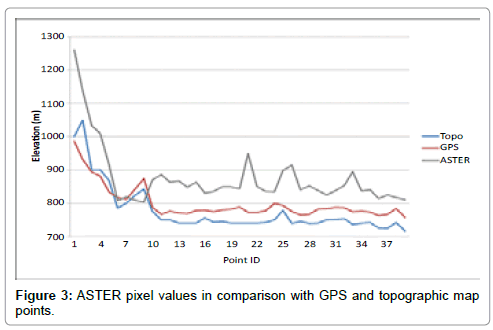
Figure 3: ASTER pixel values in comparison with GPS and topographic map points.
| Data type | Topo | GPS | ASTER | |
|---|---|---|---|---|
| Topo | Pearson Correlation | 1 | 0.960 | 0.827 |
| N | 39 | 39 | 39 | |
| GPS | Pearson Correlation | 0.960 | 1 | 0.800 |
| N | 39 | 39 | 39 | |
| ASTER | Pearson Correlation | 0.827 | 0.800 | 1 |
| N | 39 | 39 | 39 | |
Table 3: The values of Pearson correlation coefficients comparing ASTER dataset to field records and topographic map.
Pearson coefficients were calculated to compare the values of ASTER data to field GPS and topographic map records. In general, the ASTER dataset was highly correlated to field data and topographic map, 0.8 and 0.827 respectively.
Spatial elevation analysis was based on the application of Inverse Distance Weighting (IDW) and Kriging interpolation methods. In addition, the polygon maps provided a realistic spatial variation of elevation. For Kriging maps, the performance of variogram models was varied smoothly across the study area while IDW results showed a rough variograms (Figures 4 and 5).
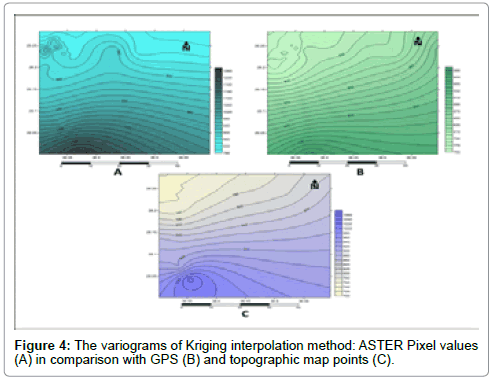
Figure 4: The variograms of Kriging interpolation method: ASTER Pixel values (A) in comparison with GPS (B) and topographic map points (C).
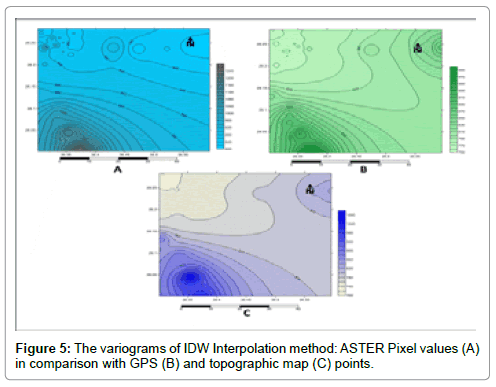
Figure 5: The variograms of IDW Interpolation method: ASTER Pixel values (A) in comparison with GPS (B) and topographic map (C) points.
Since the GPS and topographic map records are considered as a reference for ASTER DEM, the difference between reference datasets and ASTER records represents error in ASTER-derived elevations. Therefore, a readjustment process is required.
Based on the Multiple Linear Regressions (MLR), the relationship between the ASTER data, topographic map, and GPS ground truthing records is represented by the following equations:
 (5)
(5)
Where  stands for the ASTER value after adjustment process, Topois the value of topographic map, GPS is the global positioning system ground truthing.
The evaluation of temporal patterns shows that readjusted ASTER does well in capturing the topographic distribution pattern, in particular for the high and low–lands gradients (Figure 6).
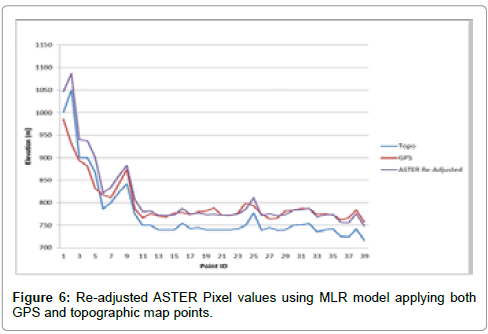
Figure 6: Re-adjusted ASTER Pixel values using MLR model applying both GPS and topographic map points.
Discussion
The automatic DEM generation has become an important part of international research in the last 10 years as a result of the existence of many satellite sensors [5]. The elevation of each ASTER DEM pixel was compared with the elevation of respective GPS and topographic map.
The differences between ASTER DEM and the reference data set reflect and error of ASTER DEM sample, thus, requires a significant improvement. Utilizing empirical relationships between ASTER satellite imagery and reference data sets in the form of MLR proved a successful for mapping elevation.
The MLR was suggested and evaluated based on Pearson Correlation coefficient (Table 4), which shows a significant linear positive relationship between ASTER Data with GPS and Topographic map data points. The readjusted ASTER values show a great Spatial and Temporal improvements (Table 5).
| Model | Unstandardized Coefficients | Standardized Coefficients | t | Sig. | ||
|---|---|---|---|---|---|---|
| B | Std. Error | Beta | ||||
| 1 | (Constant) | 33.006 | 203.174 | .162 | .872 | |
| GPS | .143 | .614 | .077 | .232 | .818 | |
| Topo | .939 | .414 | .753 | 2.266 | .030 | |
a. Dependent Variable: ASTER
Table 4: MLR model to readjust ASTER values.
| Data Type | TOPO | GPS | ASTER | Readjusted ASTER | Readjusted ASTER- TOPO | Readjusted ASTER- GPS |
|---|---|---|---|---|---|---|
| Average (m) | 776.4 | 799.2 | 875.8 | 810 | 33.9 | 16.3 |
Table 5: Average values of all used data sets as well as readjusted.
Figure 7 shows the two distributions of IDW and Kriging interpolation methods are of the same shape, the one derived from IDW is more condensed; whereas Kriging holds less strongly as far as slopes are concerned.
Figure 7: The variograms of readjusted ASTER Pixel values (A).Kriging (A) IDW (B).
However, there is a data scarcity problem in arid regions, which may affect the quality of any modeling efforts. Therefore, one can apply a single type of reference data sets to readjust ASTER data (Tables 6 and 7).
| Model | Unstandardized Coefficients | Standardized Coefficients | t | Sig. | ||
|---|---|---|---|---|---|---|
| B | Std. Error | Beta | ||||
| 1 | (Constant) | 75.216 | 89.801 | .838 | .408 | |
| Topo | 1.031 | .115 | .827 | 8.955 | .000 | |
| a. Dependent Variable: ASTER | ||||||
Table 6: The MLR model for ASTER Pixel value with topographic map.
| Model | Unstandardized Coefficients | Standardized Coefficients | t | Sig. | ||
|---|---|---|---|---|---|---|
| B | Std. Error | Beta | ||||
| 1 | (Constant) | -304.197 | 145.844 | -2.086 | .044 | |
| GPS | 1.476 | .182 | .800 | 8.106 | .000 | |
| a. Dependent Variable: ASTER | ||||||
Table 7: The MLR model for ASTER Pixel value with GPS records.
Emphasis is to be laid on remote sensing data processing in comparison with ground truthing data which can assist in examining the accuracy of remote sensing data over the selected region. However, there is a need to understand geospatial processes in the study area including data organization, analysis and integration. On the other hand, theoretical and practical backgrounds are needed to understand linkages, relationships and thresholds that allow faster identification of the study area.
DEMs are useful to model the distribution of site potential, slope, vegetation type, and potential solar insolation. This huge amount of data may assist the hydrological modelling framework. Consequently improving future environmental disciplines especially water resource management, facing increasing water scarcity in the study region. It will test the performance of existing hydrological model concepts in arid regions, which are usually not in the focus of hydrological model development [8,9].
Moreover, a suggestion of further analysis is required to assess the accuracy of ASTER data in comparison to other DEM satellite. However, higher-resolution remotely sensed data might give better results. In general, the sample size is affecting the performance of spatial interpolation methods.
Conclusion
A quality assessment and validation of DEM from ASTER Elevation Model version 2 (ASTER GDEM2) with 30 m was carried out based on 39 reference points of test site around Tabuk city. ASTER data have attributes that particularly valuable for terrain related studies where the elevation information of a large catchment are provided. The GPS and Topographic elevation records show a strong positive correlation with ASTER data. The MLR was used to applied and found to be an effective tool for readjusting ASTER values in Tabuk. The results of readjusted ASTER were considered quite satisfactory.
Acknowledgment
The authors would like to acknowledge financial support for this work, from the Deanship of Scientific Research (DSR), University of Tabuk, Tabuk Saudi Arabia, under grant no. 2/052/1435, and on-going project entitled “Topographic study of Tabuk Wadis: Changes and Behaviour During Flash Flood Events”.
References
- Chrysoulakis N, Diamandakis M, Prastacos P (2003) GIS integration of ASTER stereo imagery for the support of watershed management. Global Nest: The Int J 5: 47-56.
- Falkowski MJ, Gessler P, Alistair PM, Smith MS (2004) Evaluation ASTER satellite imagery and gradient modelling for mapping and characterizing wildland fuels. Forest Ecol Manage 217: 129-146.
- Yastikli N, Kocak G, Buyuksalih G (2006) Accuracy and morphological analyses of GTOPO30 and SRTM X -C Band DEMs in the test area Istanbul. Paper presented at ISPRS Workshop on Topographic Mapping from Space(with Special Emphasis on Small Satellites), Ankara, Turkey, February 14-16.
- Kumar KV, Rao EN, Parveen R (2014) An image processing approach for converging ASTER-derived spectral maps for mapping Kolhan limestone, Jharkhand, India Arindam Guha1. Curr Sci 106: 1.
- NikolakopoulosKG, Kamaratakis EK, Chrysoulakis N(2006) SRTM vs ASTER elevation products. Comparison for two regions in Crete, Greece.Int JRemotSens 27:4819-4838.
- ShortridgeAM,Goodchild MF(1999) Communicating uncertainty for global data sets. Paper presented at International Symposium on Spatial Data Quality, Hong Kong 59-65.
- Li J, Heap AD (2008) A review of spatial interpolation methods for environmental scientists. Performance and impact factors. EcolInfor 6: 228-241.
- Wheater H, Sorooshian S, Sharma KD (2008) Hydrological Modelling in Arid and Semi-Arid Areas, Cambridge Univ Press, UK.
- Caruso C, Quarta F(1998) Interpolation methods comparison. Comput MathAppl 35:109-126.
Citation: Alatawi S, Abushandi E (2015) Evaluation of ASTER Satellite Imagery in Comparison with Topographic Map and GPS Datasets for Tracking Tabuk City Digital Elevation Model. J Earth Sci Clim Change 6: 257. DOI: 10.4172/2157-7617.1000257
Copyright: © 2015 Alatawi S, et al. This is an open-access article distributed under the terms of the Creative Commons Attribution License, which permits unrestricted use, distribution, and reproduction in any medium, provided the original author and source are credited.
Select your language of interest to view the total content in your interested language
Share This Article
Recommended Journals
Open Access Journals
Article Tools
Article Usage
- Total views: 18572
- [From(publication date): 2-2015 - Jul 18, 2025]
- Breakdown by view type
- HTML page views: 13877
- PDF downloads: 4695