Research Article Open Access
Dynamic Simulation of both Thermal and Energetic Behavior for Dwellings Located in Algiers
Visit for more related articles at Journal of Earth Science & Climatic Change
Abstract
In this study, the heating and cooling energy consumptions for houses located in Algiers are determined using the degree day method during one year.Analytical results are validated by simulation with TRNSYS software. The hourly curves for energy consumption and outside temperature are presented during one month, one week and one day periods. Moreover, monthly results during a year are presented and analytical values are compared to simulated values. The degree day method proved to be applicable to the monthly and annual energy analysis for buildings. It was found that, Algerian climate with its long warm season compared to the cold season, consumes cooling energy twice as much as the heating energy. Energy consumption for heating reaches 670 kWh, as for cooling it is 1700 kWh.
| Keywords |
| Degree day method; TRNSYS; Heating and cooling in building |
| Nomenclature |
| A: the surface of building losses-(m²); CP: the air specific heat-(Wh/m³ K); CDD: cooling degree day-(°C day); HDD: Heating Degree Day-(°C day); ks: the coefficient of total thermal transmission-(W/m² K); Q heat, Net: Net energy needs for heating-(MJ); Q L, heat: heat losses by transmission and ventilation during heating period- (MJ); Q cool, net: Net energy needs for cooling-(MJ); QL, cool: heat losses by transmission and ventilation during cooling period-(MJ); Q g,cool: heat gain by radiation and internal heat production during cooling period- (MJ); Q g,heat: heat gain by radiation and heat internal production during heating period-(MJ); V: the air volume included in dwelling-(m³); T: temperature-(°C); β: the ventilation rate of dwelling-(h-1); η : the utilization factor. |
| Introduction |
| Due to the importance of internal so as the solar contributions, the complexity of heating system regulation and intermittency, it is difficult to estimate building energy consumption for tertiary sector. Various methods are implemented in order to perceive a better understanding to the energy behaviour and consumption prediction. For that reason, this study was initiated. |
| In this study, the energy consumption for the heating and cooling of a house located in Algiers (Algeria) is evaluated. The dwelling is built according to required standards of insulation by using local materials (hollow brick walls with insulation between walls). The monthly energy consumption for heating and cooling is determined for one year, using the degree day method. |
| The TRNSYS 16 [1] is used to simulate the heating and cooling requirements. Hourly results are obtained for respectively one month, one week and one day periods. The TRNSYS software is used to validate assessment made by degree day method. Simulated results are compared to analytical values for both heating and cooling consumption. |
| In the coming sections, the investigation steps are presented, as follows: |
| • Revising the literature in the present field of investigation |
| • Implementing the TRNSYS software and the degree day method |
| • Executing simulations and analysing the results |
| • Presenting the results |
| • Extracting conclusions from the present investigation |
| • Providing some recommendations for further studies |
| Literature Review |
| For the purpose of the completion of this study, literature was reviewed. Several researchers were concerned about that field of science. Among them, for example, were: |
| Shariah A et al. [2] calculated the cooling and heating loads for airconditioned and heated buildings in three different cities in Jordan that represent three climatic regions. They analysed the insulation effect of buildings. |
| Dombaycı OA [3] calculated the heating degree day HDD and cooling degree day numbers for various base temperatures using daily maximum so as minimum temperature data for the long-term (21 years), measured at meteorological stations in 79 city centres. |
| Papakostas K and Kyriakis N [4] studied heating and cooling degree-hours for two main cities in Greece. The heating degreehours were calculated for base temperatures from 10 to 20°C and the cooling degree-hours for base temperatures from 20 to 27.5°C, using a temperature step of 0.5°C. The results were presented in tabular form that are used in estimating the energy requirements, heating fuel consumption and air conditioning systems for either monthly or seasonally operation. |
| Papakostas K et al. [5] analysed the energy performance of two bioclimatic buildings located in Santa Rosa city which is a temperate semi-arid agricultural region of central Argentina. The Study described the energy performance of the buildings during the period 2001-2008. The authors concluded that the results confirm the large potential of solar buildings design to reach significant levels of energy saving. The comparison of solar and conventional buildings in terms of natural gas consumption demonstrates the magnitude of such potential. |
| Frank [6] investigated the potential impacts of climate change on heating and cooling energy demand by means of transient building energy simulations and hourly weather data scenarios for the Zurich–Kloten location, which represents the climatic situation in the Swiss Central Plateau. A multi-story building, with variable thermal insulation levels and internal heat gains, and a fixed window area fraction of 30% was considered. For the time horizon 2050-2100, a climatic warm reference year scenario was used that foresees a 4.4 8°C rise in mean annual air temperature relative to the 1961-1990 climatological normal and is thereby roughly in line with the climate change predictions made by the Intergovernmental Panel on Climate Change (IPCC). The calculation results showed a 33-44% decrease in the annual heating energy demand for Swiss residential buildings for the period 2050-2100. The annual cooling energy demand for office buildings with internal heat gains of 20-30 W/m2 will increase by 223- 1050% while the heating energy demand will be reduced by 36-58%. A shortening of the heating season of 53 days can be observed. The study showed that efficient solar protection and night ventilation strategies are capable of keeping indoor air temperatures within an acceptable comfort range and obviating the need for cooling plant that are set to become a crucial building design issue. |
| Sjögren JU [7] conducted an evaluation on monthly consumption data registered by the property holders for over 100 multifamily buildings/real estates in Sweden. The approach used, based on the energy signature method, was developed for evaluating the energy performance of multifamily buildings in terms of the overall heat loss coefficient, Ktot. To compensate for the missing data, different assumed consumption profiles were used. |
| Yildiz A [8] presented the energy for the whole process of space heating in buildings. The study is based on a pre-design analysis, which was produced during the ongoing work for the International Energy Agency (IEA) formed within the Energy Conservation in Buildings and Community Systems Programme (ECBCSP) (Annex 37). The analysis is applied to an office in Izmir with a volume of 720 m3 and net floor area of 240 m² as an example of application. The heating is ensured by a conventional boiler GNL (liquefied natural gas). Calculations for all kinds of energy utilization, including heating/ cooling loads of rooms in buildings and temperature distributions, are based on energy balances. |
| Mateus T and Oliveira AC [9] Tooled TRNSYS software as a basis for potential assessment of integrated solar absorption cooling and heating systems for building applications. Three different locations and climates were considered: Berlin (Germany), Lisbon (Portugal), and Rome (Italy), including different building types: residential, office and hotel. The TRNSYS models was able to run for a whole year (365 days), according to control rules (self-deciding whether to operate in heating or cooling modes), and with the possibility of combining cooling, heating and DHW (Domestic Hot Water) applications. |
| Ibanez M et al. [10] stated that one of the components to simulate building thermal behavior in TRNSYS is Type 56 Multi-Zone building. The component model deals with the thermal balances of a building having up to 25 thermal zones. The building model in Type 56 is a nongeometrical balance model with one air node per zone, representing the thermal capacity of the zone air volume and capacities that are closely connected like furniture with the air node. Separate equipment components could be coupled to the zones as either internal convective gains or ventilation gains. In order to use Type 56 a separate preprocessing program PREBID is executed. The PREBID program reads in and processes a file containing the building description and generates two files that are used by Type 56 component during a TRNSYS simulation. The inputs and outputs of Type 56 depend upon the building description and options within the PREBID program. |
| In conclusion, it was found that in thermally active building, elements are used to condition buildings by integrating a fluid system into massive parts of the building itself. Examples are radiant floor heating or cooling systems, radiant ceilings or wall heating or cooling systems, all well known. To take into account the behavior of radiant heating and cooling in dynamic simulation programs specific models or modeling methods have been proposed in TRNSYS15. |
| Implementing TRNSYS software and the degree day method |
| In order to fulfill the set objectives of this investigation, TRNSYS was implemented. TRNSYS Simulation Studio simulates the energy and thermal behavior of a system whose model TYPE56-Multizone building is defined in TRNBUILD. Climatic data such as temperature, relative humidity and solar illumination are given by the tool METEONORM [11]. The model type 109TMY2 is taken to read weather data. TRNSYS simulation software is used for the analysis [1]. TRNSYS adopts a component-based platform for the formulation of a system. Different components can be added to a system via a graphical interface so that components can be linked together as desired. Moreover, TRNSYS allows users to create their own components for use in a dynamic system simulation. |
| A case of housing with surface losses of 325.5m² and air volume of 313m3 was considered. The rate of air exchange is achieved with β=1 h-1. The overall heat transfer coefficient ks equal to 0.43 W/m²K. |
| According to house envelope composition (double glazing and good insulation of opaque walls), the level of total thermal insulation agrees with European standards on habitat insulation [12,13]. In this investigation the degree day method was used to calculate the thermal losses. It is to be noted that, the need of useful heat depends on thermal qualities of its envelope (thermal resistances), and its losses by ventilation is calculated as follows: |
 |
| The heating degree day HDD is the sum of all degree days for each day of the chosen period, for which the non-heating temperature was higher than the temperature without heating. The heating degree days is given after [14], as follows: |
 |
| Where: Δt is the chosen period, |
| The non-heating temperature (TNH) is the temperature above which heating can be stopped, taking into account free internal contributions. |
| The temperature without heating (TWH) is the temperature which would be obtained in a building not heated and not occupied. This temperature is equal to average outside temperature. |
| By making the energy balance, solar contributions intervene in the energy needs for heating. The utilization factor of heat gain is function of thermal losses and solar contributions by glazing and opaque walls. |
| The net monthly energy needs for heating are determined as follows: |
 |
| Heat losses are calculated for the cooling period according to the same principle: |
 |
| The cooling degrees days CDD is the sum of all degree days for each day of the chosen period, for which the non-cooling temperature is higher than the temperature without cooling. |
| The cooling degrees days can be written as follows: |
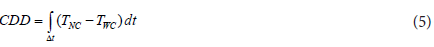 |
| Where: Δt is the index of the chosen period, |
| The non-cooling temperature (TNC) is the temperature from which air conditioning can be put on in buildings. This temperature is equal to the external temperature. |
| The temperature without cooling (TWC) is the temperature which could be obtained in a building with cooling. By considering solar and internal contributions, according to the 1st law of thermodynamics, the conservation of energy in the house can be used, which gives: |
| METEONORM software is used for site climatic data. The building considered in this case study is a house having a living space of 88 m². |
| In the cooling mode, the set point temperature is fixed to 22°C for all building zones; in the heating mode, the set point temperature is set to 21°C. |
| To validate calculations, a TRNSYS simulation is performed using same conditions. The home is modeled by TRNBUILD and climatic data are obtained from METEONORM. |
| Executing simulations and analyzing the results |
| Based on the above equations, definitions and assumptions, simulations were executed, results were obtained and analyzed. |
| Presenting the results |
| These analyzed results were represented on figures 1 to 9. These figures are self-explanatory graphs. They are listed, here, as follows: |
| Figure 1 show, the hourly external air temperature profile during one month (January) and the corresponding heating profile necessary to maintain suitable thermal comfort. The hourly temperature profile is characterised by sinusoidal waves having maximum and minimum peaks reaching 24.05°C and 1.05°C, respectively. It is noticed that heating energy profile is quite similar to temperature profile. However the maximum values of heating correspond to the minimum values of outside temperatures. |
| This is very logical and will be confirmed in the weekly and daily curves. |
| Figure 2 shows the heating energy consumption during one whole week in January. The energy profile as described previously is actually clearly represented in this curve. Heating reaches maximum peaks values of 1.66 kW, 1.5 kW and 1.68 kW corresponding to minimum temperatures of 4.36°C, 5.3°C and 6.9°C for times 104, 128 and 152 hours respectively. |
| Figure 3 shows more closely the heating consumption and external air temperature during one day period (24 hours) in January. The profiles are inversely proportional. |
| From the curves, both profiles are characterized by 3 phases. |
| - Phase 1: from hour 1 to hour 8, it corresponds to the 2nd part of the night. As the temperature decreases from 10.8°C to 8.9°C, the heating increases from 0.76 kW to 1.15 kW. |
| - Phase 2: from hour 8 to hour 18. This period corresponds to daylight, in which external air temperature increases up to14.8°C before starting going down to 12°C. In this phase the heating decreases from 1.15 kW to reaching the value zero at hour 11. This value remains up to 18 hours before starting to rise. |
| - Phase 3: from hour 18 to hour 24. This is the 1st part of the night, where external air temperature decreases to 10°C, the heating start increasing from zero to reach 0.87 kW at hour 24. |
| Figure 4 shows the results obtained by the degree day method and those obtained by TRNSYS under same conditions during one year period. |
| It is seen from the curves, that results are consistent and the curves evolve in the same way. |
| The curves can be divided into 3 periods. |
| - Period 1: from month 1 to month 4: heating energy consumption decreases sharply from 553.3 kWh (TRNSYS) and 624,358 kWh (Degree Day method) to reach value 0. The heating energy values are high in month 1 (January) which corresponds to the winter season, where the need of heating is important. The demand of heating decreases as external air temperature increases. |
| - Period 2: from month 4 to month 10. This period corresponds to the warm season, where heating is not required. |
| - Period 3: from month 10 to month12. The heating increases as the season goes toward winter again. The heating reaches 624.36 kWh (degree days) and 444.8 kWh (TRNSYS) in December. |
| It could be concluded that these curves are quite logical since they concord with different seasons and their heating requirements. |
| The results obtained by the degree day method are validated by TRNSYS software, since the results obtained are similar and almost identical. |
| Figure 5 presents the energy consumption for cooling during the month of July As for heating, the curves profiles are similar and evolve identically. |
| The maximum and minimum values for cooling range from 4.55 kW and 0.48 kW corresponding to maximum and minimum temperatures of 38.62°C and 14.28°C respectively. |
| Figure 6 gives a closer look to hourly profile during a whole week. The energy consumption profile is quite similar to outside temperature profile. The peaks of cooling correspond clearly to highest temperatures. The values of cooling range from 0.48 kW to 3.92 kW for outside temperatures ranging from 14.29 to 29.51°C. |
| Figure 7 presents a much closer profile for one whole day period. |
| In general, the curve of cooling corresponds to the temperature profile of outside air. |
| As for heating, the cooling curves profiles are characterized by 3 phases. |
| - Phase 1: from hour 1 to hour 6. This phase corresponds to 2nd part of the night, where the temperature falls from 19°C to 15.99°C. Obviously the cooling need decreases as well from 0.9 kW to 0.48 kW. |
| - Phase 2: from hour 6 to hour 18. It corresponds to daylight. The need for cooling increases from 0.48 kW corresponding to minimum temperature of 15.99°C to reach maximum cooling of 2.57 kW when the external temperature is maximum (28.41°C). |
| - Phase 3: from hour 18 to hour 24. It represents the 1st part of the night. As temperature decreases from 28°C to 17°C, the need for cooling decreases from 2.57 to 0.84 kW. |
| Figure 8 shows the results obtained using the degree day method and those obtained with TRNSYS under same conditions during one year period. |
| The period of cooling which corresponds to warm season, has been determined by the degree day method. This period ranges from May to November. The needs for cooling using the TRNSYS software have been set for this period. |
| The results are consistent and the curves evolve in the same way. |
| The curves of both methods are characterized by two phases as indicated in figure 8. |
| - Increasing phase: the curves are completely confounded for the 1st month of cooling period. Slight shifting is noticed starting in month 6. A maximum value of 1700 kWh is reached for TRNSYS, while for degree day method, the maximum reaches 1600 kWh. |
| - Decreasing phase: the decrease for cooling need occurs simultaneously in month 8 to reach zero in month 11 for both methods. However, a noticeable shift between the decreasing curves is clearly visible. |
| Figure 9 explains the difference by the fact that solar and internal gains are overestimated in the degree day method the difference is important in summer, especially from August to October. |
| Internal and solar gains simulated by TRNSYS range between 644 kWh and 850 kWh. Internal and solar gains used in degree day method range between 900 kWh and1400 kWh. |
| Conclusions |
| Based on the above results, it can be concluded that: |
| (a) The results obtained by both TRNSYS and degree day method are quite similar, and are consistent with heating and cooling needs according to seasons. |
| (b) TRNSYS gives more accurate results, since the heating is activated when the temperature goes below 21°C, and air conditioning starts when temperature exceeds 22°C. |
| (c) TRNSYS simulates both the thermal and energetic behavior of the dwelling (hourly) and obeys to energy demand. |
| Both methods are interesting and useful to validate calculations and estimations. |
| The method of the degree day is better adapted for monthly and annual energy analysis. |
| • The Algerian climate (warm season longer than cold season), the cooling energy consumption is twice as important as the heating energy consumption. |
| Energy consumption for heating reaches 670 kWh, as for cooling it is 1700 kWh. |
| • The method of degree days is useful for sizing heating and air conditioning systems. |
| Recommendations |
| In general, for improving energy efficiency of building and reducing greenhouse gases emissions, particular interest should be given to the following: |
| - Reducing solar gain in summer |
| - Insuring good insulation |
| - Using renewable energies |
| This study concerns an individual house constructed using local material. As for recommendations, it would be very interesting to perform further investigations in the following items: |
| - Several types of building where energy consumption profiles are different (hotels, offices, hospitals, schools…) |
| - Use of other materials in wall composition |
| - Effect of sunscreens in energy consumption |
| - Cooling by natural ventilation |
| - Introduce economical aspect in the study |
| - Use of more appropriate software for better comparison efficiency |
| These elements fall within the key recommendations of the World Business Council for Sustainable Development, WBCSD. |
| “Energy efficiency is rapidly becoming one of the great challenges of our time and the buildings are a major component. They consume more energy than any other sector and thus contribute largely to climate change, “said Björn Stigson, president of the WBCSD (World Business Council for Sustainable Development, WBCSD). [http:// cdurable.info/Efficacite-Energetique-dans-les-Batiments-Rapport- International-WBCSD, 1698.html] |
| The report from this project makes six key recommendations: |
| • Strengthen regulation and thermal labels to provide better information |
| • Encourage investment in energy efficiency |
| • Encourage integrated design approaches and innovations |
| • Develop and use technologies that facilitate energy saving behavior |
| • Develop a hands work for energy savings |
| • Mobilize for an energy conscious culture issues. |
References
|
Relevant Topics
- Atmosphere
- Atmospheric Chemistry
- Atmospheric inversions
- Biosphere
- Chemical Oceanography
- Climate Modeling
- Crystallography
- Disaster Science
- Earth Science
- Ecology
- Environmental Degradation
- Gemology
- Geochemistry
- Geochronology
- Geomicrobiology
- Geomorphology
- Geosciences
- Geostatistics
- Glaciology
- Microplastic Pollution
- Mineralogy
- Soil Erosion and Land Degradation
Recommended Journals
Article Tools
Article Usage
- Total views: 14066
- [From(publication date):
November-2012 - Nov 13, 2025] - Breakdown by view type
- HTML page views : 9366
- PDF downloads : 4700