Research Article Open Access
Effects of Surface Roughness of Hydroxyapatite on Cell Attachment and Proliferation
Ling Li1, Kyle Crosby2, Monica Sawicki1, Leon L. Shaw1,2* and Yong Wang21Department of Mechanical, Materials and Aerospace Engineering, Illinois Institute of Technology, Chicago 60616, USA
2Department of Chemical, Materials, and Biomolecular Engineering, University of Connecticut, Storrs, CT 06269, USA
- Corresponding Author:
- Leon L. Shaw
Department of Mechanical
Materials and Aerospace Engineering
Illinois Institute of Technology, Chicago, IL 60616, USA
Tel: 312-567-3844
Fax: 312-567-7230
E-mail: lshaw2@iit.edu
Received date: August 24, 2012; Accepted date: September 25, 2012; Published date: September 28, 2012
Citation: Li L, Crosby K, Sawicki M, Shaw LL, Wang Y (2012) Effects of Surface Roughness of Hydroxyapatite on Cell Attachment and Proliferation. J Biotechnol Biomater 2:150. doi:10.4172/2155-952X.1000150
Copyright: © 2012 Li L, This is an open-access article distributed under the terms of the Creative Commons Attribution License, which permits unrestricted use, distribution, and reproduction in any medium, provided the original author and source are credited.
Visit for more related articles at Journal of Biotechnology & Biomaterials
Abstract
Hydroxyapatite (HA) is the main inorganic component of human hard tissue. It is bioactive and supports bone in growth and osteointegration, and thus it is widely used for orthopedic, dental and maxillofacial applications. To fully utilize its potential in forming a strong bone-implant interface, we have investigated the effect of surface roughness of HA on cell attachment and cell proliferation. The HA samples are prepared via sintering, followed by polishing and then scratch generation using a SiC metallographic paper. Cell attachment and proliferation properties are investigated with the aid of ROS 17/2.8 cells and Live/Dead cell staining, while cell morphologies on different surfaces are studied using scanning electron microscopy. It is found that rougher surfaces are better in enhancing cell attachment and proliferation than polished counterparts. It is proposed that the observed phenomenon is related to the enhanced availability of the medium and serum proteins through the grooves underneath the attached cells.
Keywords
Hydroxyapatite; Surface Roughness; ROS 17/2.8 Cells; Cell Attachment; Cell Proliferation
Introduction
Hydroxyapatite (HA) is the main inorganic component of human hard tissue. It is bioactive and supports bone in growth and osteointegration, when used in orthopedic, dental and maxillofacial applications [1]. A strong bone-implant interface can be formed between the HA and bone due to its good biocompatibility [2,3]. It is known that the properties of the substrate, such as surface structure [4], particle size [5,6] and crystallinity [3,7-10] can affect cell behavior. It is reported that cellular response to an implant can be influenced by variations in surface texture or microtopography [11,12]. However, there are few studies about the effect of surface roughness on cellular response to implant [13-15]. One study found that the microstructure, surface roughness and general character of the material, may affect the phenotypic expression of the bone marrow cells cultured on bioactive glass-ceramics [13]. Another study reported that there were more osteoblast-like cells attached to the etched osteoceramic surfaces than polished surfaces [14].
The above mentioned studies have indicated that surface roughness could have influence on cellular response to implants. In this study, we have conducted further studies to understand the effect of the surface roughness on the cell adhesion and proliferation. We selected ROS 17/2.8 cell lines as the model to evaluate the influence of surface roughness on cellular response to HA substrates. ROS 17/2.8 cell lines were chosen because the sizes of ROS 17/2.8 cells are much smaller than that of bone marrow cells, which are widely used in other studies [15]. Therefore, this study will provide evidence on whether small cells can also respond favorably to surface roughness. We used glass cover slips as control, and two kinds of surface roughness of HA were examined in this study.
Materials and Methods
Culture of rat osteosarcoma cells
ROS 17/2.8 cell line was used as a cell model to study cell/HA interactions. This cell line was a gift from Dr. Wei’s lab (University of Connecticut). ROS 17/2.8 cells were cultured in an incubator and maintained in Dulbecco’s modified Eagle’s medium (DMEM), in a 5% CO2 atmosphere at 37°C. The medium was supplemented with fetal bovine serum (FBS, 10%; v/v), 2 mM L-glutamine and 100 U/ mL penicillin– streptomycin (Hyclone,Logan,UT). LIVE/DEAD cell staining kit was obtained from Invitrogen. Alcohol, glutaraldehyde and paraformaldehyde were from Electron Microscopy Sciences. Other reagents were purchased from Fisher Scientific and Sigma.
Preparation of HA discs
HA discs were produced via sintering of HA nano-rods, which were synthesized using the procedure described in a previous study [16]. The HA nano-rod powder was uniaxially pressed (300 MPa) into discs using a ½” diameter steel die. The pressed discs were sintered in air, in a box furnace at 1100°C for 2 hours. The surfaces of sintered HA discs were polished up to 0.05 m SiO2 colloidal. The HA samples polished up to 0.05 m SiO2 colloidal will be designated as HA-P, hereafter. Scratches were created on the surface of HA-P samples with SiC metallographic paper 240-grit, in a single direction in order to obtain regular and similar morphology for all samples. These HA discs scratched with SiC metallographic paper 240-grit, will be denoted as HA-240. All samples were autoclaved before seeding cells. ROS 17/2.8 cells were cultured on discs placed in 24-well plates (Costar). Cells cultured on the surface of the glass coverslip, were used as control.
Surface characterization of HA discs
X-ray diffraction (XRD, Bruker, D5 and D8 Advanced, Karlsruhe, Germany) was performed for both the as-synthesized HA powder and sintered HA discs. For the quantification of surface roughness of HA discs, we employed ZYGO NewYiew 5000 (Middlefield, CT) to measure to surface roughness. Five discs for each surface condition and five different areas of each sample were measured. The reported arithmetic average, a, was the average of the 25 datum points measured. Statistical analysis of variance (ANOVA) was conducted, to determine the statistically significant difference between HA-P and HA-240.The surface morphology and condition of HA pellets were further analyzed, using a field-emission scanning electron microscope (FESEM, JEOL JSM 6335F).
Cell morphology
For SEM observations, the ROS 17/2.8 cells (2×10⁴ cells/well) were cultured on the glass coverslips, HA-P, and HA-240 discs, and fixed in 1.5% glutaraldehyde and 1.5% paraformaldehyde in a 0.12 M phosphate buffer solution (PBS), at room temperature for 2 hours. The ROS 17/2.8 cells on the disc were rinsed 3 times with PBS for 20 min, and then dehydrated by increasing the concentration of alcohol stepwise (15%, 30%, 50%, 70%, 85%, 95% and 3×100%). The critical point drying of specimens were undertaken with liquid CO2. The specimens were sputter-coated with gold and examined using SEM [17,18]. The cell morphology on the surfaces of different samples was observed at 1, 3, 5 and 8 days. The experiment was performed in triplicate.
Cell attachment and proliferation
The initial seeding density of ROS 17/2.8 cells was 2×10⁴ cells/ well in a 24-multiwell plate. Cells were directly seeded on the surface of glass coverslips, HA-P and HA-240. After 1, 3, 5 and 8 days, cells on the surfaces of these discs were directly stained with LIVE/ DEAD cell staining kit [17,19]. Cell images were captured under an inverted fluorescence microscope (Zeiss Axiovert 40 CFL microscope, Thornwood, NY). The experiment was performed in triplicate. A sample size of 3 was used in each experimental group, for statistical analysis. Statistically, significant difference in cell attachment and proliferation was determined using analysis of variance (ANOVA). The difference was considered to be significant, if the probability of the null hypothesis (no relationship between two sets of measured data), i.e., the p-value, was smaller than 0.05.
Results
Characterization of HA discs
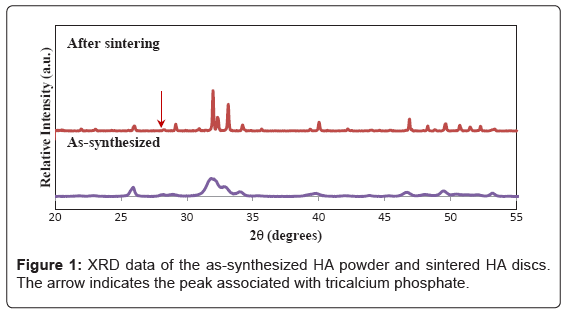
As shown in Figure 1, the XRD spectrum of the as-synthesized HA powder matches well to the phase pure HA (JCPDF No. 74-0566). Sintering at 1100°C has improved the crystallinity of the sample, but also induces slight decomposition of HA to form tricalcium phosphate (TCP, JCPDF No. 09-0169), as evidenced by the appearance of a peak at 31.05°, associated with the (210) reflection of TCP. The density of sintered HA discs, determined using the mass and volume, is 87% of the theoretical (which is taken as 3.156 g/cm3)
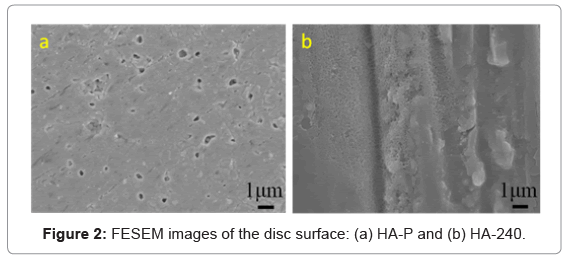
Figure 2 shows the surface morphology of HA-P and HA-240 discs. The presence of pores at the polished surface of HA-P is consistent with the density measurement, mentioned above. Because of the high relative density (87%), most of these pores are closed pores, i.e., they are not interconnected. The surface of HA-P is relatively smooth, except these closed pores. However, long, parallel scratches are present at HA-240, in addition to the closed pores. Thus, HA-240 is rougher than HA-P. Indeed, based on the surface roughness measurement, the Ra of HA-P is 0.259 ± 0.123 mm, whereas the Ra of HA-240 is 0.341 ± 0.070 mm. The Ra values have statistically significant difference between these two HA surfaces. Note that the average distance between each pair of grooves in HA-240, is less than 10 m.
Cell morphology
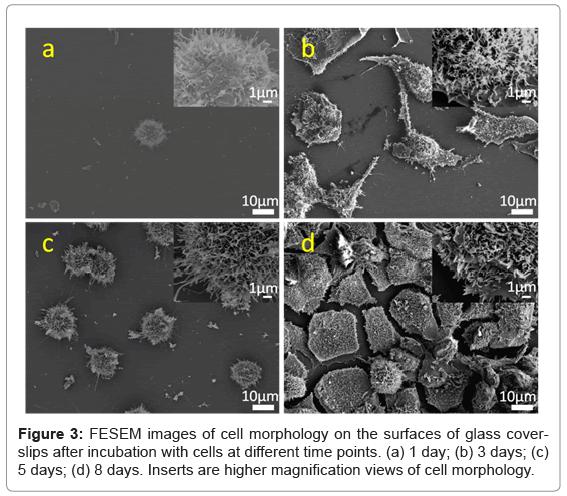
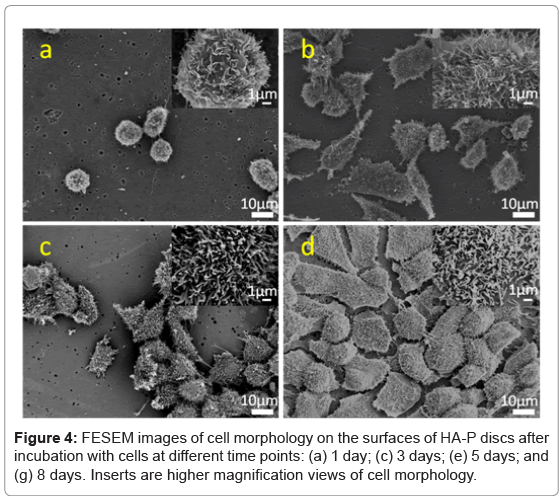
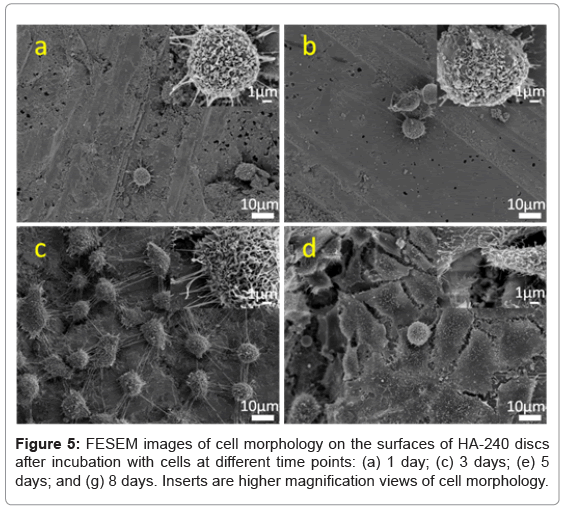
The morphology of cells on the surfaces of different materials was observed at 1, 3, 5 and 8 days. Figure 3 shows FESEM images of ROS 17/2.8 cells adhered on glass coverslips, while Figure 4 shows the ROS 17/2.8 cell morphology on HA-P discs, for the indicated period. Figure 5 shows FESEM images of ROS 17/2.8 cells adhered on HA-240 discs. There are no noticeable differences in the cell morphology on the substrate surfaces, at 1 and 3 days. At day 1, all the cells are round on all surfaces (Figures 3a, 4a and 5a). After 3 days, the cells become flat and spread (Figures 3b, 4b and 5b), with little noticeable difference among the samples. However, after 5 days of culture, cells form more bridges on HA-240 than on the other two substrates (Figures 3c, 4c and 5c).The bridges formed help cells to cross grooves and spread over them, leading to larger numbers of cells and thus, better cell proliferation on HA-240 than on the other two substrates. At 8 days (Figures 3d, 4d and 5d), most of the surfaces of all the samples are covered with ROS 17/2.8 cells, i.e., the difference among different samples becomes smaller, when compared with the results at 5 days. Nevertheless, the difference is present when quantitative analysis is performed (see Sub-section 5.3 and Section 6).
Cell attachment and proliferation
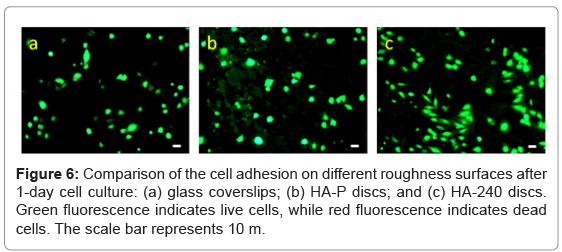
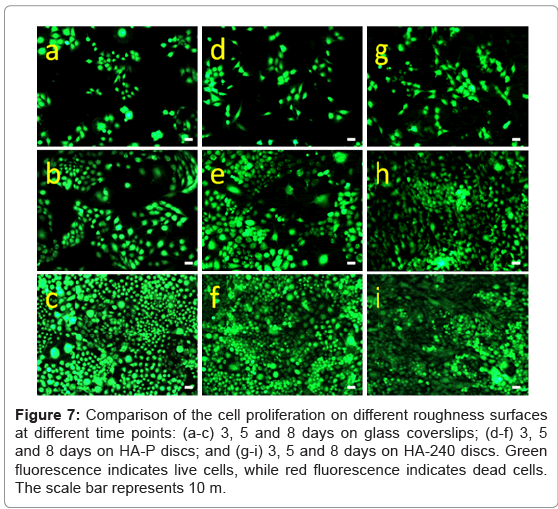
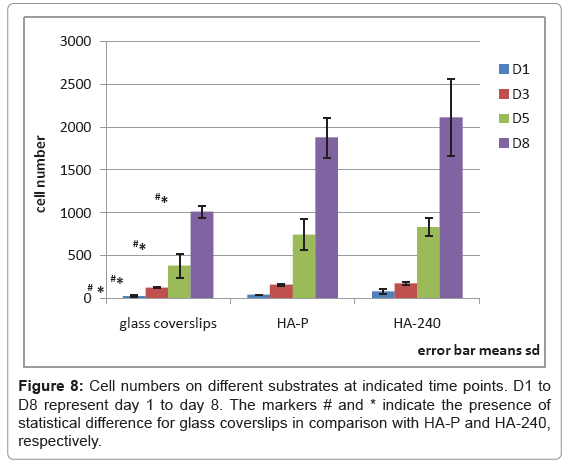
Figure 6a-6c show that ROS 17/2.8 cells attach to the surface of glass coverslips, HA-P and HA-240 discs, respectively, after 1-day culture. Clearly, the number of cells attached on the surface of HA increases, when the surface roughness increases. No dead cell is found on all of these samples. Furthermore, the number of cells increases with time (Figure 7 and 8), and cells grow confluence after 8 days on all the discs (Figure 7c, 7f and 7i). However, cells grow the best on HA-240, followed by HA-P, and then glass coverslips. The results indicate HA- 240 has better bioactivity than HA-P. These results are consistent with the observation of FESEM results.
Figure 7: Comparison of the cell proliferation on different roughness surfaces at different time points: (a-c) 3, 5 and 8 days on glass coverslips; (d-f) 3, 5 and 8 days on HA-P discs; and (g-i) 3, 5 and 8 days on HA-240 discs. Green luorescence indicates live cells, while red fluorescence indicates dead cells. The scale bar represents 10 m.
Discussion
The p-values for comparing the cell numbers between different substrates at given time points, are shown in Table 1. As shown, there is significant difference in the cell number between glass coverslips, and the other two substrates at each time point, indicating that HA is more bioactive than the control sample. Furthermore, as indicated by the p-values in Table 2, there is statistically significant difference in the cell number between each pair of adjacent time points, for all the substrates investigated in this study. However, no statistically significant difference is found between HA-P and HA-240 for a given time, since the p-values for this type of comparison are larger than 0.05 (Table 1).
| Time | Glass vs. HA-P | Glass vs. HA-240 | HA-P vs. HA-240 |
|---|---|---|---|
| Day 1 | 0.02605 | 0.04344 | 0.10041 |
| Day 3 | 0.01146 | 0.00478 | 0.28484 |
| Day 5 | 0.04904 | 0.01106 | 0.50169 |
| Day 8 | 0.00350 | 0.01361 | 0.46563 |
Table 1: The p-values for comparing the cell numbers between different substrates
| Substrate | D1 vs. D3 | D3 vs. D5 | D5 vs. D8 |
|---|---|---|---|
| Glass | 0.00008 | 0.0354 | 0.00228 |
| HA-P | 0.00008 | 0.00452 | 0.00256 |
| HA-240 | 0.01013 | 0.00037 | 0.00846 |
Table 2: The p-values for comparing the cell numbers between different times
In spite of the fact that there is no statistically significant difference between HA-P and HA-240 for any given time, we notice that HA- 240 always exhibits a higher average number of attached cells than HA-P (Figure 8). Furthermore, the maximum number of attached cells, which is affected by the local condition and the average condition of the surface, is always displayed by HA-240. Taking all the results into consideration, we conclude that increasing surface roughness can increase cell attachment and proliferation, but the difference is not large enough to have statistically significant difference between the two surface conditions investigated in this study.
The mechanism for rougher surface being more effective for cell attachment and proliferation is likely related to the availability of the medium, and serum proteins through the grooves underneath the attached cells, as proposed by Deligianni, et al. [15]. As shown in Figure 2, the roughness produced on the surface of HA-240 is composed of long, parallel grooves and ridges. These grooves are more effective than the closed pores on the surface of HA-P, in providing the medium and serum proteins to the bottom of attached cells because the length of these grooves is much larger than the size of cells. Note that the size of the closed pores on the surface of HA-P is only about 1 m or less (Figure 2), while the size of cells is about 10 to 20 m (Figure 3-5). As such, the closed pores cannot communicate with the outside medium, once a cell is attached and covers the pore(s). In contrast, the attachment of cells on the top of grooves cannot prevent the communication of the medium in the grooves with the outside medium, because the length of the grooves is much larger than the size of cells.
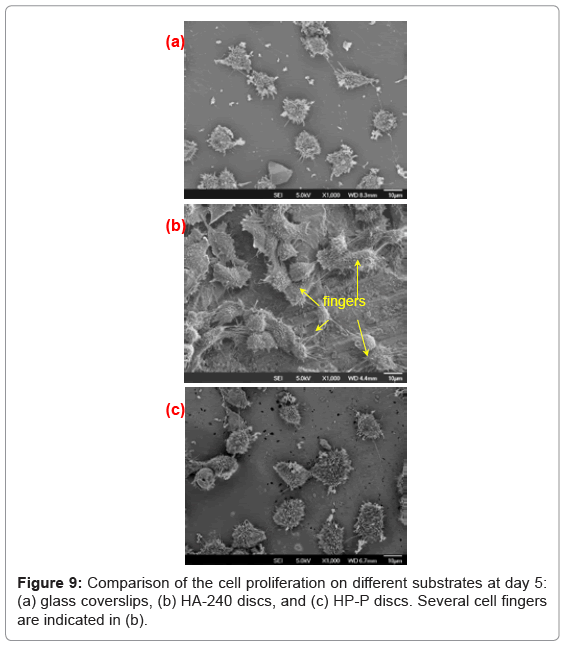
The most salient feature of HA-240 is cell spreading, displayed at day 5. Figure 9 compares the cell morphology at day 5, among the three substrates investigated. It is very clear that cells spread more extensively on HA-240 than on the other two substrates. If we use cells with fingers longer than 10 m to define the extent of spreading, then HA-240 has 100% spreading, because all of its individual cells have fingers longer than 10 m (Figure 9b). In contrast, the corresponding numbers for the glass coverslip and HA-P are only 21% and 14%, respectively, because only 21% and 14% of their individual cells with fingers longer than 10 m. A close look at Figure 9b also reveals that many of cell fingers are forming bridges across grooves, with very rough surface below the cell fingers, suggesting that the grooves underneath cells have enhanced cell spreading. Although cell spreading does not lead to statistically significant difference in the cell number between HA-P and HA-240 at day 5 (Table 1), the average number and the minimum number of cells attached do increase for HA-240 (Figure 8).
It should be pointed out that using human bone marrow cells, Deligianni, et al. [15] have also found favorable effect of surface roughness in enhancing cell attachment and proliferation. However, the size of bone marrow cells in their study, ranges from 20 to 80 m [15], much larger than that of the ROS 17/2.8 cells used in this study. In spite of the difference in the size of cells, both studies reveal the same trend, that is, surface roughness enhances cell adhesion and proliferation. Since the substrate composition is fixed in these studies, the trend observed can only be attributed to the variation in surface roughness.
Conclusion
The effect of surface roughness of HA on ROS 17/2.8 cell response, in terms of cell attachment and proliferation, is investigated in this study. Two surface conditions of HA discs are created; one is at the polishing condition and the other is at the scratched condition (i.e., polishing followed by scratch generation, using a SiC metallographic paper 240-grit). It is shown that the difference in surface roughness between the two surface conditions investigated, is not large enough to exhibit statistically significant difference in the number of attached cells. However, the grooves generated using the SiC metallographic paper do lead to more cell bridges across grooves, higher average number of attached cells, and the highest maximum number of attached cells. The enhanced cell attachment and proliferation via rough surface is attributed to the enhanced availability of the medium, and serum proteins through the grooves underneath the attached cells.
Acknowledgements
This research was sponsored by the U.S. National Science Foundation (NSF), under the contract number CBET-0930365. The support and vision of Ted A. Conway is greatly appreciated.
References
- Shors E, Holmes R (1993) In: Hench LL, Wilson J (Eds.) An Introduction to Bioceramics. World Scientific, Singapore.181-198.
- Okumura M, Ohgushi H, Dohi Y, Katuda T, Tamai S, et al. (1997) Osteoblastic phenotype expression on the surface of hydroxyapatite ceramics. J Biomed Mater Res 37: 122-129.
- de Bruijn JD, van Blitterswijk CA, Davies JE (1995) Initial bone matrix formation at the hydroxyapatite interface in vitro. J Biomed Mater Res 29: 89-99.
- Shin Y, Akao M (1997) Tissue reactions to various percutaneous materials with different surface properties and structures. Artif Organs 21: 995-1001.
- Higashi T, Okamoto H (1996) Influence of particle size of hydroxyapatite as a capping agent on cell proliferation of cultured fibroblasts. J Endod 22: 236-239.
- Sun JS, Tsuang YH, Chang WH, Li J, Liu HC, et al. (1997) Effect of hydroxyapatite particle size on myoblasts and fibroblasts. Biomaterials 18: 683-690.
- de Bruijn JD, Klein CPAT, de Groot K, van Blitterswijk CA (1993) Influence of crystal structure on the establishment of the bone-calcium phosphate interface in vitro. Cells Mater 3: 407-417.
- Hanein D, Sabanay H, Addadi L, Geiger B (1993) Selective interactions of cells with crystal surfaces.Implications for the mechanism of cell adhesion. J Cell Sci 104: 275-288.
- Maxian SH, Di Stefano T, Melican MC, Tiku ML, Zawadsky JP (1998) Bone cell behavior on Matrigel-coated Ca/P coatings of varying crystallinities. J Biomed Mater Res 40: 171-179.
- Morgan J, Holtman KR, Keller JC, Stanford CM (1996) In vitro mineralization and implant calcium phosphate-hydroxyapatite crystallinity. Implant Dent 5: 264-271.
- Boyan BD, Hummert TW, Dean DD, Schwartz Z (1996) Role of material surfaces in regulating bone and cartilage cell response. Biomaterials 17: 137-146.
- Curtis AS, Wilkinson CD (1998) Reactions of cells to topography. J Biomater Sci Polymer Ed 9: 1313-1329.
- Laczka-Osyczka A, Lazka M, Kasugai S, Ohya K (1998) Behavior of bone marrow cells cultured on three different coatings of gel-derived bioactive glass-ceramics at early stages of cell differentiation. J Biomed Mater Res 42: 433-442.
- Keller JC, Collins JG, Niederauer GG, McGee TD (1997) In vitro attachment of osteoblast-like cells to osteoceramic materials. Dent Mater 13: 62-68.
- Deligianni DD, Katsala ND, Koutsoukos PG, Missirlis YF (2001) Effect of surface roughness of hydroxyapatite on human bone marrow cell adhesion, proliferation, differentiation and detachment strength. Biomaterials 22: 87-96.
- Wang J, Shaw LL (2007) Morphology-enhanced low-temperature sintering of nanocrystalline hydroxyapatite. Advanced Materials 19: 2364-2369.
- Zhao H, Dong W, Zheng Y, Liu A, Yao J, et al. (2011) The structural and biological properties of hydroxyapatite-modified titanate nanowire scaffolds. Biomaterials 32: 5837-5846.
- Tan F, Naciri M, Dowling D, Al-Rubeai M (2012) In vitro and in vivo bioactivity of CoBlast hydroxyapatite coating and the effect of impaction on its osteoconductivity. Biotechnol Adv 30: 352-362.
- Wang C, Bai J, Gong Y, Zhang F, Shen J, et al. (2008) Enhancing cell affinity of nonadhesive hydrogel substrate: the role of silica hybridization. Biotechnol Prog 24: 1142-1146.
Relevant Topics
- Agricultural biotechnology
- Animal biotechnology
- Applied Biotechnology
- Biocatalysis
- Biofabrication
- Biomaterial implants
- Biomaterial-Based Drug Delivery Systems
- Bioprinting of Tissue Constructs
- Biotechnology applications
- Cardiovascular biomaterials
- CRISPR-Cas9 in Biotechnology
- Nano biotechnology
- Smart Biomaterials
- White/industrial biotechnology
Recommended Journals
Article Tools
Article Usage
- Total views: 18947
- [From(publication date):
October-2012 - Dec 07, 2025] - Breakdown by view type
- HTML page views : 13685
- PDF downloads : 5262
