Research Article Open Access
Growth Responses of Nutrient-Stressed Cenchrus ciliaris Under Carbon Dioxide Enrichment
| Taou Saleh Ksiksi* and Noor Othman El-Shaigy | |
| Biology Department, UAE University, Al-Ain, United Arab Emirates | |
| Corresponding Author : | Taoufik Saleh Ksiksi Biology Department, Faculty of Science UAE University, Al-Ain 175551 United Arab Emirates Tel: +971507132808 Fax: +97137677535 E-mail: tksiksi@uaeu.ac.ae |
| Received August 31, 2012; Accepted October 19, 2012; Published October 21, 2012 | |
| Citation: Ksiksi TS, El-Shaigy NO (2012) Growth Responses of Nutrient-Stressed Cenchrus ciliaris Under Carbon Dioxide Enrichment. J Earth Sci Climate Change 3:127. doi:10.4172/2157-7617.1000127 | |
| Copyright: © 2012 Ksiksi TS, et al. This is an open-access article distributed under the terms of the Creative Commons Attribution License, which permits unrestricted use, distribution, and reproduction in any medium, provided the original author and source are credited. | |
Visit for more related articles at Journal of Earth Science & Climatic Change
Abstract
The response of plants to carbon dioxide (CO2) enrichment is an important aspect to be thoroughly investigated in order to accurately predict the impact on resource use as well ecosystem level responses. But the extent of response of individual plant species is dependent on the underlying biotic and abiotic stresses. In the current project, the response of Cenchrus ciliaris, a C4 grass, was investigated under CO2 enrichment conditions under nutrient stress. Eco-physiological growth parameters were assessed within two plastic chambers with one chamber kept at ambient CO2 conditions (500ppm) and the second enriched with CO2 (1000ppm). Three treatments were studied: ambient (ACO2), enriched (ECO2) and alternating (alternating two weeks in each chamber; ALCO2). High atmospheric CO2 concentrations did increase shoot and inflorescence production under nutrient stress. The blade area of ECO2 plants was significantly larger than that of ALCO2 plants on the 31st of March 2010 at P=0.06 and on the 7th of April 2010 (P=0.074). Stomatal density of C.ciliaris, however, did decrease for ECO2 and ALCO2. Under ACO2, average sheath biomass was signcantly higher under nutrient stressed condition than under non-stressed condition (65.81% vs. 52.96%; respectively). Growth allocations results revealed a rush toward reproductive production for ECO2 under nutrient stress conditions.
| Keywords |
| ECO2; AlCO2; Biotic and Abiotic stresses; Inflorescence production |
| Introduction |
| With the increase in agricultural activities and the human demand for food, soil supplemented with nutrients becomes an issue. Nitrogen, for instance, is an important element for the growth of all living organisms. It has an important impact on the health, growth, reproduction and survival of many living organisms [1]. Nitrogen is required for many fundamental mechanisms of plants [2]. Plants productivity, protein content and many other important factors for plants extremely depend on the availability of nitrogen [3]. Although nitrogen makes about 78% of the atmospheric gases, it’s has a limited availability in the soil [1]. The available atmospheric nitrogen is not sufficient to support plant. |
| Potassium is another important nutrient for plants that stimulates roots growth that decreases the loss of soil moisture by reducing the transportation and increasing the retention of water in plants [4]. In addition, to has a role in managing Stomatal opening and closure. Another essential nutrient that is needed in large amount for plant growth and development is phosphorus. The most important role of phosphorus is capturing and converting sun light energy into a useful chemical energy for plant use [5]. Phosphorus comes second after nitrogen as the most limiting element that is needed for plant growth [3]. Many reasons could cause a nutrient stress either by limited nutrient avail- ability or limited nutrient uptake by plant. Water stress could be a reason of reducing plants nutrients uptake [6]. Another reason could be the low N fixation that reduces its content in the soil. |
| Soil nutrient availability determines whether the plant will benefit from the CO2 elevation in the long run or not [7]. Increasing atmospheric CO2 concentration could cause an increase in plant growth by increasing the total nutrient uptake and the nutrient use efficiency [8]. Low nutrient supply could decrease the effect of elevated CO2 by reducing sink activity, which leads to photosynthesis acclimation [9]. In this study the extent of nutrient shortage in effecting Cenchrus ciliaris response to CO2 elevation will be assessed. The responses will study from an eco-physiological perspective. |
| Materials |
| This trial was conducted between December 2009 and May 2010 in the United Arab Emirates (UAE) University campus in Al-Ain (N 24.19, E 55.62). It was run within the greenhouse. Two plastic chambers (336 x 244 x 22 cm) were used for this purpose. One chamber was left at the greenhouse CO2 level (ACO2). |
| The CO2 concentration was about 500 ppm. The second chamber had enriched CO2 concentration (ECO2) of about 1000 ppm. The source of CO2 was 20 kg CO2 canisters and was monitored using a carbon dioxide monitor and controller (TONGDY Ltd.). All other conditions (temperature, humidity and light) were kept similar in both chambers. Three groups of C.ciliaris plants, were grown in plastic pots (30 cm in diameter), exposed to enriched, ambient, or alternating CO2. All plants were grown within pots from locally collected seeds. |
| ECO2 plants were exposed continually to enriched atmospheric CO2 during the whole trial between 7:00 to 18:00. A third group of alternating CO2 conditions (ALCO2) included plants exposed every two weeks to either ACO2 or ECO2. Non-stressed plants were supplied with 6.2 g of mixed nutrients (Hydrocomplex parthen). Shoot length, number of blades (green/dry), blade area and inflorescence production were measured every week throughout the trial period. The number of stomata was counted per square area using the epidermal peeling method. |
| The peeling was done two to three times for each of three replicates. |
| Pigment concentration was measured as an indicator of the Chlorophyll con- tent [10] using the following methodology: 5 ml of pure acetone was added to 25 mg of dry blades sample, where it was kept in 4 degrees C and darkness for 24h, grinded with a tissue grinder and kept overnight. The samples were exposed to sonication for 2 min before it was centrifuged in 4 degrees C, span at 3000 rpm for 15 min. The extract absorbance was measured using spectrophotometer at 663.2 nm for Chlorophyll-a and 646.8 nm for Chlorophyll-b [10]. The chlorophyll content (mg.ml-1) was calculated using the formula: Chlorophyll content=A/Ed, where A is the observed absorbance, E is the extinction coefficient (=5 mg/ml), and d is the distance of the light path (=1 cm) SPSS [?] was used to perform ANOVA analysis to compare the main effects (ambient, alternating and enriched CO2) for each of variables under study within each date. |
| Results |
| Plant growth measurements |
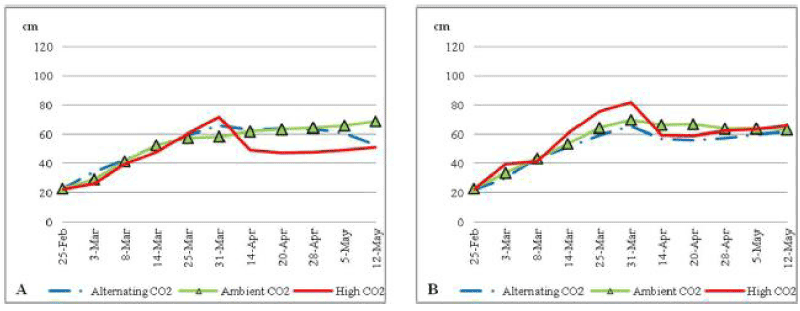
| During the first two month of the trial all nutrient stressed plants (Figure 1) grew shoots with similar patterns under all CO2 conditions. By the third month of the trial plants under nutrient stress and with ECO2 had a sharp decrease in shoot length to reach around 50 cm toward the end of the trial. On the other hand plants under ACO2 and ALCO2 conditions continued with a constant shoot length to reach about 65 cm toward the end of the trial. |
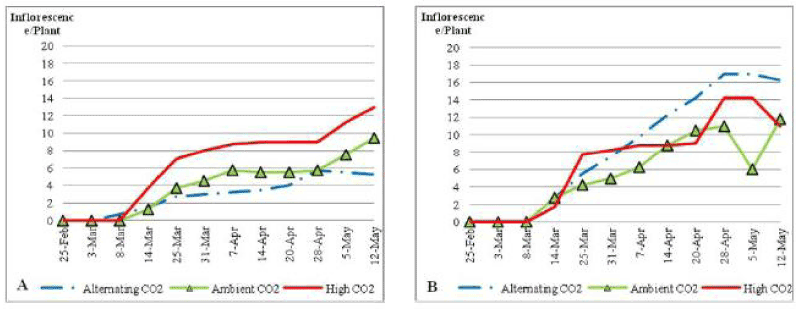
| Under nutrient stress conditions (Figure 2) plants that were grown under ACO2 had the lowest number inflorescence, where ECO2 highly increased the number of growing inflorescence, to reach 13 inflorescences per plant by the end of the treatment. There was no significant difference between treated plants through the trial (P_0:1). Under normal soil nutrient conditions (Figure 2) the inflorescence number was much higher in plants under all CO2 concentrations (P_0:05). |
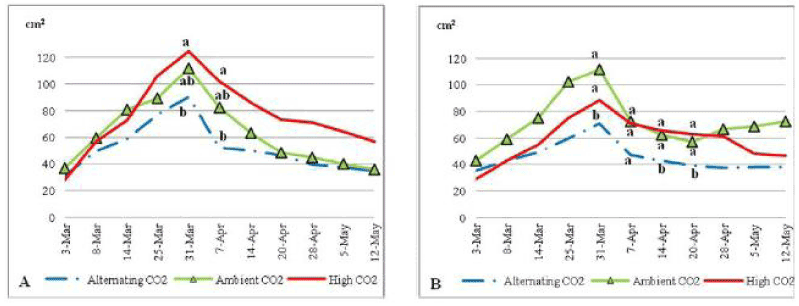
| Plants under ECO2 had the largest blade area of all treated plants most of the experiment, owed by ACO2 plants, and then ALCO2 plants (Figure 3). ECO2 plants had blade area that was significantly larger than ALCO2 plants blade area on the 31st of March 2010 at P=0.06 and on the 7th of April 2010 (P=0.074). When comparing plants under low soil nutrient with those with higher nutrient content (Figure 3) ACO2 and ALCO2 had almost the same blade area but plants treated with ECO2 had larger blade area under low nutrient content, 124.8 cm2 vs. 88.3 cm2 at their peaks. |
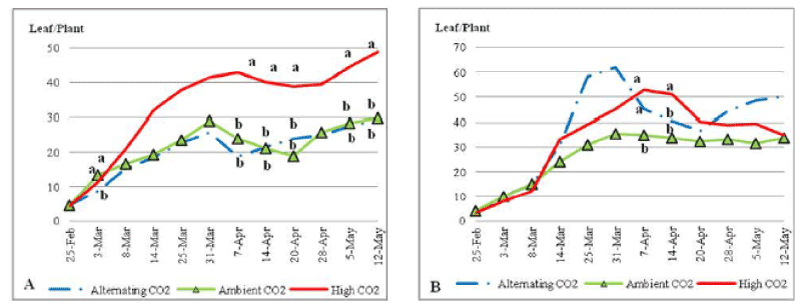
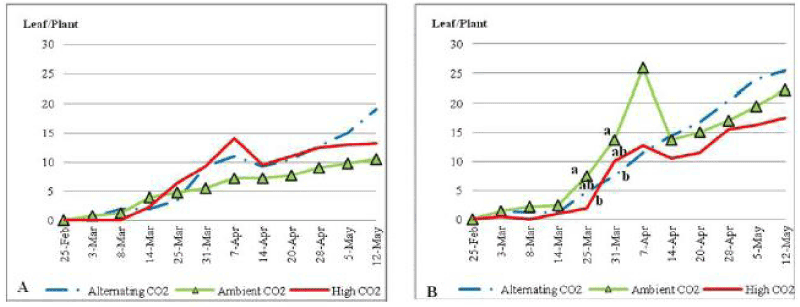
| ECO2 plants under nutrient stress conditions (Figure 4) grew green blades gradually to 1 have the highest average number of green blades in all treated plants with a significantly higher number on the 7th, 14th and 20th of April 2010 and toward the end of the trial at P_0:05. Plants that were grown under ACO2 and ALCO2 ended the trial with the same average number of green blades (i.e. 30 blades per plant). Nutrient stress increased the number of green blades of plants under elevated CO2 compared to plants under normal nutrient content (48 vs. 35 blades per plant) by the end of the experiment. On the other hand the number of green blades declined under nutrient stress for ALCO2 plants. |
| Stomatal density |
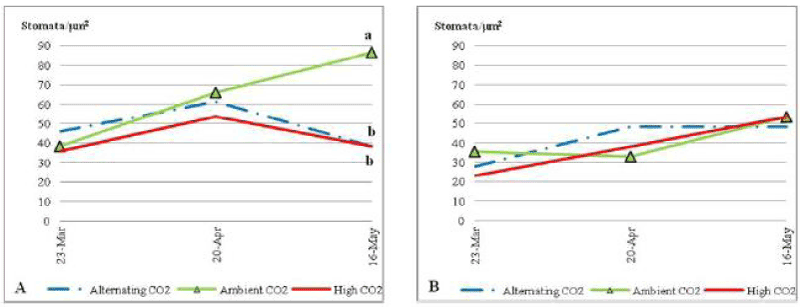
| All plants started the first few weeks of the trial with an average of around 40 stomata per? m2. Plants that grew under nutrient stress (Figure 5), for ECO2 and ALCO2, had a slight increase on the first half of the trial owed by a slight decline on the second half of the trial to end up with the same SD average number (i.e. About 38 stomata per? m2). On the other hand plants under ACO2 continue a gradual increase until the end of the trial, with an average of 86 stomata per? m2. By the end of the trial the difference between ACO2 plants and plants of the other two CO2 treatments was significant (P=0.064). |
| Pigment concentration |
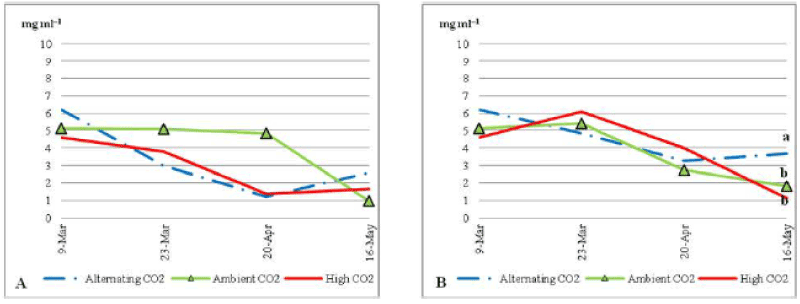
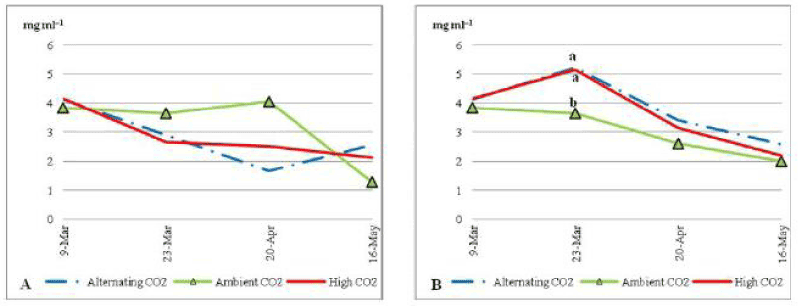
| There was no significant difference between different CO2 treatments for Chlorophyll/a through the trial (P_0:05). ACO2 plants with low nutrient (Figure 6) had a constant average of Chlorophyll/a (about 5 mg ml-1) during most of the trial period. Toward the end of the trial the average concentration of Chlorophyll/a in plants under ACO2 decreased sharply to end up with the lowest average concentration (1.8 mg ml-1). Whereas plants under ECO2 and ALCO2 started with an average of 4.5 and 6.2 mg ml-1 of Chlorophyll/a pigment; respectively and started decreasing until the 20th of April 2010 when the average. |
| Chlorophyll/a pigment increased slightly to end with less than 1.2 and 1.3 mg ml-1; respectively. Comparing to non stressed plants (Figure 7B) under ECO2 and ALCO2 plants shows lower content of Chlorophyll/a, where the opposite happened under ACO2 condition. Chlorophyll/a was higher under nutrient stress. |
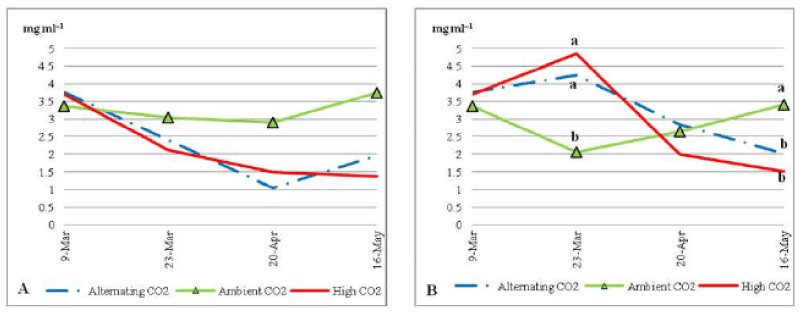
| For Chlorophyll/b under nutrient stress (Figure 7) plants that were grown under ACO2 had the highest concentration of Chlorophyll/b in most of the dates. Chlorophyll/b did increase from 2.8 to 37 mg ml-1 during the last month of the trial. On the other hand, plants that were grown under ECO2 and ALCO2 had a sharp decrease in Chlorophyll/b during the trial, to reach 1.5 mg ml-1 and 1 mg ml-1; respectively on the 20th of April 2010, then 1.4 and 1.9 mg ml-1 by the end of the trial. Chlorophyll/b under stressed condition was generally less than that under non stress condition (Figure 8B) on all three treatments. |
| Plants that were grown in normal soil nutrient conditions had a significantly lower Chlorophyll/b under ACO2, on the 23rd of March and a significantly higher Chlorophyll/b 1 by the end of the trial at P_0:05 under the same CO2 concentration. |
| Growth Partitioning |
| Between-treatments comparison |
| In this section actual growth partitioning - in grams per plant - refers to dry matter content of green blades, dry blades, and sheath and inflorescence production. |
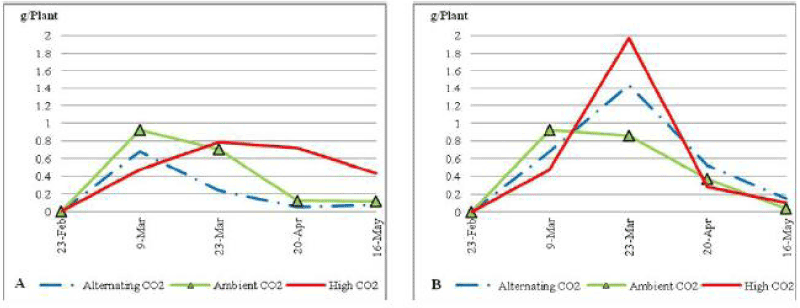
| Both ACO2 and ALCO2 plants had a slight increase in green blades biomass average weight under low soil nutrient condition (Figure 8), with no significant difference at P_0:05 through the trial. Green blades biomass average weight started to decline in the ALCO2 plants after the 9th of March 2010 and on the ACO2 plants after the 23rd of March 2010 to end up the trial with a green blades biomass that is lower than 0.1 g per plant of average weight. On the other hand plants under ECO2 had a very sharp increase in green blades biomass average weight after the 9th of March to reach a peak of 0.6 g per plant on the 20th of April followed by a sharp decrease to end up the trial with 0.3 g per plant. Under non stressed conditions (Figure 8) blades on plants that were exposed to ECO2 and ACO2 reached higher peak of 0.7 g per plant, but that didn’t continue for long and sharply decreased to reach 0.04 g per plant by the end of the trial. |
| Dry blades didn’t appear in any of the treatments until the 9th of March 2010. Plants under nutrient stress (Figure 9) and ECO2 sharply increased their dry blades biomass to reach a peak of 0.55 g on the 20th of April 2010. Whereas plants under ALCO2 started their increase after the 20th of April 2010. On the other hand, dry blade production for plants under ACO2 continued rising very slightly. After the 20th of April both ECO2 and ALCO2 plants had a sharp decline in dry blades to end up the trial with 0.4 g and 0.15 g per plant; respectively. At that time plants under ACO2 increased their dry blades biomass to end with similar values as that of ALCO2 plants (i.e. about 0.15 g per plant). This was much higher than the average dry blades production of plants under normal nutrient condition for all three treatments (ECO2, ACO2, and ALCO2; Figure 9). Sheath biomass average weight started to increase for ECO2 plants after the 9th of March 2010, and after the 23rd of March 2010 for the ACO2 plants. Plants under both treatments continued to grow gradually to end up with the same average sheath biomass of 2.4 g per plant, when grown under soil nutrient stress (Figure 10). On the 23rd of March plants under ECO2 had a significantly higher sheath biomass (P=0.089). ALCO2 plants had a sharp decline in sheath biomass average weight to reach 1 g per plant by the end of the trial. |
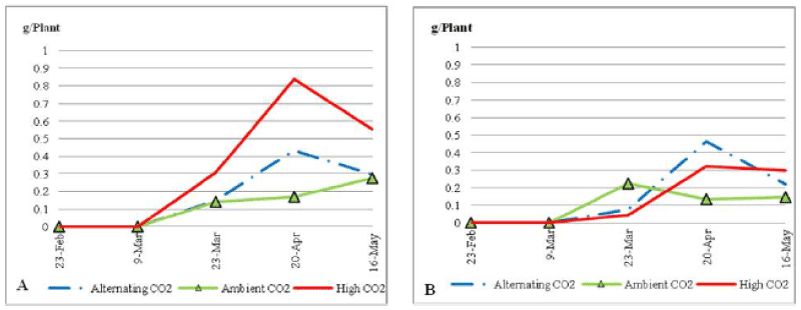
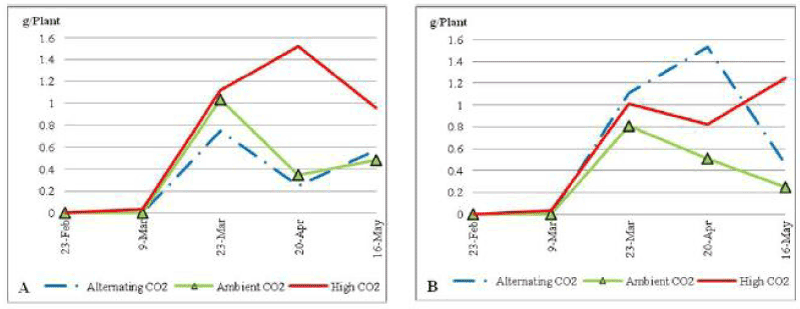
| Plants under soil nutrient stress (Figure 11) didn’t have a significant difference in inflorescence biomass (P_0:05). Under ECO2 plants had a continued increase in inflorescence biomass from its first appearance on the 9th of March 2010 until the end of the trial, to end with the highest inflorescence production. |
| On the other hand both ACO2 and ALCO2 plants fluctuated in inflorescence biomass with the same pattern during the experimental period, to end up the trial with an average of 0.25 g per plant. |
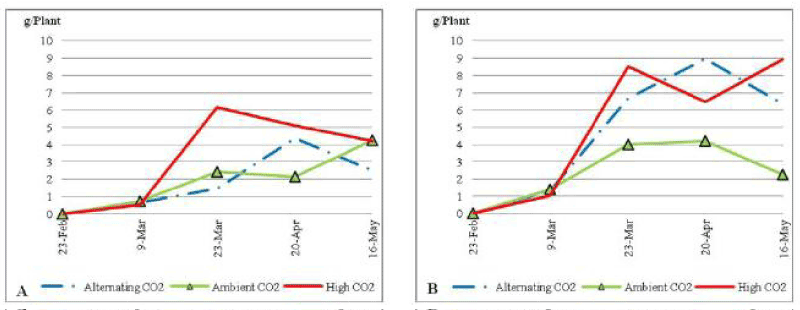
| ACO2 plants under low soil nutrient (Figure 12) had a fluctuating dried biomass average weight that ended up rising sharply to reach 0.45 g per plant by the end of the trial. ALCO2 treated plants had a fluctuating biomass average weight as well, but it ended with a sharp decline to reach 0.1 g per plant by the end of the experiment. On the other hand ECO2 plants had a continued increase in biomass average weight to end up with 0.23 g per plant. There was no significant difference at P_0:05 between different CO2 concentrations through the trial. Under non stressed condition (Figure 12) all plants follow the same pattern in the increase of root biomass average weight with a slight increase that did not exceed 0.15 g per plant. |
| Within-treatments comparison |
| In this section, the effect of nutrient stress was looked at by comparing the biomass growth partitioning of C.ciliaris - in percent of total biomass - com- paring nutrient stressed and non-stressed plants within each CO2 treatment (Figure 13). Under ECO2 most of the difference between the stressed and the non-stressed plants relates to green blade biomass allocation (12.98% vs. 3.63%), sheath biomass (55.88% vs. 62.29%), dry blades (12.65% vs. 16.55%) and root allocation (4.68% and 6.35%); respectively. Under ACO2 nutrient stressed plants had a higher biomass allocation to heath (63.28% vs. 59.13%) than for non-stressed plants. Growth allocation to green blades doubled under stressed than non-stressed plants (7.47% vs. 3.99%). Dry blade allocation was five times lower under stressed when compared to non stressed condition (3.58% vs. 17.93%). Under ACO2 sheath biomass average weight was significantly higher under nutrient stressed condition than under non stressed condition (65.81% vs. 52.96%; respectively). Allocations to all other growth components were significantly lower under nutrient stressed condition than under nonstressed condition. This was true for dry blades (8.96% vs. 16.87%), inflorescence (13.01% vs. 17.85%), roots (7.19% vs. 5.67%) and green blade allocation (5.02% vs. 6.65%). |
| Soil characteristics |
| The difference in soil moisture between soils under the three CO2 concentrations was not significant (P_0:05). This was also true soil salinity, which fluctuated around 0.62 ppt, with no significant difference between soil under different CO2 concentrations (P_0:05). Soil pH was relatively similar among all treatments at (P_0:05). Furthermore, the soil carbon content was not significantly different between the three CO2 treatments (P_0:05). Data for soil characteristics is not shown. |
| Discussion |
| The increase in atmospheric CO2 did not benefit, or in some cases reduced shoot growth of C.ciliaris. High atmospheric CO2 did improve shoot length as well as inflorescence production. Longer observations (i.e. over many seasons) may reveal further discrepancies in growth responses. As it has been previously found that plants under nutrient stress did not benefit from the elevated in the long run [7]. Despite the nutrient shortage, growth could be stimulated in early stages but that will have a negative effect on nutrient cyCO2cling which will affect the late stages of plant growth [7]. In the present study, nutrient-stressed C.ciliaris had a significantly higher number of green blades under high CO2 concentration. |
| Under nutrient stress condition the Stomatal density (SD) of C.ciliaris de- creased under ECO2 and ALCO2. The reduction of SD in C.ciliaris may be an adaptation to the limitations in nutrient availability in the soil. SD affects evapo-transpiration and gas exchange between plants and the surrounding atmosphere. Although some studies proved that the increase in atmospheric CO2 decreased SD [11], other studies reported that many species don’t change their SD when changing atmospheric CO2 levels [12]. The results of this study could be a proof that it’s not the CO2 level as much as the environmental conditions that affects the SD. That could be seen clearly when comparing plants under controlled condition of environmental stresses to those grown in unfertilized soil. It might be the high level of CO2 that decreased the SD but only under conditions of environmental stress. Roots of plants that grew under stressed soil conditions have a sensing capacity of stress that sends some stress signals to the shoot and affects stomata reaction and blades’ growth [13]. Furthermore, both ECO2 and ALCO2 treatment led to decreasing concentrations of plant pigments under nutrient stress. Sheath production was higher under ECO2 and ALCO2 than under ACO2; whereas inflorescences as well as most of the other C.ciliaris parts were con- served by the CO2 enrichment. Aging plants under CO2 enrichment prevented the decrease the total weight of inflorescence, green blades, and sheath in late stages that appears under ACO2. Although some studies showed that the scarce nutrient recourses decrease the effect of elevated CO2 with time (Krner 2003), as the limited soil nutrients are used. Roots didn’t seem to be affected by the enrichment of atmospheric CO2 neither under ECO2 nor under ALCO2. The results of similar studies showed that roots did not respond to elevated CO2 under low nutrient content [14]. CO2 enrichment can’t stimulate underground growth in unfertilized system or a soil with low N concentration [14]. Although it has been proved that high atmospheric CO2 have an effect on cell differentiation within the apical meri stem [11]. Low soil nutrients may have a limiting effect. In this study the results showed that the CO2 enrichment increases the plants water content under non stressed conditions, where it increased the total dry biomass under stressed conditions. The low water content could be caused by the limited growth of roots. Root growth will never increase and it wills never benefit from the CO2 elevation under low nutrient condition [15]. It could affect the 1 water and nutrient uptake from the soil, which will reduce the whole plant growth. Increasing the total root biomass especially _ne roots will increase the expanded root surface area that gives the plants better nutrient and water uptake [3]. |
| When comparing growth partitioning of stressed and non stressed C.ciliaris under the same condition of atmospheric CO2 concentration, the results showed that plants under ECO2 don’t consume much water and energy on the growth organs. On the contrary C.ciliaris spent most of its water and energy on its reproductive parts. Plants under environmental stresses do rush toward reproductive stages to insure the survival of the species. Some studies found that there is no significant impact of elevated CO2 on soil C sequestration [16]. Other studies reported a significant impact on soil C content while few studies showed that CO2enrichment decreases soil content of C [14]. Although it was expected from the CO2 enrichment to alter the C cycle processes in soils according to the other studies. Low soil nutrient content decreased the plants growth as a result of the Progressive Nitrogen Limitation PNL hypothesis and that affects the carbon input to the soil. Atmospheric CO2 increase does not enhance the soil C concentration [17]. Priming, which was defined as the stimulation of SOM decomposition by the addition of labile substrates, in addition to soil moisture that was similar to the normal level under ACO2 might be the cause of the decline in soil SOM. It’s important to mention that carbon content that has been measured includes soil microorganisms. |
| The decrease in soil carbon content under elevated CO2 could be caused by the change in soil microbial composition and activity. CO2 enrichment increased the soil microbial activity which led to the increase of soil organic matter degradation rate more than the rate of soil that was exposed to ACO2 [18]. Under elevated CO2 the increase in plant biomass increased the soil C input to the soil that increases C content available for microbial, that will led to an increase in the demand and consumption of soil nutrients, mainly N [14]. Increasing the plants and soil microorganisms uptake of nutrients could have a negative effect on the soil in the long run under limited soil nutrient. Soil content of nutrient will be stored in long lived plant biomass and soil organic matter. That will limit further microbial mineralization and plant C input under low N content [14]. Furthermore CO2 elevation could decrease the N content in the soil by increasing the microbial immobilization rate under high moisturized soil. That’s why the effect of increasing minerals uptake by CO2 enrichment have more important effect in dry areas than in wet areas [8]. The low content of carbon in soil under ECO2 could be an indication of the low microorganisms and microbial activity in the soil. High concentration of CO2 have an effect on altering the chemical constituents of the plants litter and that changes the organic matter available for the soil microbial metabolism [19]. The increase in soil carbon content was due to an increase in below ground soil carbon input and not the litter input [20]. |
| Acknowledgements |
| The Authors would like to thank Emirates Foundation for partially funding this work (Project No. 2009/76). The Biology Department and the Faculty of Science at the UAEU is indebted for their support in creating an environment that encourages research. Extended thanks are to all colleagues who helped in conducting this project. The formatting of this document to meet this journal’s requirements by Ms. Rabia Hameed Chaudhry is much appreciated. |
References
|
Figures at a glance
 |
 |
 |
 |
 |
| Figure 1 | Figure 2 | Figure 3 | Figure 4 | Figure 5 |
 |
 |
 |
 |
 |
| Figure 6 | Figure 7 | Figure 8 | Figure 9 | Figure 10 |
 |
 |
 |
| Figure 11 | Figure 12 | Figure 13 |
Relevant Topics
- Atmosphere
- Atmospheric Chemistry
- Atmospheric inversions
- Biosphere
- Chemical Oceanography
- Climate Modeling
- Crystallography
- Disaster Science
- Earth Science
- Ecology
- Environmental Degradation
- Gemology
- Geochemistry
- Geochronology
- Geomicrobiology
- Geomorphology
- Geosciences
- Geostatistics
- Glaciology
- Microplastic Pollution
- Mineralogy
- Soil Erosion and Land Degradation
Recommended Journals
Article Tools
Article Usage
- Total views: 13998
- [From(publication date):
November-2012 - Nov 22, 2025] - Breakdown by view type
- HTML page views : 9269
- PDF downloads : 4729
