A Revamped Model of Dust Storm Dry Deposition
Received: 25-Jul-2018 / Accepted Date: 14-Aug-2018 / Published Date: 20-Aug-2018 DOI: 10.4172/2157-7617.1000486
Keywords: Air pollution; Aerosol; Dust storm; Modelling; Deposition velocity
Nomenclature
C: Air pollutant deposition, mole/m3; Cc: Cunningham coefficient, dimensionless; CD: Drag coefficient, dimensionless; CF: Correction factor for wind speed, dimensionless; Cp: Air specific heat coefficient, J/kg.K; d: Particle diameter, m; d0: Zero plane displacement level, m; Dp: Particle diffusivity, m2/s; F: Air pollutant deposition flux, mole/m2. s; g: Gravitational acceleration, m2/s; kB: Boltzmann constant, J/s; Kn: Knudson diameter, dimensionless; Kth: Thermophoretic coefficient, dimensionless; L: Monin-Obukhov length, m; Pr: Prandtl Number, dimensionless; Q: Turbulent heat flux, W/m2; Ra: Aerodynamic resistance, s/m; Rb: Laminar sub-layer resistance, s/m; Rc: Canopy resistance, s/m; Rg: Gravitational settling resistance, s/m; Rt: Total dry deposition resistance, s/m; Rth: Thermophoretic resistance, s/m; Re: Reynolds number, dimensionless; Sc: Schmitt number, dimensionless; St: Stokes number, dimensionless; T0: Air temperature, K; u(z): Wind speed at height z, m/s; u10: Wind speed at 10 m height, m/s; u*: Wind friction velocity, m/s; vd: Dry deposition velocity, m/s; vg: Gravitational settling velocity, m/s; vth: Thermophoretic velocity, m/s; z: Atmospheric height, m; z0:: Roughness height, m; δ: Thickness of laminar sub-layer, λ: Mean free path of air molecules, m; μ: m; κ: von-Karman constant;Dynamic viscosity of air, Pa.s; υ: Kinematic viscosity of air, m2/s; ρ: Air density, kg/m3; ρp: Particle density, kg/m3; ΔT: Temperature gradient of
air, K/m; ψc: Atmospheric stability function, dimensionless
Introduction
A suspension of fine solid particles or liquid droplets in a gas is known as a particulate matter or an aerosol [1]. When small solid particles are transported from the surface of the earth to the air by means of natural forces such as wind blowing or volcanic eruption, then the resulted phenomenon is known as dust [2]. One of the primary tropospheric aerosol components is soil-derived dust [3].
Dust aerosols change the climate patterns in several ways such as acting as nuclei of cloud condensation [4]. The dispersion of dust would also profoundly influence the earth energy intensity by absorption and scattering of the incoming sunlight and its reflection both directly and indirectly from the earth surface [5,6]. Dust contains particles with the sizes from about submicron to more than ten microns [7-9] reported that dust particle size and other physical and chemical properties have been studied but the findings somewhat differ. According to numerous studies, the global dust storms would consist of 59.99% SiO2, 14.13% Al2O3, 6.85% Fe2O3, 3.94% CaO, 2.60% MgO and 2.35% K2O [10]. Dust particles, due to very small sizes, may cause severe respiratory diseases or exacerbate the problem.
The lifecycle of the dust storms can be divided into three main parts: formation, movement (with air flow) and deposition. Deposition, in turn, occurs through two general different categories of dry and wet depositions [11]. In the latter, the deposition would be initiated by precipitation while for the former, there is not any precipitation [12]. Dry deposition includes sub-processes such as turbulence diffusion, gravitational settling, and surface collection [13]. The quantification and modelling of these sub-processes are sophisticated since they depend on many variables such as meteorological conditions (e.g. wind speed and atmospheric stability), particle properties (e.g. size, shape and density) and the surface characteristics (e.g. roughness). Accordingly, Wang et al. [4] stated the need for better quantification and modelling of aerosol dust deposition for effective control of such phenomenon. To ease the problem, most researchers used a common terminology as dry deposition velocity, vd [14-19]. This parameter is important because it relates the vertical flux to the measured concentration of dust for different heights.
A series of experimental analyses performed by Pellerin et al. [20] on deposition of aerosol particles in the range of 2.5 nm to 1.4 μm using a method based on eddy correlation. It was concluded that some important parameters influence the aerosol particle deposition such as friction velocity of the wind, surface sensible heat flux and atmospheric stability. They used the resistance model of dust storm deposition velocity to interpret the results.
For calculation of the dry deposition velocity, the vertical height of atmosphere is divided into two main layers of i) the vicinity layer to the surface which has a thickness of less than one centimeter also named as the laminar sub-layer and ii) the upper layer called the constant flux layer [21,22]. This classification makes it easier to model the deposition process. In general, the deposition process of any type of air pollutants (gases and particles) contains three stages of:
i) Turbulent transport by eddy diffusion from the constant flux layer to the laminar sub-layer,
ii) Molecular diffusion in laminar sub-layer which causes the pollutants to get closer to the surface,
iii) Finally, up taking or bouncing off at the surface [23].
As mentioned before, modeling of dust deposition is complex and previous models are subject to numerous drawbacks such as poor assumptions as they will be elaborated in the following sections. In this study, in order to revamp the previous models, based on more recent studies, new corrections are proposed to improve the deposition model and also to extend its applicability to a wider range of operating conditions. The new proposed model or simply "Modified resistance model" is characterized with better compatibility with the field data which can also be applied to every particle regardless of its size. The thermophoresis, which is due to existence of temperature gradient in the fluid bulk, is also added to the resistance network of deposition and the effects of temperature inversion in the surface layer are further considered. Furthermore, a new simple method to calculate the wind friction velocity based on the wind speed data is included in the proposed model.
Background and Theory
Properties in terms of size, shape, morphology and density would profoundly influence the deposition of particles. As for the large particles, gravitational settling or inertia are among the most important deposition mechanisms. On the contrary, for gases as well as very fine particles, the molecular or Brownian diffusion would primarily be responsible for deposition. Particles with sizes from 0.05 to 1.0 microns have no effective deposition and there is a minimum deposition velocity for this range of particles sizes [24]. The deposition velocity is defined as the ratio of an air pollutant deposition flux (Fd) and its concentration, C [25]:
 (1)
(1)
As it is very difficult to determine the deposition flux, then in practice, for the estimation of dry deposition velocity, another approach based on an analogy to Ohm's law has been suggested. In this method, each deposition sub-process has a resistance. Based on the fundamentals of electronics, the aerodynamic, laminar sub-layer and canopy resistances are in series and respectively associated with turbulent diffusion, molecular diffusion and surface collection. The inverse of the overall resistance (Rt) is equal to the dry deposition velocity [12,26]:
 (2)
(2)
In previous studies, the effect of gravity was neglected; hence, the only considered mechanisms inlude turbulent diffusion, molecular diffusion and surface collection [26]:
 (3)
(3)
This is, nonetheless, true only for very fine particles and gases. Later, the gravity effect was added to the resistance network in parallel to the three previous ones which resulted in the following form of equation [27]:
 (4)
(4)
Numerous researches showed that if the surface is considered as a perfect sink, then the canopy resistance has zero value and can be removed from the equation [28,29]. In addition, a correction is needed to simulate the gravitational mechanism by a resistance. This correction is called virtual resistance and applied in series with the three previous series of resistances as follows [11]:
 (5)
(5)
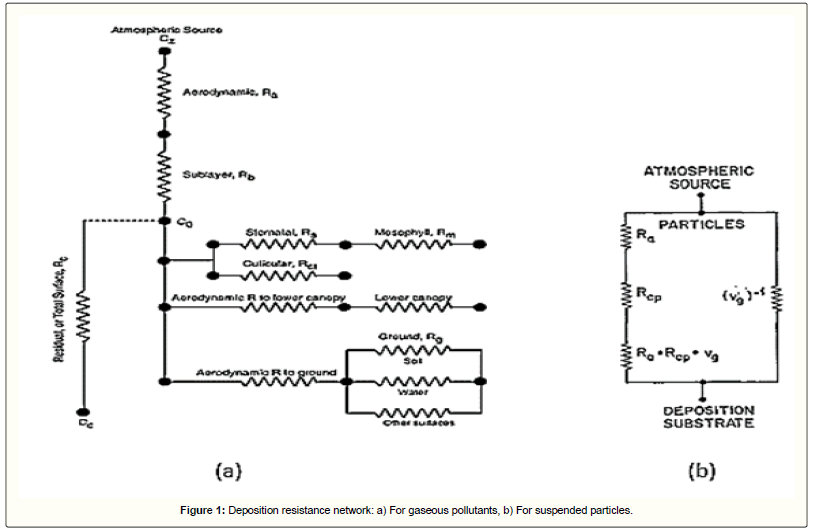
There are several differences between deposition of gaseous pollutants and suspended particles. Gases would have only marginal mass due to their very small size and density; thus, gravity has no effect on their deposition which otherwise would be important for large particles. In addition, for gases, canopy resistance is one of the limiting resistances and should be calculated though it could be neglected for suspended particles [28]. Regarding these explanations, the general scheme for deposition of air pollutants is showed in Figure 1.
The aerodynamic resistance, which represents the turbulent diffusion sub-process, depends on atmospheric conditions and roughness of the surface. In the event of atmospheric stability, Hicks et al. [26] proposed the following equation:
 (6)
(6)
Here, κ is the von Karman constant (≈ 0.4), u* is the wind friction velocity, z is the height from the earth surface, z0 is the roughness height, and ψc is the stability function calculated using the Monin-Obukhov length (L) as follows:
 (7)
(7)
The Monin-Obukhov length is a criterion for determination of the stability condition (L>0 means stable, L<0 means unstable and L→ Infinity represents the natural condition) defined as follows [30]:
 (8)
(8)
in which ρ is the air density, Cp is the heat capacity of air, g is the gravitational acceleration (9.81 m/s2), T0 is the temperature (298 K) and Q is the turbulent heat flux.
In atmospheric natural conditions, the aerodynamic resistance is calculated by Foret et al. [31]:
 (9)
(9)
Another equation is available for this resistance, but its accuracy is lower than Eq. (9) [28]. The laminar sub-layer resistance is associated with the molecular diffusion mechanism and depends on molecular diffusivity of pollutants and the characteristics of the surface. The particle size affects its diffusivity as such that smaller particles have faster Brownian motion because of the lower Schmitt number, Sc [32]. Several correlations have been suggested for this resistance such as the one that is proposed by Wesley and Hicks [33]:
 (10)
(10)
Sc is Schmidt number, Pr is Prandtl number and p is a practical factor (approximately equals to 2/3). Considering the sub-processes of molecular diffusion such as Brownian diffusion and impaction, the following correlation has been suggested by Slinn et al. [34]:
 (11)
(11)
Sc is the Schmidt number for particles which is defined as the ratio of air kinematic viscosity (υ) over the particles diffusivity (Dp) and St is Stokes number of the particles:
 (12)
(12)
 (13)
(13)
 (14)
(14)
In the above equations, υ is the air kinematic viscosity, kB is Boltzmann constant (1.38066 × 10⁻²³ J/K), Cc is the Cunningham correction factor, μ is the dynamic viscosity of air, vg is the terminal velocity of the particles and d is the particles diameter. The Cunningham correction factor, Cc, is introduced in Eq 13 when the particle size is smaller than the mean free path (λ) of the air molecules and is defined as follows [35]:
 (15)
(15)
In Eq 15, Kn, as Knudsen number, is expressed as follows:
 (16)
(16)
The other expression for the laminar sub-layer resistance is based on the similarity to that one of aerodynamic resistance [26]:
 (17)
(17)
In dust deposition, the gravitational settling velocity for larger particles is considerable. It can thus be calculated via the balance of gravitational and drag forces if one neglects the buoyancy force (because of the larger particle density in comparison to the air density). If the Stokes law is established (Re < 0.01), the settling velocity will be as follows [36]:
 (18)
(18)
ρp is the particle density. This is the classical Stokes-Einstein equation. For particles with diameters smaller than 10 micrometres, the Cunningham coefficient is required as a correction factor. Hence, the corrected settling velocity will be [37]:
 (19)
(19)
This settling velocity cannot be used for the particles with Reynolds numbers, Re > 0.01; thus, a general correlation has been suggested which takes into account the impact of drag coefficient, CD [1,11]:
 (20)
(20)
In order to determine CD, numerous empirical correlations have been proposed [38-41] based on the utilization of the following Re number:
 (21)
(21)
The latest model of dust storm dry deposition, which has proposed by Giardina and Buffa [42], was also based on the electrical analogy. In this model, they assumed that combination of resistances which would influence particles deposition in the quasi-laminar sub-layers; it is possible to take into account local features of the mutual influence of inertial impact processes as well as the turbulent flow. The previous models [26,27] for dust deposition include several drawbacks which limit the range of their applicability. On one hand, these models did not consider the gravitational settling and the Stokes law as these were valid only for a limited range of particle diameters. Moreover, the drag coefficient presented in these models should approximately be calculated and a proper correlation has not yet been proposed. On the other hand, uncertainties associated with determination of settling velocity significantly affect the laminar sub-layer resistance calculations due to the relevant Stokes Number errors. Wind friction velocity which is utilized in formulation of the both aerodynamic and laminar sublayer resistances was considered constant. Its value was adjusted only based on the wind tunnel experiments and the basis of field and the meteorological data were not considered for the associated calculations. Hence, the values of those resistances are neither real nor accurate. The thermophoretic mechanism which is affected by the air temperature gradient, was not considered too. In addition, the special conditions like the temperature inversion was not considered in the previous models. Furthermore, some of the presented resistance equations resulted in significant errors when compared with the field data. These reasons would provide grounds for modification of resistance model of deposition for dust particles. Although the recent model proposed by Giardina and Buffa [42] was consistent with the experimental results, but they did not consider the thermophoresis. Calec et al. [43] also experimentally investigated the particle deposition velocity in a wind tunnel in which the thermophoresis effect has been studied but no model still exists.
New Model for Dry Deposition
The Modified Resistance Model is proposed to estimate the deposition of dust particles on smooth earth's surface. As commonly for every model, there are several assumptions which are as follows.
Model assumptions
In order to remove the effects of Earth's rotation and subsequently the Coriolis force (the force applied to wind and every moving subject as earth turns around itself), only the height below than 100 meters is considered with respect to the earth's surface. For the wind speed at different heights, a general velocity profile is defined which consists of a logarithmic profile for below and one-seventh power-law profile for above a reference height of 10 meters [44-46]. To introduce the atmospheric stability condition into the model, the Pasquill Stability Classification is used in each of six classes. The Monin-Obukhov length could be determined with roughness height of the surface [47]. Hence, this model can be used for every atmospheric condition.
Given a wide range of dust particle sizes, an empirical correlation is also used for dragging coefficient which matches very well with the experimental data [38]. It is assumed that the surface layer has a temperature gradient of -0.0065 K/m in normal condition and a temperature gradient of approximately +0.1 K/m in temperature inversion state [48,49]. Particles are also assumed to be spherical and based on the chemical analyses [10,50,51], they mainly contain quartz sand, limestone and clay; thus, their density will be 1200, 2560 and 1073 kg/m3.
Aerodynamic resistance
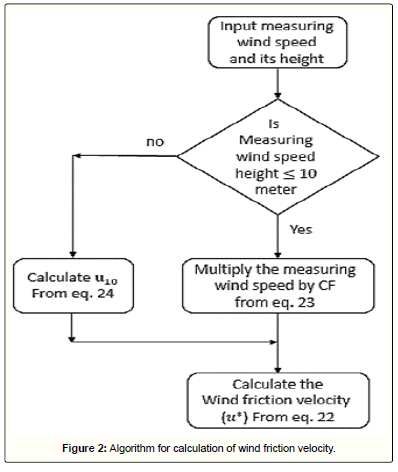
The transport of the dust particles from the atmosphere to the laminar sub-layer is mainly due to the eddy diffusion. As mentioned before, this mechanism is modelled by the aerodynamic resistance which strongly depends on the wind speed and surface roughness, as expressed in Eq 6. In this equation, the condition of atmospheric stability is introduced by the stability function, i.e., Eq 7. The problem here is how to determine the wind friction velocity, u*. The previous models were complex and consequently required numerous parameters. Here, a simple approach is suggested based on the wind speed measured by an anemometer. According to the earlier studies [52], 10-meter height from the earth's surface is selected as the reference height. If the measuring element is placed in this level, u* can be calculated from a logarithmic velocity profile as:
 (22)
(22)
where u10 is the wind speed at the reference height. If for any reason, the device is installed at a lower height, then the reported wind speed should be multiplied by a correction factor (CF), as given below, then the resulted speed will be used in Eq 22 [53]:
 (23)
(23)
In this equation, z is the measuring height in meter. Furthermore, if the device is installed at a height over 10 meters, then the measured speed should at first be converted to the speed at 10-meter height, by the one-seventh power-law velocity profile as follows:
 (24)
(24)
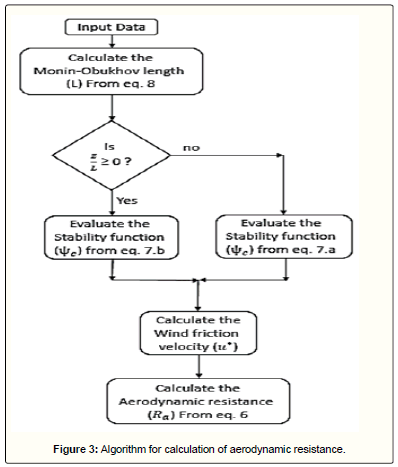
By gaining the wind friction velocity, the aerodynamic resistance can be calculated from Eq 6. This algorithm and the procedure for calculation of aerodynamic resistance are showed in Figure 2 and Figure 3, respectively.
Laminar sub-layer resistance
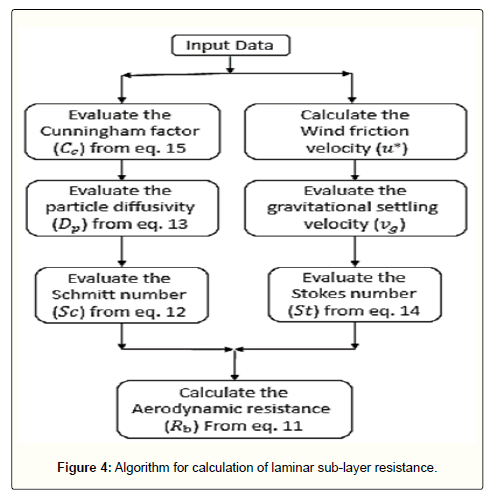
For solid particles, two sub-processes are included in laminar sublayer. Their summation will include the molecular diffusion in laminar sub-layer adjacent to the surface, Brownian movement of the particles and the impaction. Eq 11 would sufficiently represent this mechanism and does not need any correction; however, the wind friction velocity in this equation should be calculated from the procedure represented in Figure 2. Also, the settling velocity (vg) which is used in Stokes number (St), should be determined by the algorithm explained in the next section. The algorithm for calculation of the laminar sub-layer resistance is presented in Figure 4.
Gravitational settling resistance
In most previous models for gravitational settling mechanism, Stokes law has been used which is valid for Re < 0.01[28,54] However, when the particles are larger (over approximately 20 microns), this condition may not be satisfied. Hence, the drag coefficient should be calculated more accurately. On the other hand, when the particles have diameters smaller than 10 microns, then the use of Cunningham factor will be necessary. By using the following correlation in the modified resistance model (based on an experimental research reported by Clift et al. [38], a much more accurate result in gravitational settling velocity will be gained:
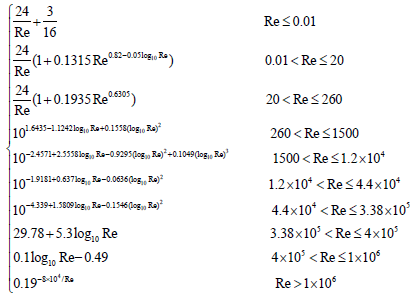 (25)
(25)
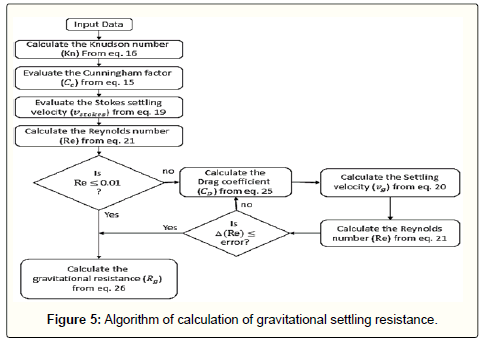
For calculation of drag coefficient, Reynolds number should be determined firstly. To do so though, the settling velocity should be given which is not readily available. Thus, a trial and error calculation are required. Like the algorithm represented in Figure 5, after calculating the Knudson number Eq 16 and Cunningham factor Eq 15, the Stokes velocity is used in Reynolds relation Eq 21. By the use of this value, the first-step drag coefficient is evaluated from Eq 25. Based on Eq 20, the new gravitational settling velocity will be gained. These steps need to be repeated until the error becomes negligible. The gravitational resistance can then be calculated via inversing the gravitational settling velocity as:
 (26)
(26)
Thermo-phoretic resistance
If an aerosol which consists of solid particles has a temperature gradient between two regions, an extra force will be appeared which causes the migration of fine particles from hotter to colder region. The resulted movement is called thermophoresis [55,56]. Studies showed this phenomenon overwhelmingly depends on particle size and temperature gradient in which the thermophoretic velocity can be defined as [56]:
 (27)
(27)
In this equation, VT is the temperature gradient (K/m), T0 is the fluid temperature at the place of the particle, v is the kinematic viscosity of the fluid and Kth is the thermophoretic coefficient. Many investigations represented the following general relation for Kth [57-58]:
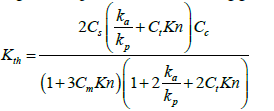 (28)
(28)

Also, here, ka and kp are respectively the thermal conductivity of the fluid and particles.
The atmosphere has temperature gradients in different heights and according to the domain of this research (the lower 100 meter of the atmosphere), this gradient has a constant value (as mentioned before, it is about -0.0065 and +0.1 in normal and inversion conditions, respectively). Hence, it is expected that this temperature gradient affects somewhat the deposition of dust particles. For this reason, a resistance called as the thermophoretic resistance, is considered in the modified resistance model and is determined via inverse of the thermophoretic velocity:
 (29)
(29)
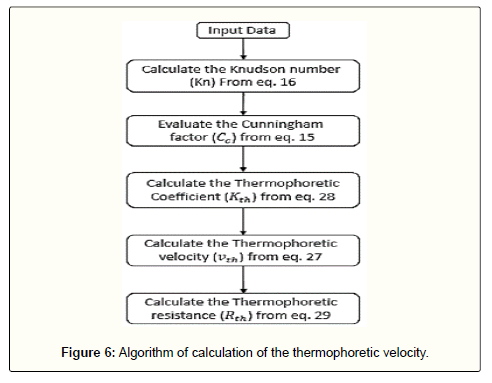
The procedure for the calculation of the thermophoretic resistance is given in Figure 6.
Cumulative model
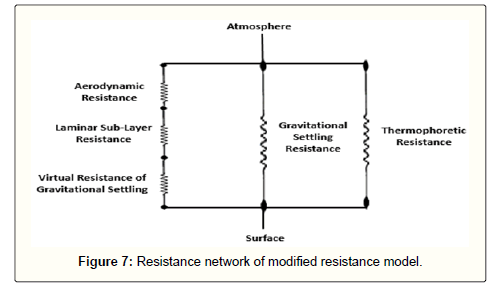
The deposition velocity of dust particles between atmosphere and the earth's surface can be calculated by means of the total resistance which includes the overall effects of the deposition mechanisms such as turbulent diffusion, molecular diffusion, gravitational settling and thermophoresis. As mentioned before, the first two resistances and the virtual gravitational settling resistance should be in series. Since gravity and thermophoresis have their own independent mechanisms and the deposition is influenced by these two mechanisms in the whole domain from the atmosphere bulk to the surface, then their resistances will be in parallel with the former one. A simple scheme of the modified resistance model for dust particles deposition is depicted in Figure 7.
According to the fundamentals of electrical circuits, the overall dry deposition resistance can be expressed as:
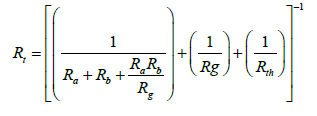 (30)
(30)
The total dry deposition is the inverse of Rt.
Results and Discussion
The present section discusses the results of the modified resistance model for dust particles deposition on the smooth surface of earth. In this study, according to the analysis of the dust samples, the particles densities are considered as 1073, 1200 and 2560 kg/m3 for clay, quartz sand and limestone, respectively. The range of particles diameters is selected from 0.001 to 200 microns to investigate all of the dry deposition mechanisms. The wind friction velocity varies from 0.043 to 0.868 m/s for wind speeds of 1 to 20 m/s. This domain covered the variations of wind speed in the surface layer. The temperature gradient used in the calculation of thermophoretic resistance is equal to -0.0065 and +0.1 K/m for normal and inversion conditions, respectively.
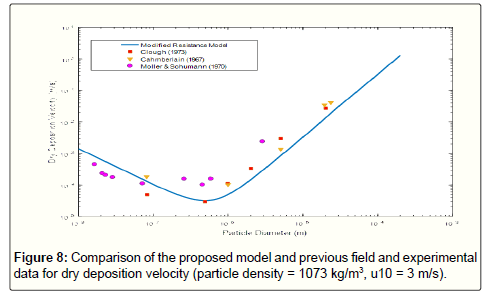
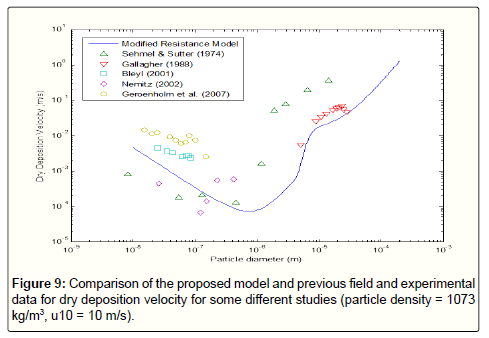
The comparison of previous field data points as well as those obtained from the modified resistance model confirms the reliability of the proposed model, (Figure 8). The existing errors are because of the differences in various parameters affecting the results such as assumption of particle sphericity. In Figure 9, the comparison of the result of modified resistance model with more data from other researches about deposition velocity in different experimental conditions. It is obvious that the modified resistance model is in compliance with the overall trend of previous reported data.
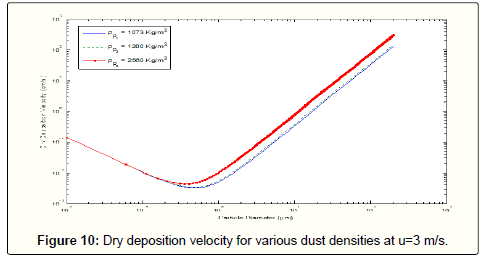
To study the influence of particle density on the total dry deposition velocity, more calculations are conducted for the three materials of clay, quartz sand and limestone, which are the most primary components of the dust particles. As shown in Figure 10, the deposition velocity is expected to increase for larger particle densities. In this figure, particle densities have almost no meaningful impact on deposition density for particles smaller than approximately 0.2 microns. Furthermore, the difference between the velocities of two particles with different materials has a constant value for the larger particles. This difference is still negligible in comparison to the deposition velocity.
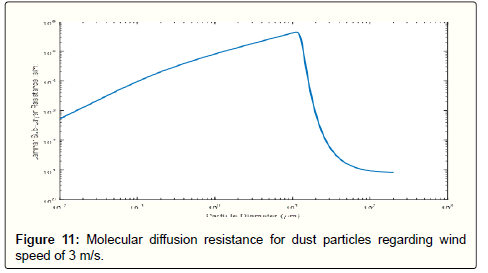
For every dust particle size distribution, there is a minimum velocity in the size range of 0.1 to 1 micron. This is stemmed from alteration in the dominant mechanism of deposition. For smaller particles, gravity has a negligible effect and deposition is almost totally a function of diffusion sub-processes such as eddy and molecular diffusion. For particles with diameters lower than one-micron, Brownian movement is the primary deposition sub-process. The larger particles are though deposited by impaction. This is shown in Figure 11 where the laminar sub-layer resistance has the largest value for particles diameter about 1 micron and it decreases by either increasing or decreasing the particles diameter. The reason of increase for smaller particles is due to increased Brownian movement while for the larger particles is because of increased impaction. In other words, the molecular diffusion resistance due to Brownian motion increases with diameter but the resistance related to impaction decreases with diameter, so the net result of these two mechanisms is made the smallest deposition velocity in this range of particle size.
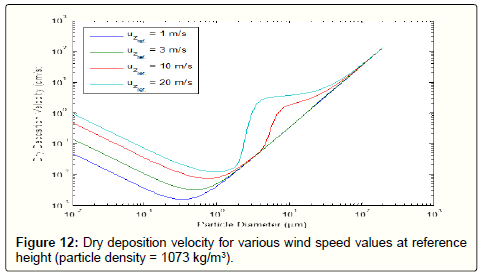
Wind speed is an important parameter affecting dust deposition. Deposition velocities for various wind speeds are also shown in Figure 12.
Higher wind speeds would increase the turbulent mixing and eddy diffusion. Thus, the smaller particles have higher deposition velocities.
The wind speed has also only a marginal impact on larger particles because of their higher Stokes number and the dominant mechanism of gravitational settling. As shown in Figure 12, for particles in the range of about 0.2 to 50 microns, smaller wind speeds (i.e. lower than 3 m/s) have no effect on deposition velocity but larger values (i.e. 10 m/s) increases the deposition velocity. Particles larger than 50 micrometers do not experience considerable effects since their dominant deposition process is gravitational settling which is primarily independent of wind speed. Also, from Fig. 12 it can be seen that the higher wind speeds the higher the diameter of the particles which have the minimum deposition velocity and the lower dependency of deposition velocity on particle diameters larger than one micron. This is because higher wind speeds would result in increased wind friction velocity and this would, in turn, reduce the laminar sub-layer resistance. Moreover, diffusion would intensify as the wind speed increases which this, in turn, facilitates the deposition of even larger particles at higher gas speeds.
Numerical values of dry deposition resistances of dust particles with several selected diameters for various mechanisms are reported in Table 1.
| Rt (s/m) | With Temperature Inversion (s/m) | Without Temperature Inversion (s/m) | Rg (s/m) | Rb (s/m) | Ra (s/m) | D (µm) |
|---|---|---|---|---|---|---|
| 56.3 | 3.49 × 10⁸ | 0.537 × 10¹⁰ | 9.28 × 10⁷ | 6.66 | -- | 0.001 |
| 190.8 | 3.53 × 10⁸ | 0.543 × 10¹⁰ | 9.06 × 10⁶ | 141.14 | -- | 0.01 |
| 2605.8 | 3.76 × 10⁸ | 0.579 × 10¹⁰ | 7.02 × 10⁵ | 2565.63 | -- | 0.1 |
| 9647.6 | 4.63 × 10⁸ | 0.712 × 10¹⁰ | 1.73 × 10⁴ | 21715.25 | -- | 1 |
| 43.5 | 7.21 × 10⁸ | 1.11 × 10¹⁰ | 198 | 4.92 | 49.64 | 10 |
| 26.1 | 7.65 × 10⁸ | 1.177 × 10¹⁰ | 50 | 2.57 | -- | 20 |
| 7.1 | 7.96 × 10⁸ | 1.224 × 10¹⁰ | 8 | 2.14 | -- | 50 |
| 2 | 8.07 × 10⁸ | 1.241 × 10¹⁰ | 2 | 2.09 | -- | 100 |
| 0.9 | 8.11 × 10⁸ | 1.247 × 10¹⁰ | 0.9 | 2.08 | -- | 150 |
| 0.5 | 8.12 × 10⁸ | 1.25 × 10¹⁰ | 0.5 | 2.07 | -- | 200 |
Table 1: Summary of the groundwater potential zones delineated in the study area.
It can be concluded that aerodynamic resistance is independent of particles diameters. The laminar sub-layer resistance is large for particles between 0.001 to 1 micron which serves as prime deposition mechanism. As expected, the gravitational settling is the dominant process in deposition of larger particles.
It is clear from these data points Table 1 that the resistance of thermophoresis is about 3 to 6 order of magnitude smaller than the others. Consequently, the other resistances would have greater impacts on dust deposition. Thermophoretic resistance becomes larger when the temperature gradient increases; hence, it is obvious that the temperature inversion helps dust deposition. The opposite is true when the air pollutants are gaseous. On the other hand, in normal atmospheric condition the temperature gradient is a negative factor for deposition of dust, because temperature decreases with height and the thermophoretic force is applied to the particles from bottom to top of the air layer [59-69].
Conclusion
The life-time of dust ends by deposition and only begins to move again if they are detached from the surface. A useful way for modelling of the moving particles from atmosphere to the surface by every mechanism except precipitation, which called dry deposition, is to use various resistances for each mechanism. These resistances form a network of resistances and the inverse of the equivalent resistance of the network will be the total dry deposition of particles. In this study, the resistance model is modified by the use of a more accurate drag coefficient to revamp the gravitational settling velocity. In the proposed model also, a simple method for calculation of wind friction velocity is used. The modified resistance model would be able to determine the dry deposition velocity of dust particles not only for normal metrological conditions, but also under temperature inversion conditions. The resultant findings showed that particles density has a negligible effect on deposition while the wind speed has no noticeable influence on deposition of particles larger than 50 microns. The molecular and eddy diffusion are important for particles with diameter below 0.1 microns, while the gravitational settling is dominant for particles greater than 1 micron. Finally, for particles in the middle range of 0.1 to 1 micron, none of the underlying mechanisms are dominant thus these particles would remain suspended in air for longer period of time.
References
- Hinds WC (1998) Aerosol technology, properties, behavior and measurement of airborne particles. (2nd edn), John Wiley and Sons, NY, USA.
- IUPAC (1990) Glossary of atmospheric chemistry terms. International Union of Pure and Applied Chemistry. Pure and Applied Chemistry 62: 2167-2219.
- Houghton JT, Ding Y (2001) Climate Change: The Scientific Basis, Contribution of Working Group I to the Third Assessment Report of the Governmental Panel on Climate Change. Cambridge Univ.
- Wang F, Zhao X, Gerlein-Safdi C, Mu Y, Wang D, et al. (2017) Global sources, emissions, transport and deposition of dust and sand and their effects on the climate and environment: A review. Frontiers of Environmental Science & Engineering 11: 1-13.
- Sokolik I, Toon OB (1996) Direct radiative forcing by anthropogenic mineral aerosols. Nature 381: 681-83.
- Sokolik I, Winker DM, Bergametti G, Gillette DA, Carmichael G, et al. (2001) Introduction to special section: Outstanding problems in quantifying the radiative impact of mineral dust. Geophys. Res 106: 18015-18028.
- D’Almeida GA, Schütz L (1983) Number, mass and volume distributions of mineral aerosols and soils of Sahara. Clim Appl Meteorol 22: 233-243.
- Gomes L, Bergametti G, Coudé-Gaussen G, Rognon P (1990) Submicron desert dusts: A sandblasting process. Geophys Res 95: 13: 927-935.
- Lyu Y, Qu Z, Liu L, Guo L (2017) Characterization of dust fall in rural and urban sites during three dust storms in northern China. Aeolian Research 28: 29-37.
- Goudie AS, Middleton N (2006) Desert dust in the global system. Springer, UK.
- Seinfeld JH, Pandis SN (1998) Atmospheric chemistry and physics: From air pollution to climate change. John Wiley & Sons Inc
- Seinfeld JH, Pandis SN (2006) Atmospheric chemistry and physics: from air pollution to climate change (2nd ed). John Wiley & Sons Inc., Hoboken pp: 900-929.
- Droppo JG (2006) Improved formulations for air-surface exchanges related to national security needs: dry deposition models. Pacific Northwest National Laboratory, Richland, WA.
- Wood NB (1981) A simple method for the calculation of turbulent deposition to smooth and rough surfaces. Aerosol Sci 12: 275-290.
- McMurry PH, Rader DJ (1985) Aerosol wall losses in electrically charged chambers. Aerosol Sci. Technol 4: 249-268.
- Nazaroff WW, Cass GR (1989) Mass-transport aspects of pollutant removal at indoor surfaces. Envir. Int 15: 567-584.
- Lai ACK (2005) Modeling indoor coarse particle deposition onto smooth and rough vertical surfaces. Atmos. Environ, 39: 3823-3830.
- Hussein T, Hruska A (2009) Deposition rates on smooth surfaces and coagulation of aerosol particles inside a test chamber. Atmos Environ 43: 905-914.
- Piskunov VN (2009) Parameterization of aerosol dry deposition velocities onto smooth and rough surfaces. Aerosol Sci 40: 664-679.
- Pellerin G, Maro D, Damay P (2017) Aerosol particle dry deposition velocity above natural surfaces: Quantification according to the particles diameter. Journal of Aerosol Science.
- Slinn SA, Slinn WGN (1980) Predictions for particle deposition on natural waters. Atmos. Environ.14: 1013-1016.
- Giorgi F (1988) Dry deposition velocities of atmospheric aerosols as inferred by applying a particle dry deposition parameterization to a general circulation model. Tellus 40B: 23-41.
- Gronholm T (2012) Deposition of fine particles over a boreal forest. Report Series in Aerosol Science, University of Helsinki, Helsinki, Finland.
- Harrison RM, Abdalmogith SS, Derwent RG (2006) Particulate sulphate and nitrate in Southern England and Northern Ireland during 2002/3 and its formation in a photochemical trajectory model. Sci. Total Environ 368: 769-780.
- Gregory PH (1945) The dispersion of air-borne spores. Fungal Biol 28: 26-72.
- Hicks BB, Baldocchi DD, Meyers TP, Hosker RP, Matt JR, et al. (1987) A preliminary multiple resistance routine for deriving dry deposition velocities from measured quantities. Water, Air, and Soil Pollution 36: 311-330.
- Zufall MJ, Davidson CI (1998) Dry deposition of particles. Atmospheric Particles 5: 425-473.
- Mohan SM (2016) An overview of particulate dry deposition: measuring methods, deposition velocity and controlling factors. Environ Sci Technol 13: 387-402.
- Obukhov AM (1946) Turbulence in an atmosphere with a non-uniform temperature. Trudy Inst Theor Geofiz AN SSSR1: 95-115.
- Foret G, Gilles B, Dulac F, Menut L (2006) An optimized particle size bin scheme for modeling mineral dust aerosol. Geophysical Research Atmospheres 111: D17.
- Bruse M (2007) ENVI-met implementation of the gas/ particle dispersion and deposition model PDDM. pp: 1-7.
- Wesley ML, Hicks BB (1977) some factors that affect the deposition rates of sulfur dioxide and similar gases on vegetation. Journal of the Air Pollution Control Association 27: 1110-1116.
- Slinn WGN (1982) Predictions for particle deposition to vegetative canopies. Atmos Environ 16: 1785-1794
- Fuchs NA (1964) The mechanics of aerosols. Pergamon Press, Oxford, UK. pp: 26-27.
- Lamb H (1994) Hydrodynamics (6th edn). Cambridge University Press, UK. ISBN  978: 521-45868
- Seinfeld JH (1986) Atmospheric chemistry and physics of air pollution. John Wiley & sons, NY, USA.
- Clift R, Grace JR, Weber ME (1978) Bubbles, drops, and particles (Dover Civil and Mechanical Engineering), Academic Press, New York, USA.
- Flemmer RLC, Banks CL (1986) On the drag coefficient of a sphere. Powder Technology 48: 217-221.
- Turton R, Levenspiel O (1986) A short note on the drag correlation for spheres. Powder Technology 47: 83-86.
- Brown PP, Lawler DF (2003) Sphere drag and settling velocity revisited. ASCE 129: 222-231.
- Giardina M, Buffa P (2018) A new approach for modeling dry deposition velocity of particles. Atmospheric Environment 180: 11-22.
- Calec N, Boyer P, Anselmet F, Amielh M, Branger H, et al. (2017) Dry deposition velocities of submicron aerosols on water surfaces: Laboratory experimental data and modelling approach. J Aerosol Sci 105: 179-192.
- Oke TR (1978) Boundary layer climates (2nd edn). Taylor & Francis e-Library Ch-2.
- Aspliden CI, Eliott DL, Wendell LL (1986) Resource assessment methods, siting and perfomance evaluation. Physical Climatology for Solar and Wind Energy. In: Guzzi R. and Justus CG (Eds) Conference Proceedings Miramare -Trieste Italy.
- Farrugia RN (2002) The wind shear exponent in a Mediterranean island climate. Renewable Energy 28: 647-653
- Hirabayashi S, Kroll CN, Nowak DJ (2012) Development of a distributed air pollutant dry deposition modeling framework. Environmental Pollution p: 171.
- Lazaridis M (2011) First principles of meteorology and air pollution. Springer, UK.
- Hudson SR, Brandt RE (2004) A look at the surface-based temperature inversion on the Antarctic Plateau. Climate 2: 1.
- Rashki A (2012) Seasonality and mineral, chemical and optical properties of dust storms in the Sistan region of Iran, and their influence on human health 2: 1.
- Al-Dabbas M, Al-Khafaji R (2012) Some geochemical, textural and radioactive characteristics of the sandstorms loads blown over Baghdad and Ramadi cities, middle Iraq. 1st Conference on Dust Storms and their environmental effects. 21: 17-18
- Cheng Chen Y, Bundy DS, Hoff SJ (1998) Modeling the variation of wind speed with height for agricultural source pollution control. Agricultural and Biosystems Engineering Publications 2: 1.
- Miller S (1994). Handbook for agrohydrology, Chatham, UK. Natural Resources Institute, ISBN 7: 859-54-389.
- Zhang J, Li A (2008) CFD simulation of particles deposition in a horizontal turbulent duct flow. Chemical Engineering Research and Design 86: 95-106.
- Tyndall J (1870) On dust and disease. Proc. Royal Institution of Great Britain, UK. 6: 1-14.
- Talbot L, Cheng RK, Schefer RW, Willis DR (1980) Thermophoresis of particles in a heated boundary layer. Fluid Mech 101: 737-758.
- Loyalka, SK, Ferziger JH (1967) Approximate method in the kinetic theory. Phys Fluids 10: 1833.
- Loyalka SK (1968) Momentum and temperature slip coefficients with arbitrary accommodation at the surface. Chem Phys48: 5432.
- Bleyl M (2001) Experimentelle bestimmung der depositionsgeschwindigkeit luftgetragener partikel mit hilfe der eddy-kovarianzmethode über einem fichtenaltbestand im solling.
- Chamberlain AC (1967) Transport of Lycopodium spores and other small particles to rough surfaces. Proc Roy Soc London 296: 45-70.
- Clough WS (1973) Transport of particles to surfaces. Aerosol Sci 4: 227-234.
- Gallagher W, Choularton T, Morse A, Fowler D (1988) Measurements of the size dependence of cloud droplet deposition at a hill site. Meteorol Soc 114: 1291-1303.
- Gebhart J, Heyder J, Stahlhofen W (1984) Simultaneous diffusional and gravitational deposition of aerosol particles. In: Liu BYH (Ed.) Aerosols, Elsevier, New York, USA. pp: 1023-1026.
- Hojati S, Khademi H, Faz Cano A, Landi A (2012) Characteristics of dust deposited along a transect between central Iran and the Zagros Mountains. Catena 88: 27-36.
- Moller U, Schumann G (1970) Mechanisms of transport from the atmosphere to the earth's surface. Gaophls. Res 75: 3013 -3019.
- Nemitz E, Gallagher MW, Duyzer JH, Fowler D (2002) Micrometeorological measurements of particle deposition velocities to moorland vegetation. Q J Roy Meteor Soc 128: 2281– 2300.
- Sehmel GA, Sutter SL (1974) Particle deposition rates on a water surface as a function of particle diameter and air velocity. Rech. Atmos8: 911-920.
- Zhang J, Shao Y, Huang N (2014) Measurements of dust deposition velocity in a wind-tunnel experiment. Atmos Chem Phys 14: 8869-8882.
Select your language of interest to view the total content in your interested language
Share This Article
Recommended Journals
Open Access Journals
Article Tools
Article Usage
- Total views: 4891
- [From(publication date): 0-2018 - Dec 04, 2025]
- Breakdown by view type
- HTML page views: 3968
- PDF downloads: 923

