Acoustic Survey along Heraklieon and East Canopus Ancient Greek Cities, Abu Quir Bay, Alexandria, Egypt
Received: 23-Jul-2015 / Accepted Date: 05-Aug-2015 / Published Date: 15-Aug-2015 DOI: 10.4172/2157-7617.1000289
Abstract
The recent development techniques of acoustic sound survey can provide clearly the inferences of seabed texture, grain size or habitat, seafloor bathymetry and sunken archaeology. Acoustic seabed classification and mapping are possible by using a wide range of acoustic imaging systems. The aim of this study is to get a recent seafloor mapping of the seabed characteristics applying side scan sonar sonography, single beam echo-sounding with QTC seabed classification data, remotely operated under water vehicle (ROV) imageries, and sediment analysis in the study area of the Abu-Quir bay, Alexandria, Egypt. Four types of backscattered patterns were recognized: Pattern of lighter tones corresponds to coarse and medium sediments, Darker tones pattern corresponds fine to very fine sand, tonal patches pattern confined to the transition zone from fine to coarse grained sediment. Moreover Pattern with isolated reflections belongs to archaeological remains and rocky outcrop areas. The seabed sediments of the study area were classified into four types; fine sand, medium sand, very fine sand and silty clay. The isolated reflections pattern has been interpreted as rocky outcrops and archaeological remains of the two ancient Greek cities, Heraklieon and East Canopus. The detection of scattered remains of archaeological structures assumed to be parts of historical blocks, buried archaeological feature. The large flat rocky area may be interpreted as the floors of the submerged cities. The borders of both submerged cities were delimited on the mosaic image where, Heraklieon may covered an area about 600 × 1000 m, while East Canopus may covered 550 × 800 m that situated 1.9 Km at the eastern side from the Abo Qir port.
Keywords: Abu-Quir bay; Acoustic imagery; Seabed classification; Single beam echo-sounder; Backscatter
11702Introduction
Abu Qir Bay is a semi-circular shallow basin lies between longitude 30°4`, 30°20` East and Latitude 31°16`, 31°28` North, at about 35 km Northeast of Alexandria city (Figure 1). Abu Qir Bay has arc-shape embayment on the eastern Egyptian northern coast. It has length about 46 km, and located between the two heads of Rosetta and Abu-Qir, about 13 km. At the eastern side located Rosetta branch of the River Nile flows into the sea while at the western side Abu-Qir Peninsula [1,2]. The study area covers about 86.816 km2 with an average depth of 6 m and maximum depth 14 m at the northwest and northeast parts (Figure 1).
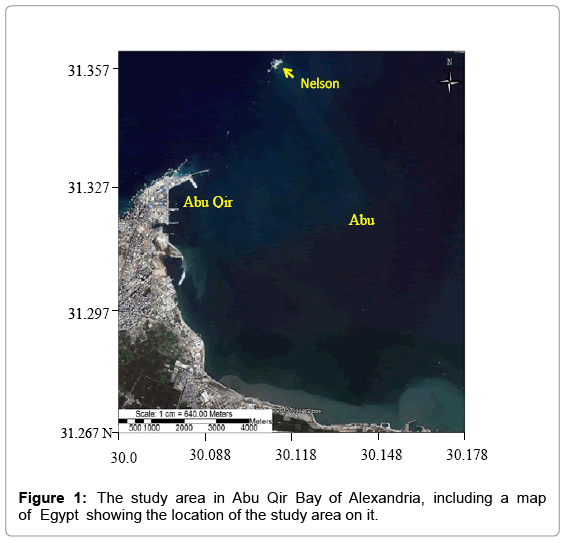
Figure 1: The study area in Abu Qir Bay of Alexandria, including a map of Egypt showing the location of the study area on it.
Abu Qir Bay is considered more or less utilized resource of tourism, agriculture and on the Mediterranean Sea in Egypt, which Abu-Qir bay has characterized by a great historical importance two ancient Greek cities, Heraklieon and East Canopus [3] (Figure 2). Historically, it was occupied low-lying coastal delta along the Canopic channel of the Nile. Specifically, they were lying at river mouths that flooded annually but related to urban activity and man-made structures were built directly on under consolidated sediment that lead to geohazards impact. Archaeologically, these two cities had sunk by natural disasters, flooding, earthquake, tsunami, and consequent subsidence. The delimited locations of the two sites are in Abu Quir Bay on the northwestern margin of Egypt’s Nile delta. Their immersed levels lie in water depths of 5-8 m were lowered a total of 8 m during the past 2500 yrs [3]. The survey area had been exposed to gradual subsidence that related to relative sea-level rise accounted for 4–5 m of submergence. Unfortunately Episodic was failure during floods, strong earthquakes and tsunami.by loading and sediment remobilization of the water-saturated substrate upon which the cities were settled. This likely caused an additional 3-4 m of subsidence [3-5].
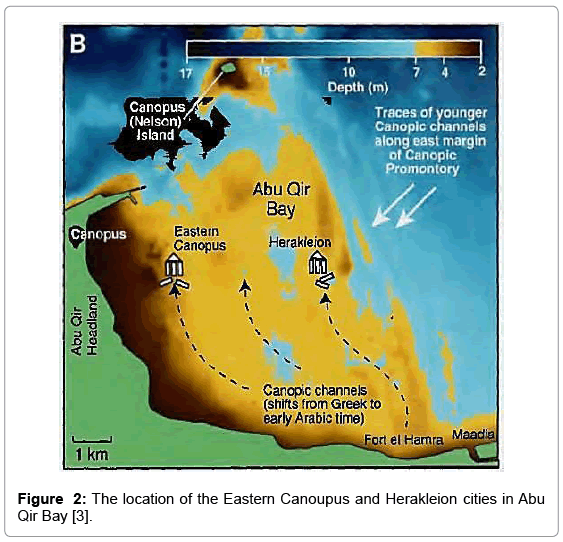
Figure 2: The location of the Eastern Canoupus and Herakleion cities in Abu Qir Bay [3].
The seafloor of Abu-Qir Bay is characterized mainly by a smooth bottom. It is characterized by many subsurface ridges in the extreme western side of the bay. The biggest ridge is extending over the sea surface to form small islands such as Nelson Island which is the largest one. These ridges cause rather effects on the water circulation inside the bay. The sediment distribution inside bay varies from muddy in the North Eastern side of the bay to sandy mud and muddy sand in the central area and sandy in the western area of the bay. The muddy nature of the bottom has come up from the annual discharge of the Rosetta Branch of the Nile River over the past times [6-8].
Hydrographically, the study area is characterized by distinct chemical, biological and physical attributes. The water temperature is varies from 27°C and 29°C and with mean surface salinity of about 34.28 ppt. The main direction of the wind is blowing from the north-west to north directions. The average wind speeds about 2 knots in summer and spring and about 4 knots in winter. Wave direction varies in the bay in intensity and direction related to the effect of the prevailing wind [9]. It has about 80% of its wave from northwest, 15% from northeast and 5% from west [10]. The annual average of wave height is 0.93 m with an average wave period 6.5 m while the annual maximum of wave height is 4.19 m with a maximum wave period 10.7 m. The Study area is characterized by a weak-tide coastal belt, where tide ranges from about 25 to 35 centimeters. The tide differences along the study area do not exceed than about 16 centimeters [11].
Underwater acoustics is applied as one of the most efficient and accurate application to understand the seabed characteristics, as well as locate and identify marine objects in an accurate way. There is a large variety of instruments now available, sound navigation and ranging (SONAR) is the generic name of the technology that is used to make images or locate objects underwater [12]. Sonar systems generally use highly directional beams of sound when searching for targets. There are three main categories of marine geophysical instrument using in this study the Quester Tangent Corporation (QTC) VIEW system, side scan sonar. In additional we used ground truth survey that includes collected sediment samples (sediment analysis), ROV and dives support this survey.
All these techniques helps us to understand the recent situation of the seabed characteristics, seabed texture, outcrops and bed forms, grain size or habitat analysis, seafloor bathymetry and sunk archaeology distribution on board of the moving survey along the study area by using the most advanced images of the developed acoustic instrument which are a new technologies beside the other traditional analysis. New bathymetric and seabed characteristics maps were produced. This gives fairly good contribution on the detection and impacts of two ancient Greek cities, Heraklieon and East Canopus on the seafloor. On the other hand, the sediment analysis depending on the collected sediment samples and ROV dives support this survey as ground truthing survey. The detection of the seabed facies depending on the strength of backscattered energy of side-scan sonar images and QTC seabed classification data.
Methodology
Field survey
The field survey was carried on July and August 2014, over 4 survey days aboard survey vessel. Forty four (44) survey lines (Figure 3), Oriented north/south and east/west, were run at speed range between 3-4 knots. The water depth is varied from 2 to 14 m, and the average water temperature was 25°C.
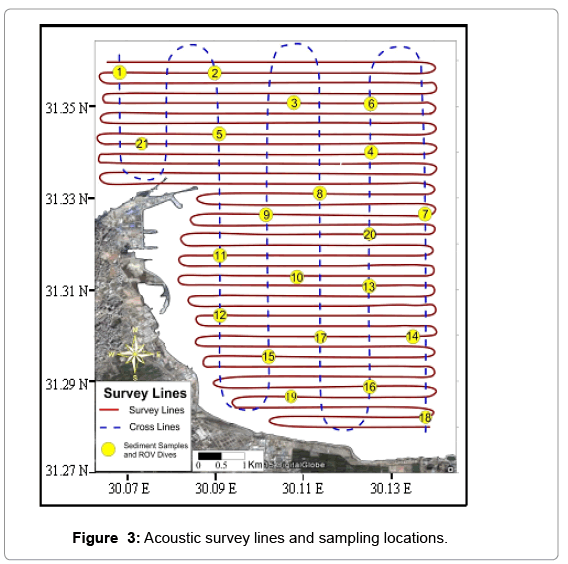
Figure 3: Acoustic survey lines and sampling locations.
Data Acquisition and Processing
Single beam echo-sounder with QTC system: As the purpose of these instruments is to make one-at-a-time measurements of the ocean depth at many locations, a single-beam Echo-sounder system consists of: a transducer which has two main parts transmitter and receiver, as well as control and display system. The single beam Echo-sounder sends an acoustic pulse from the transducer down into the water column towards the sea bottom. The arrival time, together with the correct sound speed, gives the water depth under the transducer. These received signals allow more parameters to be extracted further than the water depth. In other words the intensity and shape of the signal are partly determined by the composition of the seafloor and can therefore be used for classification [13]. The transducer selected for SBES may have a narrow beam when high directivity is required or a wide beam when directivity is not the main concern but the detection of minimum depths or obstacles on the seafloor is the priority.
Seabed classification is the organization of seabeds to be into discrete units based on characteristics of acoustic responses generated by an echo sounder. The echo signal shape is a measurement of the acoustic energy redirected to the echo-sounder transducer. This energy or backscatter is influenced by seabed surface and immediate subsurface. The signal shape is influenced by seabed characteristics -physical properties of the surface material or immediate seabed subsurface [14-17]. On the other hand the acoustic response represents an average volume of material, the size of which is a function of the transducer beam width and the frequency of the transmitted pulse. Two hypothetical seabeds and their associated echo traces describe the interaction between the transmitted beam and seabed. The acoustic signal of a smooth, simple, muddy seabed absorbs a high amount of energy and exhibits a low degree of backscatter. This results in an echo trace with a relatively narrow peak and no tail. Energy reflected from a rough, complicated, gravel seabed exhibits a high degree of backscatter. This results in an echo trace with a wide peak and a tail [15]. The bathymetric and acoustic surveys were run by using Suzuki 2035 Echo-sounder operating at 50 kHz, 0.3 ms pulse length, 500 w power, 24 degree beam width across track and 16 degree along track, 1.5 Hz ping rate recorded. Suzuki transducer model (TGM60-50B-12L) was side mounted and located 1m below the water’s surface.
Edge tech side-scan sonar: Side scan sonar is the tool to define high resolution seabed mapping studies where the primary aim is to locate bed forms on the seabed and to determine the sediment properties of the seafloor from their backscatter signature as is often the case of habitat mapping in coastal areas [18], and also can be used to image archaeological features that lie proud on the seafloor. At present, its main use is for the detection of shipwrecks, but it can equally be deployed for the characterization of submerged landscapes (such as sunken cities) where a relic land surface is believed to exist. The used Edge Tech 4200 Series side-scan sonar is a versatile sonar system that can be configured for almost any survey application from shallow to deep water operations. The 4200 utilizes Full Spectrum® CHIRP technology to provide crisp, high resolution imagery at ranges up to 50% greater than non-CHIRP systems; thus allowing to cover larger areas. The transducer unit emits fan shaped pulses in two downward directions symmetric about the vertical. The sound directionally and intensity is expressed by the beam shape (directivity pattern), which is a function of the shape and dimension of the transceiver arrays, as well as of the operating frequency. The angular dimensions of these beams are designed to be narrow along-track, to allow a high resolution and wide across-track to cover as much seabed range as possible [19].
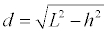
An important aspect of such technique of the side-scan sonar operation is to control the Tow-fish in a position behind the vessel (layback distance) (Figure 4), to predict accurately the horizontal position of the acquired data with reference to the GPS antenna (geopositioning) [20]. For single-unit systems in this case the only variable known is the length of cable paid out (L), the control over layback is difficult. Where there is a control on the sonar depth (h) such as a pressure sensor recording data, an estimate of layback (d) can be obtained using the following equation:
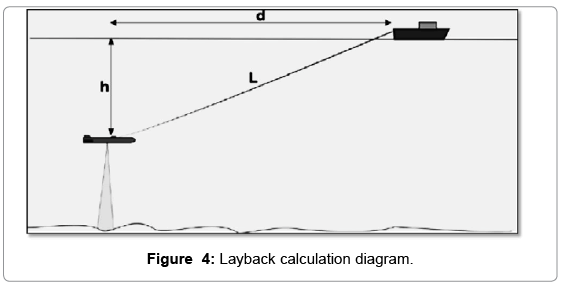
Figure 4: Layback calculation diagram.
This does not take into account the catenary effect produced by hydrodynamic forces on the cable which lessens the layback. However, this only becomes a real problem for long cable deployments [21].
Different seabed textures will have different reflective properties, or backscatter of the signal, influencing whether items will be recorded by the side-scan sonar. The lighter tones represent areas of high backscatter which represent areas of the seafloor characterized by stronger acoustic returns and relatively coarser sediments. While the darker tones pattern represents areas which produce weak backscatter, and corresponds to the areas were composed of fine to very fine sand.
Video ray ROV video camera: The ROV video camera is a submersible, remotely operated vehicle designed to take advantage of its portability and size set up and vehicle control are simple and intuitive, enabling video camera to be easily carried and deployed. The ROV is equipped with a forward facing color camera, two lights, two horizontal thrusters and one vertical thruster. A rear black and white camera and rear lights are also included.
In order to accurately geo reference the video, a house software developed in Visual Basic is used by the author to read National Marine Electronics Association (NMEA) strings from the GPS and the echo sounder and estimate layback as a function of the depth and calculate the position of the camera using this estimate, vessel position and an implementation of Vincenty’s algorithm [22].
Ground truthing done by using ROV Video camera and sediment grab sampler (21 samples and ROV dives) were performed at several stations (Figure 3 and Table 1) within the study area. The sampling stations were selected after the acquisition data were reviewed.
| Station no | lat | long | Mean Size |
|---|---|---|---|
| 1 | 31.35756 | 30.06845 | Medium Sand |
| 2 | 31.35765 | 30.09001 | Fine Sand |
| 3 | 31.35103 | 30.10803 | Fine Sand |
| 4 | 31.34053 | 30.1257 | Very fine sand |
| 5 | 31.34388 | 30.09091 | Medium Sand |
| 6 | 31.35079 | 30.1256 | Fine Sand |
| 7 | 31.32649 | 30.13801 | Silty Clay |
| 8 | 31.33093 | 30.1141 | Medium Sand |
| 9 | 31.3264 | 30.10178 | Fine Sand |
| 10 | 31.31272 | 30.10894 | Fine Sand |
| 11 | 31.31734 | 30.09137 | Fine Sand |
| 12 | 31.30466 | 30.09119 | Fine Sand |
| 13 | 31.31109 | 30.12524 | Very fine sand |
| 14 | 31.30013 | 30.13493 | Very fine sand |
| 15 | 31.2956 | 30.10242 | Fine Sand |
| 16 | 31.28935 | 30.12533 | Medium Sand |
| 17 | 31.29968 | 30.1141 | Fine Sand |
| 18 | 31.2822 | 30.13819 | Silty Clay |
| 19 | 31.28673 | 30.10731 | Very fine sand |
| 20 | 31.32214 | 30.12551 | Medium Sand |
| 21 | 31.34216 | 30.07334 | Medium Sand |
Table 1: Sediment samples with sediment types and ROV dives locations with.
Laboratory analysis: For grain size analysis, about 15–25 g of dried samples was taken for mechanical analysis. The samples were subjected to the combined technique of dry sieving and pipette analysis according to the method described by [23]. Accordingly, the electrical shaker sieves (which lasted for 15 min), were arranged from top to bottom in one phi order as follows:-2,-1, 0, 1,2,3,4 Ø, which corresponds to 4, 2, 1, 0.5, 0.25, 0.125 and 0.063mm respectively. The graphic measures were employed for the results of the grain size analysis using the phi notation, where Ø=-log x (x=given value in mm). Cumulative percentages were plotted against grain size interval (Ø) on a probability paper. The Ø 16, 50 and Ø 84 values were directly interpolated from the cumulative curves. The mean size has been evaluated according to Folk [23].
Results
Bathymetry interpretations
The bathymetry map (Figures 5 and 6) indicates the depths of the study area varied between 2 to 14 m. The study area has average depth ranging from 5 to 6 m that located mainly in the central part. The general slope of the seafloor along the study area inside Abu Quir bay increases towards northeast and northwest. The shoreline area has a relatively gentle slope in the south and southwestern parts of the study area starting from 1m depth down to 6m. A very steep slope observed in the northeastern and northwestern parts of the study area, as water depths has abrupt variation from 7 to 13 m on both sides.
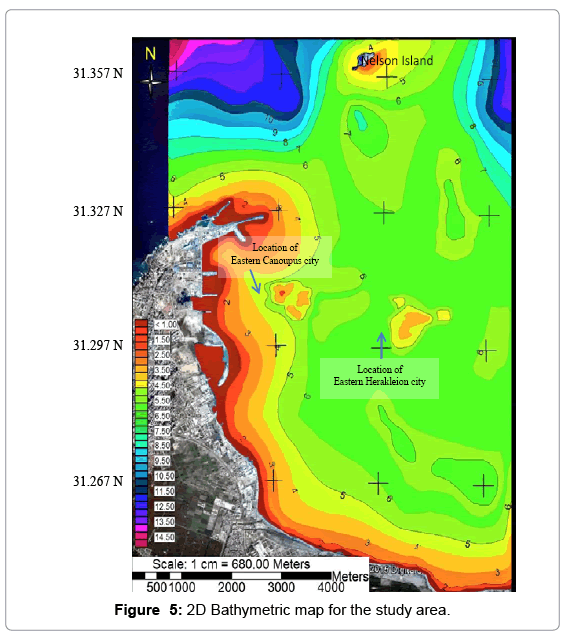
Figure 5: 2D Bathymetric map for the study area.
Figure 6: 3D Bathymetric map for the study area.
In the northern part, the isobaths contours decreased again to 2 m around Nelson Island, which is considered as an outcrop of the extended carbonate ridge. The central part (main part) of the study area characterized by very small scale depth variation (5.5 m to 6.5 m), this area nearly be smooth surface.
Seabed classification
We identified four acoustic seabed classes as a result of acoustic QTC seabed classification survey in comparison with grain size analysis (Figures 7 and 8). These classes related to four types of sediments obtained from 21 grab samples were taken from the study area (Table 1). The area-percentage of each class in the study area varies in dependence of the specific acoustic approach (Figure 9). The first acoustic Class A (Pale yellow color on the map) corresponds to fine sand, that located mainly in samples taken from the central and northern parts, which covers 44.6 km2 (51.21%) of the survey area. The second Class B (Yellow color) corresponds to medium sand intercalated by rocky fragments. This class is located mainly in the northern and northwestern parts, and some areas in the central parts of the survey area which covers 15.8 km2 (18.20%). The third acoustic Class C (yellowish white color) corresponds to very fine sand. It is mainly located at the eastern and southern part of the study with cluster areas in northwestern and central parts of the survey area which covers 23.4 km2 (27.01%). The last acoustic Class D (green color) corresponds to silty clay, located in some areas along the eastern part of the survey area which covers 2.922 km2 (3.38%).
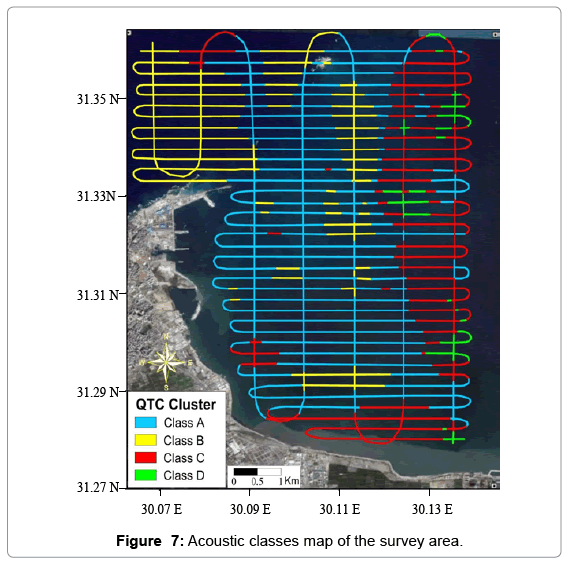
Figure 7: Acoustic classes map of the survey area.
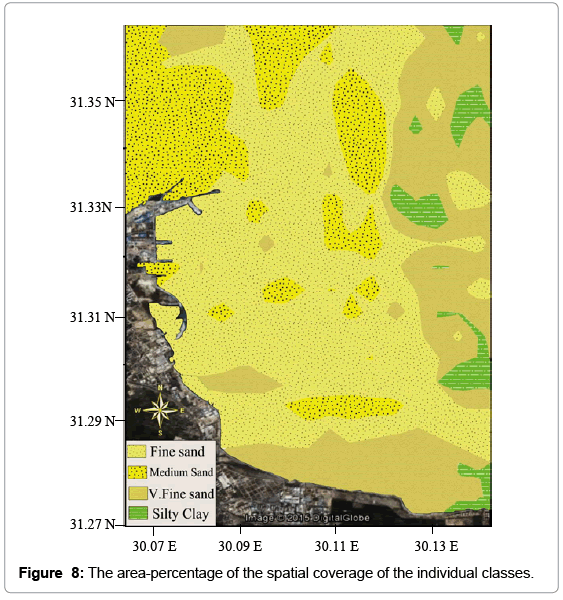
Figure 8: The area-percentage of the spatial coverage of the individual classes.
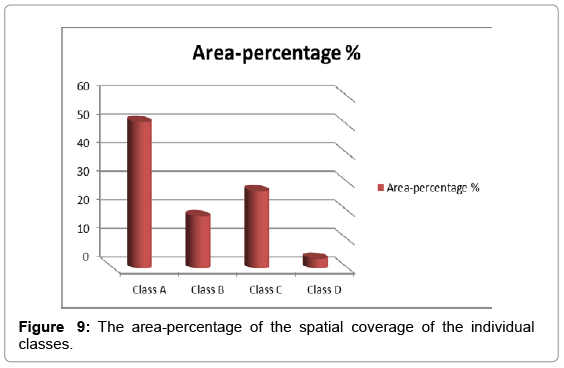
Figure 9: The area-percentage of the spatial coverage of the individual classes.
Side-scan sonar interpretation
Four different acoustic patterns were recognized from the output mosaic image (Figure 10). The four main categories are represented as darker tones, lighter tones, tonal patches of high and low reflectivity patches, and pattern with isolated reflections. The darker tone is indicating areas of weak backscatter, such as mud and very fine sand. The lighter tones depicting strong acoustic reflectivity, shells, gravel and coarse-grained sand (ripple marks) which send back much more of the incident sound. The tonal patch of lighter and darker tones that impact of shells and accumulation of bivalves and has interval bands of fine sand inside are mainly has mud sediment. The last pattern is the isolated reflections which could be interpreted as archaeological remains of the two ancient Greek cities, Heraklieon and East Canopus [3]. The scattered remains of archaeological structures mainly are parts of historical blocks as buried archaeological feature. The large flat rocky area interpreted as the ruins of the submerged cities (Figure 11). The estimated borders of both submerged cities were delimited on the mosaic image (Figure 12). Heraklieon city may be covered an area about 600 × 1000 m while East Canopus city may be covered about 550 × 800 m along the seafloor in the area situated 1.9 km away from the Abo Qir port.
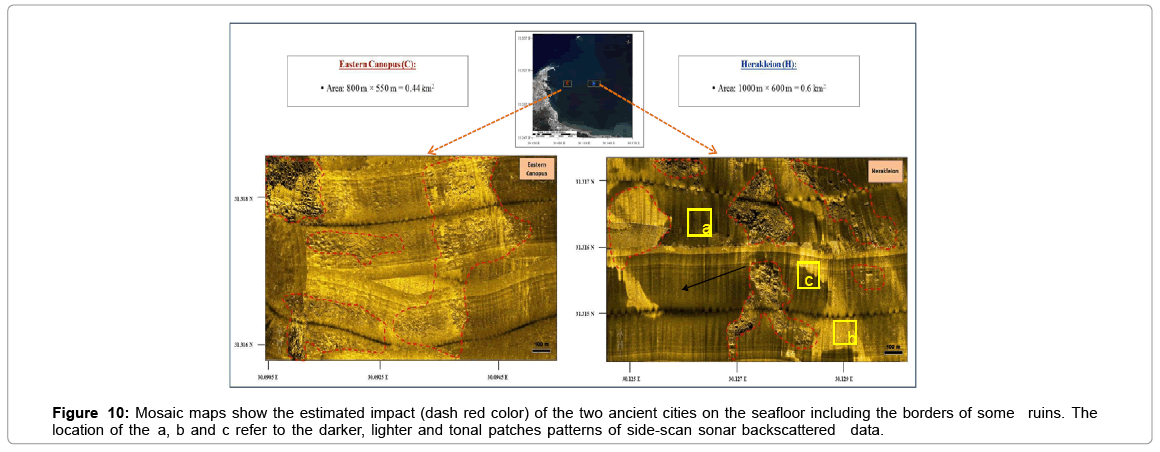
Figure 10: Mosaic maps show the estimated impact (dash red color) of the two ancient cities on the seafloor including the borders of some ruins. The location of the a, b and c refer to the darker, lighter and tonal patches patterns of side-scan sonar backscattered data.
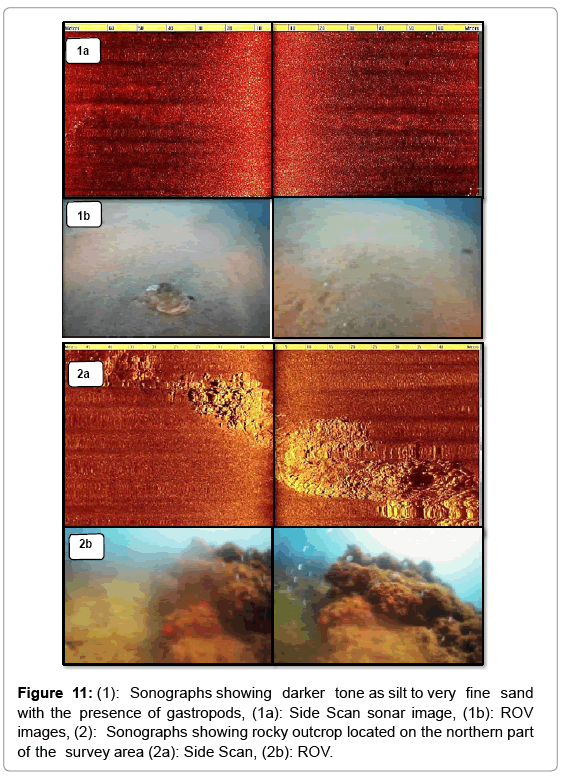
Figure 11: (1): Sonographs showing darker tone as silt to very fine sand with the presence of gastropods, (1a): Side Scan sonar image, (1b): ROV images, (2): Sonographs showing rocky outcrop located on the northern part of the survey area (2a): Side Scan, (2b): ROV.
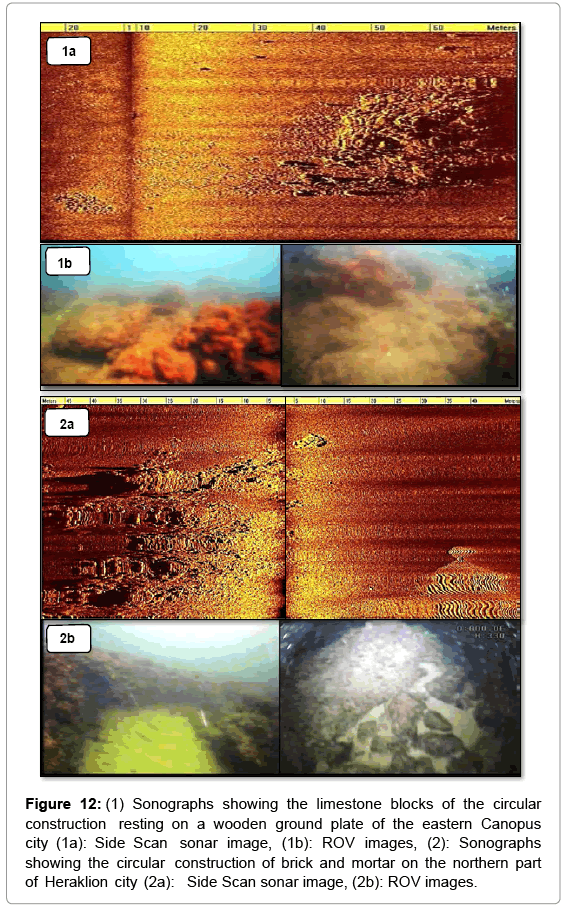
Figure 12: (1) Sonographs showing the limestone blocks of the circular construction resting on a wooden ground plate of the eastern Canopus city (1a): Side Scan sonar image, (1b): ROV images, (2): Sonographs showing the circular construction of brick and mortar on the northern part of Heraklion city (2a): Side Scan sonar image, (2b): ROV images.
The darker tones pattern represents areas which produce weak backscatter. This pattern is generally featureless and corresponding to the areas were composed of silty clay to very fine sand and wide spreads through the whole study area (Figure 11).
The lighter tones pattern represents areas of high backscatter which represents areas of the seafloor characterized by stronger acoustic returns and relatively coarser sediments. This pattern corresponds to coarse and medium sediments and appears in the form of sand ripples in several parts of the study area (Figure 13).
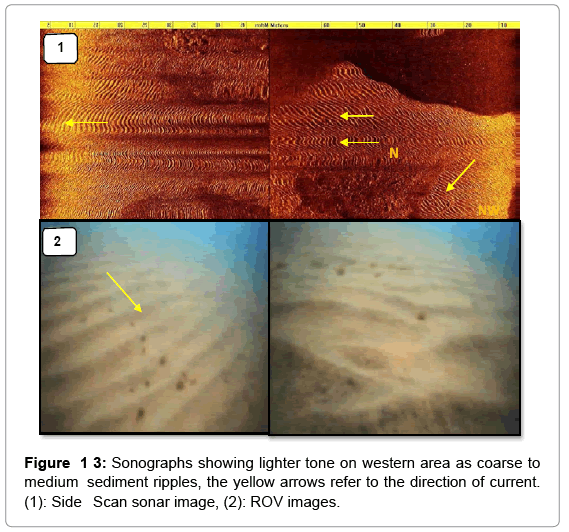
Figure 13: Sonographs showing lighter tone on western area as coarse to medium sediment ripples, the yellow arrows refer to the direction of current. (1): Side Scan sonar image, (2): ROV images.
High and low reflectivity patches were recognized in survey area, and represented by irregular shaped patches (Figure 14) and longitudinal patches that were found in the transition zone from fine to coarse grained sediment.
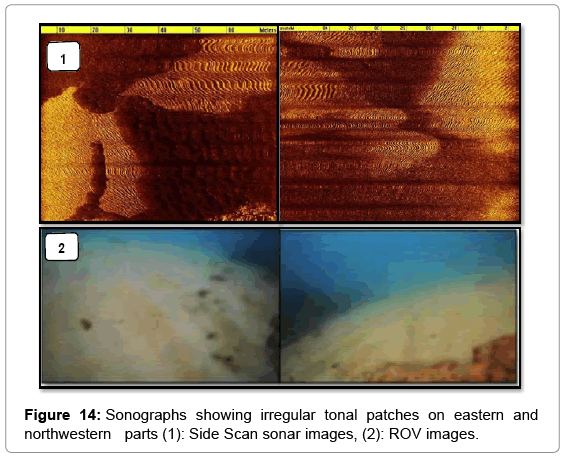
Figure 14: Sonographs showing irregular tonal patches on eastern and northwestern parts (1): Side Scan sonar images, (2): ROV images.
Along the study area we observed the sandy ripples (Figures 13 and 14) which occur on non-cohesive surfaces as undulations, oriented transverse related to the main direction of water flow. Sand ripples of various wavelengths are also identifiable, although this is dependent on their wavelength and amplitude as well as the resolution of the data and the sea condition. According to the orientation of these ripple marks we can estimate that the main direction of current in the study area that is varied in between NW-SE to N-S directions.
Discussions and Conclusions
Single beam Echo-sounder (dual beam) and the echo sounding technique SONAR is a good useful methodology for generating a high significant accuracy bathymetry map. The bathymetric map of the study area showed depths varied between 2 to 14 m, the average depth was ranging from 5.5 to 6.5 m in the central region of the study area. The study area has shoreline area is very gentle slope starting from the 1m shoreline out to 6m. A very steep slope is founded in the northeastern and northwestern parts of the survey area. The small scale depth variation within the major central part of the study area may be related to the large area of the submerged ancient Greek cities or related to subbotom structures.
The acoustic processing methodology technique in this study of Side-scan sonar and QTC system are success for detection seabed characteristics. While, the methodology of Side-scan sonar has more efficiency than the QTC seabed classification especially the detect intervals bivalves inside the sediments and detection the variation between the outcrops rocks and archeology. All of them need support of ground truth survey by ROV and collected sediment.
Side-scan sonar has proved to be a useful tool for imaging the seafloor because of its good object detection and seafloor character discrimination when deployed with the transducers mounted on a Towfish close to the seafloor. The sound pulses are usually on frequencies between 100 and 500 kHz. A higher frequency gives better resolution but less range. It measures the strength of how "loud" the return echo is, and paints a picture. Hard areas of the sea floor like rocks reflect more sound and have a stronger or louder return signal than softer areas like sand. Areas with loud echoes are darker than areas with quiet echoes.
By using the package of side-scan sonar, underwater video camera and DGPS linked together through Hypack 2014 acquisition and processing software has given an accurate map of the present situation of the seafloor of the study area. The processing step is the most important factor to get high resolution images of the seafloor and target detection. Layback calculation, acoustic survey measurements and the acquisition log are the three main parameters that have a great effect on the strength of backscattered energy.
The most accurate interpretation of the seafloor mapping not only done by using side scan sonar data but also by correlating the analysis of other techniques such as (sediment samples, ROV images, charts of topography, bathymetry, oceanography and satellite images). All of these data can give a good explanation about the recent situation and interpretation of the seafloor mapping.
The interpretation of the sidescan sonographs was very important factor for identifying the different textures of seabed and the submerged archaeological Remains. Where, four types of backscattered patterns (Lighter tones, darker tones, isolated reflections and tonal patches) were founded on the survey area of the Abu Quir bay depending on their degree of reflectivity. Lighter tones pattern corresponds to coarse and medium sediments, Darker tones pattern corresponds to the areas were composed of fine to very fine sand, Tonal patches pattern of high and low reflectivity patches were found in the transition zone from fine to coarse grained sediment. While the archaeological remains and rocky outcrop areas which represent the isolated reflection pattern. These archaeological remains were related to the ruins of the two ancient Greek cities Heraklieon and East Canopus. These remains located on the southeastern and southwestern parts of the survey area.
The isolated reflections pattern has been interpreted as rocky outcrops and archaeological remains of the two ancient Greek cities, Heraklieon and East Canopus (Figure 11). The scattered remains of archaeological structures assumed to be parts of historical blocks, buried archaeological feature. The large flat rocky area may interpret as the floors of the submerged cities (Figure 12). The borders of both submerged cities were delimited on the mosaic image (Figure 10) where, Heraklieon may covered an area about 600 × 1000 m while East Canopus may covered about 550 × 800 m In the area situated 1.9 km from the Abo Qir port. We hope in the next survey we used the 3 D shallow seismic survey to detect more clearly the historical sunken cities in this area.
Mechanical sampling is the most important way (as ground truth) to get information about the seabed sediments through grain size analyses. The seabed sediments of the study area were classified into four types; fine sand, medium sand, very fine sand and silty clay.
The study area characterized by sand ripples of various wave lengths. According to the orientation of this ripples we can estimate that the main direction of current in the study area that is varied in between NW-SE to N-S directions.
Acknowledgement
Special thanks to Morad B. Awad, professor of Marine Geophysics, NIOF, for his revision the manuscript and his valued comments that strengthened this paper. In additional, we would like to thank the Marine Geophysics team members especially A. Fekry and M. Nassar for their assistance in field survey and data analysis of this study.
References
- Hamouda AZ, Abdel-Salam KM (2009) Estuarine Habitat assessment for construction of a submarine transmission line. SurvGeophys 31: 449-463.
- Hamouda AZ, Abdel-Salam KM ( 2010) Characteristics of marine habitats in the Abu-Qir Bay, Egyptian Coast, by using Acoustic seabed classification. PiE 2010 Particles in Europe Villefranche-sur-Mer, France.
- Goddio F (2006) The topography and Excavation of Heracleion- Thonis and east canopus. Oxford. Oxford Centre of maritime Archaeology.
- Stanley JD, Goddio F, Jorstad T, Schnepp G (2004) Submergence of Ancient Greek Cities Off Egypt’s Nile Delta-A Cautionary Tale, GSA Today 14: 4-10.
- Hamouda AZ, El-Gharabawy, Awad M, Shata M, Badawi A (2014) Sea bed characteristics in front of Damietta Promontory Nile Delta- Egypt. Egypt J Aquat Res 40: 373-383.
- Stanley JD, Warne AG (1998) Nile Delta in its destruction phase. J Coastal Res 14: 794-825.
- Maestro A, Barnolas A, Somoza L, Lowrie A, Lawton T (2002) Geometry and structure associated to gas-charged sediments and recent growth faults in the Ebro Delta (Spain). Mar Geol 186: 351-368.
- Stanley JD, Goddio F, Schnepp G (2001) Nile flooding sank two ancient cities. Nature 412: 293-294.
- Abdallah A, Sharaf El-Din S, Shereet S (2006) Analysis of wave observationand wave transformations in Abu-Qir bay, Egypt. Egyptian J Aquat res 32: 22-33.
- Frihy O, Hassan M, Deabes E, Badr A (2008) Seasonal wave changes and the morphodynamic response of the beach-inner shelf of Abu Qir Bay, Mediterranean coast, Egypt. Mar Geol 247: 145-158.
- White K, El Asmar H (1999) Monitoring changing position of coastlinesusing Thematic Mapper imagery, an example from the Nile Delta. Geomorphology 29: 93-105.
- Lee GH, Kim HJ, Kim DC, Yi BY, Nam SM, et al. (2009) The acoustic diversity of the seabed based on the similarity index computed from Chirp seismic data. ICES J Mar Sci 66: 227-236.
- Von Szalay PG, McConnaughey RA (2002) The effect of slope and vessel speedon the performance of a single beam acoustic seabed classification system. Fish Res 54: 181-194.
- Bornhold BD, Collins B, Yamanaka L (1999) Comparison of seabed characterizationusingsidescan sonar and acoustic classification techniques. Proceedings of the Canadian Coastal Conference.
- Collins WT, Lacroix P (1997) Operational philosophy of acoustic waveform dataprocessing for seabed classification. In: Proceedings of Coastal Open Space Utilization (COSU 97) International Conference, Singapore 1: 225-234.
- Galloway JL, Collins WT (1998) Dual frequency acoustic classification ofseafloor habitat using the QTC View. Proceedings of IEEE Oceans, Nice, France.
- Preston JM, Rosenberger A, Collins WT (2000) Bottom classification in very shallow water by high speed data acquisition. Proceedings of Oceans 2000, Newport.
- Flemming BW (1976) Side-scan Sonar: A practical guide. IntHydrogr Rev 53: 65-92.
- Blondel P (2009) TheHandBook of Side Scan Sonar. Praxis Publishing Ldt, Chichester, UK, p. 344.
- Cobra DT, Oppenheium AV, Jaffe JS (1992) Geometric Distortions in side-scan sonar images: A procedure for their Estimation and correction. IEEE J Ocean Eng 17.
- LeBas TP, Mason DC, Millard NC (1995) TOBI image processing: The state of the art. IEEE J Ocean Eng 20: 85-93.
- Vincenty T (1975) Direct and inverse solutions of geodesics on the ellipsoid with application of nested equations. Survey Rev 23: 88-93.
- Folk RL (1974)Petrology of Sedimentary Rocks, Hemphill Publishing Company, Austin, TX.
Citation: Hamouda A, EL-Gendy N, El-Gharabawy S, Salah M (2015) Acoustic Survey along Heraklieon and East Canopus Ancient Greek Cities, Abu Quir Bay, Alexandria, Egypt. J Earth Sci Clim Change 6: 289. DOI: 10.4172/2157-7617.1000289
Copyright: © 2015 Hamouda A, et al. This is an open-access article distributed under the terms of the Creative Commons Attribution License, which permits unrestricted use, distribution, and reproduction in any medium, provided the original author and source are credited.
Select your language of interest to view the total content in your interested language
Share This Article
Recommended Journals
Open Access Journals
Article Tools
Article Usage
- Total views: 16750
- [From(publication date): 8-2015 - Aug 30, 2025]
- Breakdown by view type
- HTML page views: 12091
- PDF downloads: 4659