Research Article Open Access
Analysis of Historic Buildings in Terms of their Microclimatic and Thermal Comfort Performances "Example of Konya Slender Minaret Madrasah"
Enes Yasa1*, Guven Fidan2 and Mustafa Tosun31NEU Faculty of Architecture, Deparment of Architecture, Meram, Konya 42090, Turkey
2Barbaros Bulvari, Nisbetiye Mahallesi, Uygur Apt, Istanbul, Turkey
3Selcuk University, Department of Architecture, Turkey
- *Corresponding Asuthor:
- Enes Yasa
NEU Faculty of Architecture
Deparment of Architecture
Meram, Konya 42090, Turkey
Tel: 90-532-505-1705
E-mail: enesyasa@yahoo.com
Received April 05, 2014; Accepted May 21, 2014; Published May 28, 2014
Citation: Yasa E, Fidan G, Tosun M (2014) Analysis of Historic Buildings in Terms of their Microclimatic and Thermal Comfort Performances “Example of Konya Slender Minaret Madrasah”. J Archit Eng Tech 3:126. doi: 10.4172/2168-9717.1000126
Copyright: © 2014 Yasa E, et al. This is an open-access article distributed under the terms of the Creative Commons Attribution License, which permits unrestricted use, distribution, and reproduction in any medium, provided the original author and source are credited.
Visit for more related articles at Journal of Architectural Engineering Technology
Abstract
Building envelope plays an important role for a building by protecting and providing the comfort required by the users of the inner building. Fundamental factors to be considered in achieving comfort ability are the indoor air temperature, average surface temperatures, air variation ratio, indoor relative humidity, illumination level and brightness. For historic buildings and those of traditional construction an appropriate balance needs to be achieved between building conservation and measures to improve energy efficiency if lasting damage is to be avoided both to the building’s character and significance and its fabric.
In this study, one of the best historic historical building and its envelope, the Konya Slender Minaret Madrasah, was taken into consideration and its microclimatic evaluation was made. The results show that the 13th Century Slender Minaret structure complies with the thermal comfort ability criteria when the energy performance criteria are compared with the comfort ability. Under this context, the structure has been found to be a useful work-piece particularly after conducting the wind flow analysis across the building and the evaluation of the wind and heat flow together with the total surface heat flow and solar heat flow where it became clear that the building provided some insights on how other subsequent structures during the Seljuk era should be constructed in terms of comfort and energy conservation.
Keywords
Thermal comfort; Air temperature; Air velocity; Surface temperature; CFD, Thermal simulation
Introduction
The design of buildings is a complex process in which the architect makes decisions concerning the different systems related to the building (environmental, cost analysis, structural, activity and aesthetic). The choices are narrowed from preliminary designs to final scheme through a succession of steps, which involve analysis, synthesis and appraisal. The different building systems are inter-related: each one set constraints on one or more of the others. Furthermore, each system may consist of several subsystems; the environmental design for instance includes the thermal, visual and aural subsystems. The work described here is concerned with the thermal subsystem in the environmental design and is meant to answer specifically the architect’s question “What are the thermal design specifications such that there is minimum deviation from desired comfort conditions in a given situation?”
Computer models assisting different aspects of architectural design have been developed and used for several decades. A review of contributions of computing to architectural design is given by Gero [1]. These computer models can be divided into two main categories; those based on analytical methods for performance analysis and those using computer graphics to represent the layout and appearance of the building. This paper presents building energy performance of the historical building envelopes combining analytical and graphical methods to optimize the thermal performance of a building.
Energy requirements are increasing in line with population growth and globalization effects. So, efforts are being made world-wide to conserve energy resources and optimize the utilization of energy. For energy savings reasons, the indoor quality, thermal performance of buildings and hygienic requirements has become a focus of designers and investors. However, this state was not sustainable.
Because of rapid increase of heating expenses, it was necessary to solve the problem of thermal insulation of newly developed as well as of existing buildings. The contemporary progress in material base of building materials is characterized by rapid development of new thermal insulation materials and design of new structural and technological solutions. The progress is aimed at lower thermal losses of buildings, and answers the strict requirements of thermal technical standards [2]. There is a great potential for energy savings through the implementation of energy efficiency in the residential and tertiary sector [3].
Performance of buildings in terms of energy depends on a number of factors such as the building’s architecture, its construction, thermal properties of the building envelope, heating, cooling and air conditioning features, indoor and outdoor climatic conditions and user’s behaviors. In order to specify real performance of a building, these factors should be considered when calculations are made. Nowadays, computer based building energy simulation programs are used in calculations. These programs which are becoming popular progressively, offer detailed information about buildings thermal behaviors and enables possibility of taking actions on improving the design in order to achieve optimum solutions [4].
These programs which are used for energy efficiencies and optimization of buildings, have recently, been used for determination of thermal performances of historical buildings as well. Within the historical sites, when we look at features of the historical historic buildings, we find that there are important clues showing establishment of cities with climatic compatibility in those buildings. Because of climatically properties, redesigning of city areas (streets, city squares, open spaces and gardens), the materials used, types of structures and construction materials indicate vivid differences among them. By looking at the historical remaining, we see, for instance, that in the hot and cold climatic regions, the city spaces are of the closed nature and show densely manners of organization whereas the places with mild weather are less densely structured with huge spacing’s in between the buildings [5].
Throughout history, it is known that societies have long been developing structural designs that target to cope with climate and people’s comfort. The most known examples are the construction of steep roofs in areas with heavy rainfalls, extensive water usage and the tendency of using light colors on buildings over the areas with high temperatures, the use of wide windows and gaps on areas with poor illumination, the use of wind curtain-materials on cold weather areas and formation of gaps to allow air flows on places in need of air flow (Figure 1).

Figure 1: Konya Slender Minaret Madrasah and its interior view.
For many years improving the thermal performance of the building envelope meant predominantly keeping the thermal transmittance values of the opaque and transparent elements as low as possible. Socalled low-energy buildings and passive houses are generally based on high insulation levels. However, during the last years, the concept became more and more important that it is impossible to design energy-efficient buildings using only a U-value based approach, such as lowering the heat transfer of exterior walls, roofs, and windows or increasing the thickness of thermal insulation [6]. This approach is still reflected in some national regulations about energy saving in buildings. Actually thermal inertia is one of the most important parameters for improving thermal comfort conditions as well as for reducing heating and cooling energy demands of buildings [7,8]. Several authors evaluated the influence of the walls thermal properties on the building energy performance, by comparing different construction systems [9-11]. However, in the mentioned studies, the effects of inertia cannot be separated from those of thermal transmittance, since both parameters are allowed to vary.
There are two kinds of parameters affecting the thermal performance of a building. The first type is the unsteady climatic excitation that the building is subject to, such as solar radiation, air temperature, relative humidity and wind direction. The second type is the design variables under the control of the architect. The design parameters, which are related to the building and which determine its thermal response to the climatic conditions include:
• General layout and sitting
• The thermo physical properties of the building materials.
• Location of windows and their sizes.
• Shading of windows and envelope.
• Insulation.
• Surface treatment of the enclosing envelope.
• Mass and surface area of partitions.
Predicting the thermal performance of buildings involves the handling of a large number of inter-related parameters. The methods used usually rely on solving sets of equations derived from basic heat transfer theory [7]. Many simulation models to predict the thermal behavior of buildings have been developed in recent years; some of them were reviewed by Littler [7]. One of the disadvantages of these models is that they are intended for the analysis of a predetermined design solution, not for synthesis of an optimum solution.
Sustainability and Historic Buildings
Sustainability is about overlapping environmental, social and economic requirements and the need to bring them all into harmony. All of them are relevant to older buildings, but for the purposes of the Building Regulations the greatest emphasis must lie on the environmental aspect, and specifically the use of fossil energy. This is closely allied to the generation of carbon dioxide both from the creation of buildings and from their daily use.
When they were first built and inhabited, all pre-industrial buildings were, by definition, sustainable and made zero use of fossil carbon in both their construction and use. The primary energy sources available for the conversion and transport of building materials were human and animal power, and the biomass of available locally grown timber. Building, heating and cooking were almost entirely fuelled by sustainably sourced biomass. However, where water and wind power were available they could be used, for instance, for the conversion of timber or the transport of materials by water.
There is no inherent conflict between the retention of older buildings and the principles of sustainability. The retention of older buildings, either in their entirety, or simply be re-using components in-situ and allowing for their thermal upgrading in benign and sympathetic ways, can provide excellent finished results which are fully in accordance with the principles of building conservation and sustainability. In many cases, the process of careful adaptation and reuse can produce new buildings and spaces of the highest architectural quality.
The Energy Performance of Buildings Directive and Building Energy Performance in Turkey
The energy performance of buildings is a hot topic around the world among researchers, policy makers and appliers nowadays and it is becoming a priority for many countries. Various actions are taken to reduce building energy use and new strategies are continuously developed. Countries around the world are starting to implement measures to reduce greenhouse gas emissions to address global warming.
For example, In European Union the energy performance of buildings is a key to achieve the EU Climate & Energy objectives, namely the reduction of a 20% of the Greenhouse gases emissions by 2020 and a 20% energy savings by 2020. The Directive on energy performance of buildings is the main legislative instrument at EU level to achieve energy performance in buildings [12,13]. The Member States now must apply minimum requirements as regards the energy performance of new and existing building and ensure the certification of their energy performance [14,15].
Changing international policies on sustainability is closely followed by Turkey. National Building Energy Performance Regulation published in 2008 has become a driving force towards green construction and started a transformation in the construction industry. National Building Energy Performance Calculation Methodology of Turkey (BEP- TR) was prepared in accordance with EU Building Energy Performance Directive and legally obliges building energy certification [16]. To reduce the environmental impact of buildings, new buildings now need to use less energy than national standard building of same building type while still providing a healthy and comfortable indoor environment for their users [17].
To comply with the Directive member states must implement the following requirements (although under the principle of subsidiary individual nations may decide for themselves the means by which they achieve this):
• The application of minimum requirements on the energy performance of new buildings
• The application of minimum requirements on the energy performance of large existing buildings that are subject to major renovation
• Energy performance certification of buildings
• Regular inspection of boilers and of air-conditioning systems in buildings and in addition an assessment of heating installations in which the boilers are more than 15 years old
• Requirements for experts and inspectors in the certification of buildings, the drafting of accompanying recommendations and the inspection of boilers and air-conditioning systems [6].
Thermal Design as an Optimization Problem
One way of dealing with the thermal design problem is to test a number of design alternatives by computing the thermal performance of each one. These design alternatives are obtained by varying one variable at a time and keeping the others fixed at reasonable practical values in order to determine the effect of that particular variable on the thermal performance of the building. Finally, design guidelines can be generated through an analysis of the results. This approach is very laborious and can only provide rather sparse information to the designer, who still has to decide on the best alternative for that particular situation. There is also the possibility that there may be a better design that has been missed out of those analyzed.
Another way of approaching this problem is to synthesize the thermal design by combining an optimization method and a thermal analysis technique for buildings that would determine the optimum solution for thermal design by systematically searching the whole of the solution space. This optimum solution will be the best combination of the design variables to achieve the most effective thermal performance of the building [12].
Not all variables affect the thermal performance of the building in the same way; some have more influence over the building thermal response than others. Changing the window area, for example, would have more impact on the building performance than increasing or decreasing the thickness of a wall. Some of the variables are independent (e.g., orientation) while others are interrelated (e.g., floor to ceiling height and the volume of a room) [13].
Characteristics of the Building Components andMaterial used in the Madrasah Buildings in CFD Analysis, Entry of Boundary Conditions
CFD simulation: benefits and practical applications in this study
CFD Simulation is also known as CFD modelling and it is engineering based scientific process module which runs on Computational Fluid Dynamics theory and is applied for resolving different fluid flow related problems like flow velocity, density, temperature, and chemical concentrations for any area where flow is present. It’s a numerical method for calculation for nonlinear differential equations describing/relating to fluid flow. CFD model offers precise and detailed information about heating, ventilation, and air conditioning design parameters. CFD foresee performance before adapting or execution in systems.
The heat flux coefficient, which is defined as the product of the density, thermal conductivity and specific heat capacity quantifies the ability of the material to absorb heat. It has been found to reflect the influence on thermal comfort of different surfaces and is therefore used as the basic thermo physical property defining the materials. The heat flux coefficients for the different layers of each element of the building (walls, roof, floor) are considered as design variables. The thicknesses of the different layers of each building element are also considered as design variables [7]. The thermal penetration coefficient, which is defined as the product of the density, thermal conductivity and specific heat capacity quantifies the ability of the material to absorb heat. It has been found to reflect the influence on thermal comfort of different surfaces and is therefore used as the basic thermo physical property defining the materials. The thermal penetration coefficients for the different layers of each element of the building (walls, roof, floor) are considered as design variables. The thicknesses of the different layers of each building element are also considered as design variables [7].
In this study used as Turbulence Model: k-€(standard model); Near wall treatment: Standard Wall Functions has been used and Radiation Model: P1–Insulation Calculation: Solar Calculator have been used. A list of the materials with different material characteristics used in all courtyard options would be: air as fluid, and building envelope, floorings, doors, windows, walls and roofs as building components. The values accepted for fluid air are respectively: intensity 1.2256 kg/ m3, specific heat Cp 1006.43 J/kg-K, heat conduction 0.0242 W/m-K, and viscosity 1.7894e-05 kg/m-s. The Madrasah Building has been considered for opaque surfaces: Thickness: 115 cm, Intensity: 1600 kg/ m3, Specific Heat Capacity (Cp): 800 J/kg.K, Thermal Conductivity: 0.55 W/m.K for Opaque surfaces; and Intensity: 2220 kg/m3, Specific Heat Capacity Cp: 800 J/kg.K; for transparent surfaces. Thermal Conductivity: 0.55 W/m.K, Thickness: 2 cm, Specific Heat Capacity (Cp):830 J/kg.K, Thermal Conductivity: 0.96 W/m.K,
Energy Performance of a Building in Historic Buildings
The architectural and environmental features of the ambient studied
In research area, high mountains that surround the plateaus of the Middle Anatolia Region prevent the effects of the characteristics of the sea climate from reaching inner regions. Accordingly, Konya has a hot-dry climate characterization. For this reason, continental climate is effective in Konya and other provinces of the region. The average annual precipitation is between 390-520 mm in the region.
The building density characteristic of the region comprises of households and supermarkets. The average height of the buildings around the Madrasah is about 7.5 m.
In Konya, where the highest average temperature in a year is 40.6°C, and the lowest is -26.5°C, the average temperature of its coldest month, February is 12°C, whereas the average temperature of its hottest month, July is 23.6°C. Combining with the effects of lack of humidity during summer period, the temperature felt in the region can rise as far as 40°C. In addition, sunstroke, heat crumbs and heat exhausting may also be the case. On top of that, long sunbathing periods and effects of temperatures especially during spring and summer, the effects of sun rays increase and hence affecting the comfort of the area.
Case Study
Relationship between heat transfer and wind’s coefficient of convection on the madrasah building: Heat flux both around the building surroundings and towards other surfaces of the building is generally investigated in three steps; namely shadowed surface, normal surface and frequent surface of the building. Heat transfer coefficient occurs from air flow on the surface of a complex geometry of a building that undergoes changes due to the continuously varying weather conditions. There are some experimental studies conducted to support this [17,18]. Heat variation on the outer surface of a building envelope depends on the speed, direction and flow of the wind. Convection heat transfer is classified into two, natural and forced convection. Natural convection is formed due to the differences in air density as the wind moves, while forced convection occurs due to the differences in surface pressure [19]. The amount of heat transfer by convection method is determined by using Newton Law of Cooling.
qt=hc . A . (Ty-THava)
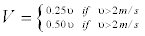
“hc”; is the coefficient of convection expressed in units of W/m2K. “A” is the surface area affected by the flow. While “qt” measured in (W) indicates the heat transfer ratio by convection. There is significant difference on coefficient of convection depending on whether the flow is laminar or turbulent. As the flow rate increases, the coefficient of convection increases [20]. If the air velocity around the surface of a building exceeds 1 m/s, the convection becomes of the forced type and the average coefficient of convection (hc); will be calculated with this expression: hc=5+3.6.V [21] where “V” indicates the air velocity that acting on the surface. It is targeted that by making use of the wind speed and its motion through gaps of naturally ventilated buildings, the volume surfaces and indoor air (through convection) can be cooled. Again, through the velocity effects, convection can be used to provide heat variation from the bodies of the people living in that volume [22,23].
Heat transfer between building envelope and atmosphere is a complex and dynamic process. Currently, there are average and simplified methodologies used in calculation of heat losses.
Depending on the way a building is exposed to sunlight, three different situations are generally, considered; shadowed surfaces, normal surfaces and sunny surfaces. A building tends to have variable and complex heat variation factors, different geometrical surfaces and varying air flow areas depending on the varying wind speeds and directions throughout a day. Another factor that affects outer surface of a building envelope is the influence of wind. When the wind velocity exceeds 1 m/s, heat transfer by a forced convection method becomes effective. Based on the results of 30 different correlation studies by Palyvos et al. the correlation of the upper wind section of a building differs from that of the lower wind section; where hw=7.4 + 4.0Vf (top wind), hw=4.2 + 3.5 Vf (lower wind) different coefficients of convection were obtained [24].
Numerical model: In order to make evaluation of the Madrasah building in terms of thermal comfort and energy performance, some assumptions had to be made. These were as follows:
The wall section consists of a number of layers with different thicknesses and physical properties. The outside surface is exposed to solar radiation (Is)t, convection heat transfer (qc,o) and radiation exchange with the sky (qr,o) The inside surface is subject to combined convection and radiation heat transfer (qi) which relates directly to the air-conditioning load required to maintain the inside design temperature (Tf,i). The mathematical model is formulated using the following assumptions.
(i) There is no heat generation.
(ii) The layers are in good contact; hence the interface resistance is negligible.
(iii) The variation of thermal properties is negligible.
(iv) The thickness of the composite roof is small compared to the other dimensions. Hence, a one- dimensional temperature variation is assumed.
(v) The convection coefficient is constant and is based on the direction of heat flow and daily average wind speed.
Based on the above assumptions, the conduction equation governing the heat transfer through the composite roof is given by
 (1)
(1)
where Tj is the thermal diffusivity (k/ρc) and the subscript j refers to the layer, i.e. j=1; 2; : : : ; n, k is the thermal conductivity, ρ is the density and c is the specific heat. The problem is principally concerned with the solution of Eq. (1), applied to all layers, to obtain the variations of temperature and heat- transfer rates subject to prescribed initial and boundary conditions. The initial temperature is taken as uniform and equal to the daily mean of the outside ambient temperature, Tf;o; mean. Of course, any other value can be used in the model since the steady periodic solution is independent of the initial temperature distribution. The boundary conditions are given as follows:
(i) Boundary conditions at the inside surface (x=0):
 (2)
(2)
where hi is the inside-surface combined heat-transfer coefficient; from the ASHRAE handbook of fundamentals [1]:
hi =9:26 W/m2 K for upward direction of heat flow; and hi =6:13 W=m2 K for downward direction of heat flow:
(ii) Boundary conditions at the outside surface (x=L):
 (3)
(3)
where hc,o is the outside-surface convection coefficient, Tf,o is the outside ambient temperature and (is the solar absorptivity of the outside surface).
The coefficient (hc,o) is a function of wind speed (v). Empirical values are taken from Ito et al. [17] as
 (4)
(4)
and,
The temperature (Tf,o) is fitted by a sinusoidal function over a 24-h period, with t=0 corresponding to midnight, as
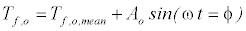 (5)
(5)
where Ao is the amplitude, ω is the frequency, and ? is the phase shift angle. The solar radiation (Is) is calculated for horizontal roofs in Turkey by using the ASHRAE clear-sky model [1]. The nonlinear radiation exchange (qr,o) is given by
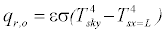 (6)
(6)
where ε is the surface emissivity, σ is the Stefan–Boltzmann constant, and Tsky is the sky temperature and is taken equal to (Tf,o-12).
In order to evaluate thermal comfort and energy performance in the Madrasah building, conditions of peoples comfort were taken into account by employing the steady regime models developed by Fanger, which assume that the body is in thermal equilibrium and that energy storage can be neglected. At a steady regime state, the thermal energy generated within the body equals the total perceptible and latent heat lost to the environment. Therefore; the body temperature does not change with time. Body’s energy balance can be expressed with the Equation 1. The equations presented in this study have been taken from ASHRAE [25].
In order to protect normal body temperature physiologic control mechanisms become active as the motion level (i.e. metabolic activities) in the body increases. And the body increases the blood flow to the skin. In this way, heat flow from the skin to the ambient increases. The two empirical expressions given above connect together thermal comfort parameters with the heat transfer. If these values are substituted into their places in Equations 2 and 1, and by using the energy balance equation (Equation 1), an equation presenting optimized thermal comfort and showing variation between people, environment and the basic parameters can be found [26].
Modelling and Simulation
The simulation was applied on the system defined by the building using Computational Fluid Dynamics (CFD) software based on the finite-volume method. An initial simulation concerned the analysis of the temperature gradient and air velocity field for a simplified model defined by the total air volume existing in the ambient, along the perimeter walls, the splay windows and in the coffered ceiling zone (Figure 2). A second simulation was used for studying the effects of thermal heat transfer and non-isothermal flow for the complex architectural model of the Slender Minarate Madrasah; Transient (Steady-state) simulation implied the following steps:
1. Three-dimensional drawing of the geometry of the Slender Minarate Madrasah;
2. Defining and setting of computational domain and subdomain;
3. Thermo-physical property assignment to the different building materials;
4. Boundary condition definition;
5. Mesh definition with utilization of different accuracy levels;
6. Heat transfer analysis, non-isothermal flow and convection analysis for temperature and heat flux (convection and total) streamline evaluation and velocity field evaluation.

Figure 2: Madrasah Modelling in Gambit.
Ansys Fluent, is a program that simulates Computational Fluid Mechanics as well as total energy analysis and thermal loads. It calculates energy consumption of a building under the light of data set by a user. The program, however; is not a decision maker in place of the user. But it can define upper and lower boundaries based on given data, thereby helping with determining suitable HVAC equipment for the building, performing energy performance optimization, estimating total cost analysis etc.
Meteorological data and geographical data input of the climatic region to which the building belongs, are carried out by the user. Meteorological data for the region between 1972 and 2009 were obtained from the records of the Turkish Meteorology Office in the region and fed into the Ansys Fluent program as inputs. For every climatic region, these data give information on ambient air temperatures, direction and magnitudes of wind, intensity of direct and scattered solar radiations and sky clouding index. After loading the geometrical and material properties, details of the equipment used for the building, programs used by that equipment, user details and other details, then the program becomes ready for generating result files. After this step, quality of the result files; daily, hourly, weekly, monthly or yearly is specified. After checking the error file, necessary data for evaluation of the building’s energy needs and user comfort can be obtained. Based on geographic location and time specified by the user, Ansys Fluent software can calculate the solar radiation gain on surfaces over which solar radiations strike with respect to the position of the sun and magnitude of its radiations.
First, by making calculations on Gambit program, a three dimensional geometry of the Madrasah building was established in the program based on the artificial environmental data. Then numerical mesh for the building whose geometry has been completed was formed. After that, all inner and outer surfaces of the building were completed and necessary details of this thermal region and those of the surfaces were uploaded.
In the CFD Fluent 6.3 program where the analysis study is performed, information on the building envelope such the thickness, density, specific heat, thermal conductance coefficient, sun radiation absorbency, sun radiation reflectivity, surface roughness and number of layers are defined whereas layers in the floorings together with (if present) separate stratifications are defined in the ground floor, mezzanine floor and roof slab. The thickness, density, specific heat, thermal conductance coefficient, sun radiation absorbency, sun radiation reflectivity, surface roughness and number of layers of the material used in the flooring are examined. On the other hand, the data used in the simulation program are defined by entering the values of volume ambient temperatures, boundary conditions for surfaces and thermal zones, absorbency of surfaces, reflectivity, density, specific heat and thermal conductance
While material, thickness, density, specific heat capacity, coefficient of heat transfer, solar radiation absorption and reflection, surface roughness and the number of layers belonging to the walls play a determining role, in floor furnishing, the material installed on the floor, intermediate floor and roof materials are dealt with, separately. The data used in the simulation program are defined after uploading values of absorption, reflection, dispersion and heat transfer where volume ambient temperatures are considered as boundary conditions for the surface.
The quality of this mesh structure formed on the building models is directly related to the accuracy and stability of the problem solved. Therefore, it is important that the mesh structure is checked. When we look at the skewness quality values for the mesh used here, we see that the worst member is at 0.64 level. With this lowest value, the mean quality value ranges at 0.64-0.26.
According to the analyses made, this level is enough for the results to converge rapidly or not diverge. The building models prepared in Ansys Gambit were then opened in Ansys Fluent solver where suitable basic equations for fluid and heat transfer, energy, momentum, and mass conservation were assigned to the fluid of the problem solved. At this stage, boundary conditions for the building as well as for the inner and outer environments are set. The solver algorithm employed simple pressure based method and implicit equation methodology. All the solutions were achieved by assuming that the system has reached a steady state independent of time variable. Turbulence and energy modeling; realizable option was opened within k-epsilon (2 eqn) “Near-Wall Treatment” was used as the “Standart Wall Function”.
Setting the boundary conditions
If we arrange all the different materials used in the courtyard selections, we find that air is used as working fluid while the building members are the building envelope, furnishings, door, window, wall and roof. Here, properties of the fluid (air) are: density 1.2256 kg/m3, Specific Heat Capacity, Cp 1006.43 J/kg-K, Heat Transfer Coefficient, 0.0242 W/m-K and viscosity 1.7894e-05 kg/ms
Meanwhile; coefficients of heat transfer used were 0. 3499 W/m-K, 1.3944 W/m-K, 0.919 W/m-K and 1.05 W/m-K for door, wall, roof and window glasses respectively. As for the HGlass selection, the properties of the glass used on the courtyard were such that; thermal conductivity; 1.05W/m-K, glass thickness 10mm,reflectivity %5, absorption 65% and permeability of 27%.
In all selections involving buildings that possess courtyards, the indoor medium boundary temperature for heating and cooling load on 21st January and 21st July was accepted to be 25°C. Based on their opaqueness and permeability values, the glasses used on the windows for outer surfaces were adjusted in such a way that they have these values; reflection 10%, absorption 26% and permeability 64%. A solar calculator module was included in the program so that solar radiations and the portions of useful solar light in a day could be calculated. Here, input data were the time interval within which the buildings are found, their latitudes and longitudes, degree of cloudiness as well as month, day, hour and minute. Together with this, P1 module was also used for radiation computations. In this case, data such as what amount of light has the air absorbed and the inside dispersion details of the light were uploaded. Because these constants are near zero, they were taken to be at around 0.000025. They are essentially very active in terms of heat transfer by radiation and increase in temperature (Table 3).
| Madrasah Building��?Boundary Conditions | Hour 07.00 | Hour 14.00 | Hour 21.00 | |
|---|---|---|---|---|
| 21st January | Temperature (0C) | -4.10C | 20C | 00C |
| Velocity (m/s) | 2,6 - NNE | 1 - SSW | 1.3 ��? S | |
| 21st July | Temperature (0C) | 160C | 290C | 18.60C |
| Velocity(m/s) | 2.1 - NNE | 3.1 - NNE | 1 - NNW | |
Table 3: Boundary Conditions of Madrasah Building for 21st January and July.
For Opaque Surfaces, Thickness (d): 115 cm, Density: 1600 kg/m3, Specific Heat Capacity (Cp): 800 J/kg.K, Thermal Conductivity: 0.55 W/m.K
For Transparent Surfaces, Density: 2220 kg/m3, Specific Heat Capacity (Cp): 830 J/kg.K, Thermal Conductivity: 0.96 W/m.K, Thickness: 2 cm
Turbulence Model: k-€ (standard model); Near wall treatment: Standard Wall Functions
Radiation Model: P1–Solar Calculator:
At the entire Madrasah building envelope that make up the courtyard formed from outside to inside like this: External plaster; 0.030 m, Thermal conductivity coefficient (λn) 1.40 W/mK, dn/λn
Rockwool 0.040 m, Thermal conductivity coefficient (λn) 0.040 W/k, dn/λn 1.00; Autoclaved aerated concrete (appropriate with mortar TS 4916), 0.200 m, Thermal conductivity coefficient (λn) 0.140 W/mk, dn/λn 1429; Internal plaster; 0.020 m, Thermal conductivity coefficient (λn) 0.870 W/Mk, Ud value of the building envelope is 0.378 W/m2K. For wall Cp: 800 J/kg.K, For glasses; 0.02 m, Thermal conductivity coefficient (λn) 0.96 W /mk, Cp: 830 J/kg.K.
Steady-state simulation of the 3D model was performed taking into account, for the external climatic conditions the hotter day from data of the Standard Year of Konya (Tables 1 and 2) shows the external climatic conditions parameters used. Both of the two model were studied without taking into account any light systems, conditioning plant and visitors presence. This was due to the basic necessity of knowing the energy and thermo-physical performances of the building container during time connected to external climatic variations. Solar radiation passing through the glass for different windows orientations, was also taken into account (Table 2). The hourly values of the transparence coefficient of the two kinds of windows, considering the incidence angle variation of the solar radiation was calculated to evaluate total solar radiation coming into the ambient. Taking into account for the indoor climatic conditions during the summer period, an initial uniform internal air temperature of 23°C or 25°C usually suggested [27-32] was used and the convection and radiation coefficients for the coffered ceiling and floor values where calculated using the literature expressions [33-35].
| KONYA | Jan. | Feb. | Mar. | April | May | June | July | Aug. | Sep. | Oct. | Nov. | Dec. |
|---|---|---|---|---|---|---|---|---|---|---|---|---|
| Average Temperature (°C) | -0.2 | 1.2 | 5.7 | 11.0 | 15.7 | 20.2 | 23.6 | 23.0 | 18.6 | 12.5 | 6.1 | 1.8 |
| Highest Temperature Mean (°C) | 4.7 | 6.8 | 12.0 | 17.4 | 22.2 | 26.8 | 30.2 | 30.0 | 26.1 | 20.0 | 13.0 | 6.7 |
| Lowest Temperature Mean (°C) | -4.1 | -3.3 | 0.0 | 4.5 | 8.6 | 12.9 | 16.2 | 15.7 | 11.2 | 6.1 | 0.8 | -2.2 |
| Average Solar radiation Period (hours) | 3.2 | 4.3 | 6.6 | 7.1 | 8.5 | 10.4 | 11.4 | 11.1 | 9.4 | 7.1 | 5.1 | 3.1 |
| Average Rainy Days | 9.7 | 8.8 | 8.7 | 9.6 | 10.6 | 6.5 | 2.8 | 2.4 | 3.5 | 6.7 | 7.0 | 10.0 |
| Mean of the Total Monthly Rainfalls (kg/m2) | 35.3 | 28.2 | 27.1 | 34.0 | 43.6 | 23.2 | 6.9 | 5.6 | 11.2 | 31.3 | 33.1 | 44.8 |
Table 1: Average Values Recorded over a Long Period (1960-2012).
| KONYA | Jan. | Feb. | Mar. | April | May | June | July | Aug. | Sep. | Oct. | Nov. | Dec. |
|---|---|---|---|---|---|---|---|---|---|---|---|---|
| Highest Temperature (°C) | 17.6 | 21.6 | 28.9 | 31.5 | 34.4 | 37.2 | 40.6 | 39.6 | 36.1 | 31. 6 | 25.2 | 20.4 |
| Lowest Temperature (°C) | -25.8 | -26.5 | 15.8 | -8.6 | -1.2 | 3.2 | 7.5 | 6.6 | 1.2 | -7.6 | -20.0 | -22.4 |
Reference: http://www.mgm.gov.tr
Table 2: Maximum and Minimum Values Recorded over many Years (1960-2012).*
Limitations and assumptions in the case study
This study was conducted for the Slender Minaret Madrasah building found in Konya region on Moderate 3rd climatic zone in Turkey. Instead of dealing with all months in a year, the analyses were made based on the hottest day of summer and the coldest day of winter, taken as 21st July and 21st January, respectively and carried out at 07.00- 4.00-21.00. HVAC was not considered for the building. Temperatures of the inside facing walls were taken as 25°C by assuming that existed in the building. Anticipation was that heat gain was only due to the solar heat source. The comfort boundary temperature for heating and cooling loads inside the building on 21st January and 21st July was assumed to be 25°C. The study involved 4 steps. In the first step, information regarding the study was collected from different sources such as experimental studies and models as well as from numerical simulation studies where all the details collected were assimilated, compared with the optimized model to be used in the program and analyses were specified. In the second step, the Madrasah model was established in the Ansys Gambit software, forming numerical mesh networks from defined building models, defining thermal zones of the models and completing their thermal surfaces and making decision on the boundary conditions. Then input data involving different geographic and climatic zones were uploaded into the Ansys Fluent software. In addition, other details of the building such as building envelope, its construction materials and their permeability’s and reflectivity’s were also uploaded. The building surfaces decided on the previous Gambit step were then completed in this step. After that, entrance of the data that form indoor heat gains for the building was accomplished and analyses started.
The third step was the reporting phase, where for every analysis, whether inside the building or within the courtyard, numerical and visual records were made including, temperature and average temperature distributions, indoor total heat gains and losses, air speed within the courtyard, air direction, magnitude, air layering, air variation ratios for the buildings with courtyards in thermal zones, their ambient temperatures, total and average heat transfer for all the surfaces and roof, their surface temperatures, pressures and speed variations, together with temperature, pressure and wind speed on horizontal cross sections of the indoor building and of the courtyards at the levels of 1.00 m, 2.00 m and 3.00 m. In the fourth step, the numerical and visual results obtained in the third step, based on all evaluation parameters, and were compared with the findings from literature. Then evaluation and comments were made.
Creation of the models and the analysis phase in CFD
The geometries of Madrasah building model examined were drawn and the digital mesh networks of the models belonging to defined building were created, the thermal regions of model were defined and surfaces of the model were created and restricting conditions were decided upon. Later geographical and climatic data of different climatic regions were entered into the Fluent 6.3 simulation program. Further, data such as permeability and reflectivity of the structure envelope, constructional components and constructional materials were entered. The thermal regions, building surfaces and elements thereof previously decided upon during the Gambit phase were defined. Later, the data comprising the inter-building thermal gains were entered and analysis commenced. As criteria of the optimization studies; on 21st day of the 7th month for the cooling period of the summer months, and 21st day of the 1st month for the heating period, daily, daytime and nighttime inter-building temperature and average temperature distributions, inter-building total temperature gain and loss values, inter-building air velocity movements, direction of air, layering of air, air change ratio pertaining to Madrasah building thermal zones, inter-building thermal zones of building, for all building surfaces and roof area; overall and average heat transition amount, surface temperatures, pressures, and velocity distributions, inter-building temperature, pressure and wind speed values were analyzed, and taking into consideration such values, internal temperature and average temperature distributions, overall temperature gain, total temperature loss calculations and also sunlight gains on the surface of the Madrasah building were determined and calculated (Figure 2).
For the purpose of better cooling and ventilation throughout the cooling season, and optimization of inter-building temperature gains and losses throughout the heating season, investigation of architectural solutions, and evaluations to reveal the effects of such results on cooling and ventilation load were made. The numerical and visual reports of all such values were prepared and relying on such values; evaluations and comments were made on internal temperature and average temperature distributions on the building surface, overall temperature gain, total temperature loss calculations, investigation of architectural solutions for better cooling and ventilation as well as their effects on cooling and ventilation.
Result and Discussion
Evaluation of the findings obtained from analysis results
This study has evaluated the results of the CFD-Fluent analysis; the total energy performances of all building options in terms of energy gain-loss in the building’s entirety during both periods of summer cooling and the winter-heating for moderate climatic region examined.
From the raw CFD-Fluent data obtained, total heat transfer amount and solar radiation gain tables are created for the sum of all horizontal and vertical building surfaces for duration of 24 hours on 21st January and 21st July for each three climatic region. The numerical values obtained from tables have been separately evaluated in terms of both total building surface area and total building volume.
Wind flow and surface temperatures on building crosssection plane
On 21st January at 07.00, the wind speed around the building was recorded as reaching 0.2 m/s on the wind upper section and 0.7 m/s on its lower section. Similarly, temperatures on the building were found to be -2.00°C and 0.00°C on the east and west facades respectively; whereas the temperature on the South facade was found to vary between 0.00°C and 1.00°C. At 14.00 hours, when the outdoor temperature was 2°C, the wind speed on the upper wind section was 1.00 m/s while that on the lower wind section dropped to 0.4 m/s. As for the surface temperatures, values between 14.00°C and 15.00°C were recorded on the East facade, while the Westside front experienced abrupt rise reaching temperatures varying between 24.00°C and 27.00°C. The temperature on the South facade was found to be 28.00°C. However; at around 21.00 hours, both upper wind and lower wind speeds were found to drop to an average value of 0.2 m/s. Surface temperatures on the building at this time were found to vary between 0.00°C and -1.00°C on the east and west facades while that on the south front exhibited the value of 2.00°C (Table 4).
| Months | Transparent Area | Madrasah �? Solar Radiation Values (W/m2) | |
|---|---|---|---|
| 07.00 | 14.00 | ||
| 21st January | Large dome Facade | 33,82 | 255,69 |
| West Facade | 18,66 | 300,72 | |
| South Facade | 32,22 | 328,44 | |
| North�? Facade | 17,42 | 222,00 | |
| 21st July | Large dome�? Facade | 222,62 | 375,64 |
| West Facade | 200,39 | 444,40 | |
| South Facade | 190,08 | 372,84 | |
| North Facade | 191,56 | 363,63 | |
Table 4: Madrasah Solar Radiation Values for the 21st July and 21st January days.
On 21st July at 07.00 hours, the wind speeds around the building were found to be 2.00 m/s and 0.5 m/s for the upper and lower wind sections respectively. When looking at the temperature values for the building, it is seen that from 07.00, the highest temperatures exist on the West façade; where the temperature of 36.00°C was recorded on this face, while the East front exhibited only 28.00°C. As for the south facade, the surface temperatures varied between 29.00°C and 33.00°C. At 14.00 hours, the outdoor temperature was 2°C while upper wind section had a wind speed of 0.1 m/s and the lower section reached 2.50 m/s. While the building’s surface temperatures fluctuated within the range of 14.00-15.00°C on the East front, these values jumped to 24.00°C-27.00°C on the West surface. The temperature of the South façade was found to be 28.00°C. At 21.00 hours, the wind distributions on both upper and lower wind sections had shown an increase where throughout the velocity gradient the speed varied between 0.2 m/s and 1.2 m/s as the wind rises above the ground. The surface temperatures were at the interval of 18.00-19.00°C on the East and West fronts whereas the South front recorded the value of 20.00°C (Figure 3 and Table 5).

Figure 3: 21st January and 21st July Madrasah Wind Velocity Diagram.
| Months | Total Surface Heat Flux (W/m2) | ||
|---|---|---|---|
| 07.00 | 14.00 | 21.00 | |
| 21st January | -453,81 | -54,9 | -390,27 |
| �? 21st July | 113,59 | 472,69 | -65,76 |
| Months | Solar Heat Flux (W/m2) | |||
| 07.00 | 14.00 | 21.00 | ||
| 21stJanuary | 352,86 | 3720,4 | - | |
| 21stJuly | 2979,65 | 5570,6 | - | |
Table 5: 21 January and 21 July Total Surface Heat Flux and Solar Heat Flux for Madrasah Building��?s.
During the evaluation of total energy performances of madrasah building, the solar heat flux and Total Surface Heat Flux values obtained by the madrasah building have been manifested with separate tabulation and graphics.
Accordingly, when the evaluated the Table 4, seeing that whereas the maximum sunlight values of Madrasah in the moderate climatic region of Konya during the less hot period 21st January between the daily hours of 06.58-17.05 is around 300 W/m2 for west side ; when it comes to 21st July between the daily hours of 04.41-19.12 is around 450 W/m2 for west side. Concerning the maximum heat flux obtained from the building’s surface on 21st January, it is seen that at 14.00, attains maximum total solar heat flux of 3700 W/m2 between the daily hours of 06.58-17.05; (Table 5). When the evaluated the Table 5, the maximum total surface heat flux values during the less hot period 21st January -453.81W/m2 at 07.00; the maximum solar heat flux on 21st July between the daily hours of 04.41-19.12 is around 5500 W/m2 at 14.00 (Table 5).
Conclusion
Given that the overall aim of the project is to facilitate the choice and design of measures for enhanced energy efficiency and preventive conservation in buildings of the cultural heritage, especially with focus on the use of building simulation in that context, the outcomes must be assessed as to their usefulness in that perspective. It can be concluded that the investigations made provide a good foundation for a continued work for the fulfillment of the aim.
The building physics, energy performances and thermal comfortability related to the simulation model building was investigated in order to determine suitable characteristics of the mathematical model, and different alternative methods and potentials were discussed. Potential ways of dealing with issues with the alternatives were suggested, though not thoroughly elucidated at this point.
Results of this study have revealed that, besides the Slender Minaret Madrasah dealt with in this study, it is necessary that comfort conditions for historical buildings in other climatically zones be investigated. Under this context, due to the fact that data (locations, directions and envelope properties) obtained based on general passive design strategies for every type of a building in those climatic regions will differ from each other, it is recommended that analysis suitable to those features be made. The numerical analysis results indicate that this study conducted on the Madrasah building and other structures existing in the same Seljuk era present some important basics in terms of energy and comfort conditions for future studies and that the study establishes a design foundation for similar works. The study found that, on 21st January, 07:00 o’clock, the wind velocity around the building reaches 0.2 m/s as the upper wind section value and 0.7 m/s on the lower wind zone. Surface temperatures on the building take values of -2.00°C and 0.00°C on the East and West facades whereas on the Southfront, the temperature ranges between 0.00°C and 1.00°C.
As for the 21st July, at 07.00 o’clock, the upper wind section of wind records wind velocity of 2.00 m/s while the lower section exhibits a drop to 0.5 m/s. The surface temperatures, in this case, seem to be led by the Westside front, where it is found to have the highest value since 07.00 o’clock.
In order to achieve whether micro-air conditioning comfort state in a building or macro-air conditioning for a town, studies on effects of natural air conditioning not only on the shape of a building, but also on urban residential areas, residential buildings as well as on air flow inside and around buildings should be conducted by making use of Computational Fluid Dynamics (CFD) Simulations and Wind Tunnel Tests. The study, consequently, has found that the Slender Minaret Madrasah building constructed in the 13th Century, thermal comfort conditions when its energy performance and comfortability were compared. In order to achieve night comfort conditions especially, in Konya climatic region, where a significant thermal difference between day and night is recorded, programs that include humidity factor should be used with the CFD to help deepening the parameter study instead of using CFD programs alone.
Generally, the effect of shadowing on the required heating load during winter is more than its effect on decreasing the cooling load during summer. Thus, the sensitivity of the heating load towards the obtained solar radiation is higher than the sensitivity of the cooling load towards shadowy area. We can therefore conclude that making solar radiation gain during winter is more critical (important) than evading this during summer. It has been observed that the required annual energy demand increases in parallel with the increase in courtyard length. However, this increase ratio is not directly proportional to the increase in courtyard length when considered arithmetically. Generally, annual energy consumption increases as the Madrasah courtyard building shape gets longer as a direction of prevailing wind. The solar radiation received by the Madrasah courtyard building surfaces, heat gain and therefore its effect on the required cooling and heating loads has once again been revealed.
The development of recommendations and guidelines about historical buildings investigation should be achieved.
This is to be built on the results of the other investigations, meaning that it is the last piece of the puzzle to be out in place, but nevertheless, as the aim it is, it is of value to keep in mind that this is the destination for the endeavor, and that the rest of the work in the end always has to relate to this task.
References
- GeroJS (1983) Computer Aided Architectural Design — Past, Present and Future.Architectural Science Review 26: 2-5.
- PavlikZ, Cerny R (2009) Hygrothermal Performance Study of an Innovative InteriorThermal Insulation System. Applied Thermal Engineering 29: 1941-1946.
- ChwiedukD (2003) Towards Sustainable-Energy Buildings. Applied Energy 76: 211-217.
- Role of Simulation in EnergyEfficient Building Design. Environmental Design Solutions.
- Aklanoglu F (2007) Effects ofClimatically Changes on Design and Applications of Landscaping. InternationalConference for Global Climatic Changes and Environmental Effects, Konya.
- (2010)Directive2010/31/EUof the European Parliament and of the Council of19May2010 on the energy performance of buildings. Official Journalof the European Union.
- Lomas KJ (1992) ThermalModeling of Building Envelopes: The State of the Art Proc. of Sym. on EnergyEfficient Buildings, Kowloon, Hong Kong.
- LittlerJGF (1982) Overview of Some Available Models for Passive Solar Design. ComputAided Design 14: 15-18.
- NelderJA, Mead R (1965) A Simplex Method for Function Minimization. Comput J: 308-313.
- MitchellRA, Kaplan JL (1968) Non linear constrained optimization by a non-randomcomplex method. J Res Natl Bur Stand 72C: 249-258.
- CIBSE (1986) Environmental Criteria for Design. Section A1, CIBSEGuide, Vol. A. The Chartered Institute of Building Services, London, UK.
- CIBSE (1986) Summertime Temperatures in Buildings. Section A8, CIBSEGuide, Vol. A. The Chartered Institute of Building Services, London, UK.
- BouchlaghemNM, Letherman KM (1990) Numerical Optimization Applied to The Thermal Design ofBuildings. Energy and Buildings 25: 117-124.
- BalarasCA (1995) The Role of Thermal Mass on The Cooling Load of Buildings; AnOverview of Computational methods. Energy and Buildings 24: l-10.
- Bayraktar M, KalayciogluE, Yilmaz AZ (2011) A Real-Life Experience Of Using Dynamic Building SimulationFor Building Environmental Performance Assessment In Turkey. 12thConference of International Building Performance Simulation Association,Sydney, Australia.
- (2010) National Building Energy Performance CalculationMethodology of Turkey. Turkish Official Journal.
- 2002/91/EC, (2002) Directive 2002/91/EC of the European Parliamentand of the Council of 16 December 2002 on the Energy Performance of Buildings
- Ito N, Kimura K, Oka J (1972) IIA Field Experiment Study on theConvective Heat Transfer Coefficient on Exterior Surfaces of a Building. ASHRAETransactions 68: 184.
- KreithF, Manglik RM, Bohn MS (2011) Principles of Heat Transfer. 7th edtn.CENGAGE Learning, USA.
- GeankoplisCJ (1978) Transport Processes and Unit Operations. Allyn and Bacon, USA.
- CengelYA, Boles MA (1994) Thermodynamics: an Engineering Approach. 5th edtn,McGraw Hill, London, UK.
- DreyfusJ (1960) Le confort dans l'habitat en pays tropical: La protection desconstructions contre la chaleur. Problèmes de ventilation.
- AllardF (1992) Natural ventilation in buildings, a design handbook. European ComissionDirectorate general for energy alternative program, UK.
- GivoniB (1998) Climate Considerations in Building and Urban Design. Wiley, New York,USA.
- PalyvosJA (2008) A Survey Of Wind Convection Coefficient Correlations for BuildingEnvelope Energy Systems Modeling. Applied Thermal Engineering 28: 801-808.
- ASHRAE IC (1989) Energy Efficient Design of New Buildings ExceptLow-Rise Residential Buildings.
- Fanger PO (1999) Air Humidity Requirements for Human Comfort. ASHRAETransactions 99: 641-647.
- WongNH, Heryanto S (2004) The Study of Active Stack Effect to Enhance NaturalVentilation Using Wind Tunnel and Computational Fluid Dynamics (CFD)Simulations. Energy and Buildings 36: 668-678.
- JiangY, Chen Q (2002) Effect of Fluctuating Wind Direction on Cross NaturalVentilation in Buildings from Large Eddy Simulation. Building and Environment37: 379-386.
- JiangY, Chen Q (2001) Study of Natural Ventilation in Buildings by Large EddySimulation. Journal of Wind Engineering and Industrial Aerodynamics 89: 1155-1178.
- AyadSS (1999) Computational Study of Natural Ventilation. Journal of WindEngineering and Industrial Aerodynamics 82: 49-68.
- VersteegHD, Malalasekera W (2007) An Introduction to Computational Fluid Dynamics: TheFinite Volume Method. Pearson Education Limited, USA.
- GasparPD, Barroca RF, Pitarma RA (2003) Performance Evaluation of CFD Codes inBuilding Energy and Environmental Analysis. 8th International IBPSAConference, Eindhoven, Netherlands: 371-378.
- EvolaG, Popov V (2006) Computational Analysis of Wind Driven Natural Ventilation inBuildings. Energy and Buildings 38: 491-501.
- MillsA (1995) Heat and Mass Transfer, CRC Press, UK.
Relevant Topics
- Architect
- Architectural Drawing
- Architectural Engineering
- Building design
- Building Information Modeling (BIM)
- Concrete
- Construction
- Construction Engineering
- Construction Estimating Software
- Engineering Drawing
- Fabric Formwork
- Interior Design
- Interior Designing
- Landscape Architecture
- Smart Buildings
- Sociology of Architecture
- Structural Analysis
- Sustainable Design
- Urban Design
- Urban Planner
Recommended Journals
Article Tools
Article Usage
- Total views: 17357
- [From(publication date):
August-2014 - Jul 19, 2025] - Breakdown by view type
- HTML page views : 12552
- PDF downloads : 4805