Analysis of the Relationship between Urban Heat Island and Land Cover in Istanbul through Landsat 8 OLI
Received: 25-Sep-2017 / Accepted Date: 04-Nov-2017 / Published Date: 08-Nov-2017 DOI: 10.4172/2157-7617.1000423
Abstract
The Urban Heat Island (UHI) effect, the characteristic warmth of a settlement compared with its surroundings, is the best-known climatic response to disruptions caused by urban development. Istanbul has experienced a highspeed urban growth in the last century. While the population of the city was under one million in 1900, it reached to 14 million in 2015. Almost 14 times growth in one century has made Istanbul the largest city in Turkey. High-speed urbanization and transformation of the natural environment and forests into built-up area has a critical impact on the metropolitan’s climate. Due to the alteration of heat energy balance and as a megacity, Istanbul has been affected by increasing severe heat waves in summer. This study focuses on two of the effective urban design factors upon the urban heat islands (UHIs) in Istanbul such as vegetation cover and characteristic of surface materials. The spatial pattern of land surface temperature (LST), surface albedo, the normalized difference vegetation index (NDVI) and land cover-land use (LCLU) are analyzed to explore the cooling or heating impacts of the green areas and the build-up areas on the UHI. The methodology is based on using Landsat 8 OLI (Operational Land Imager) satellite image that captured on 6 September 2015, and available meteorological data include two stations, one in city center (Kandilli Station) and the other one in rural area (Sile Station) that revealed average annual temperature differences 8.3°C in the last decade. The results of the analysis show that artificial surfaces with low albedo and low vegetation cover have the most positive exponential relationship with land surface temperature (LST) and increasing effect on UHI formation. The results of the analysis highlight that high albedo material (HAM), greenery on the surface and on the roofs (VEG), and a combination of them can be used as the UHI mitigation strategies.
Keywords: Urban Heat Island (UHI); Albedo; Land Surface Temperature; Land Use and Land Cover; Mitigation
Abbreviations
CBD: Central Business District; DN: Digital Numbers; FVC: Fractal Vegetation Cover; GHG: Green House Gas; HAM: High Albedo Material; LSE: Land Surface Emissivity; LST: Land Surface Temperature; LULC: Land Use-Land Cover; MTL: Material Library; NASA: National Aeronautics and Space Administration; NDVI: Normalized Difference Vegetation Index; NIR: Near Infrared; OLI: Operational Land Imager; SWIR: Short Wave Infrared Radiometer; TIRS: Thermal Infrared Sensor; TOA: Top of Atmosphere; TIRS: Thermal Infrared Sensor; UHI: Urban Heat Island; USGS: United States Geological Survey; VEG: Vegetation
Introduction
Urbanization is a global phenomenon and is expected to continue for decades to come, most of the urban population growth up to 2030 will occur in developing countries. Urban development has serious effects on the global environmental quality, including the quality of air, increase in temperature and traffic congestion [1]. Cities contribute to climate change in three main ways: through direct emissions of Green House Gas (GHG) that occur within city boundaries; through the GHG emissions that originate outside of city boundaries but are embodied in civil infrastructure and urban energy consumption; and through city-induced changes to the earth’s atmospheric chemistry and surface albedo [2]. The intensification of urbanization in recent decades has also caused changes in the types of ground cover; natural soils have replaced by impermeable materials such as asphalt and most building materials, which, because they do not provide water filtration and absorption functions, modify the natural path of storm water [3]. By restricting the availability of water in urban areas, natural cooling processes, such as evaporation of the moisture in soil and evapotranspiration of vegetation, are limited and cannot offset urban warming These changes cause urban regions to become warmer than their rural surroundings, forming an “island” of higher temperatures in the landscape [4]. Urban Heat Island (UHI) does not just a bit of additional, minor discomfort. Their higher temperatures, lack of shade and role in increasing air pollution have serious effects on human mortality and disease [5]. An UHI mainly appears in the spatial distribution of LST, which is governed by surface heat fluxes and is obviously affected by urbanization. Acquiring LST is the primary and key step in conducting UHI studies. Previously, studies of UHI based on air temperature obtained from weather stations or automobile transects [6]. In this study, UHI of Istanbul megacity has been investigated by producing LST, LULC and albedo map of built environment in Istanbul. The main objectives of study were to derive LST from the Landsat OLI thermal band for 6 September of 2015, using single-window. Analyzing the relationship between UHI and LST, LULC and albedo of materials in built environment of Istanbul shows the higher risk areas of the city. As conclusion, the strategical urban planning solutions for mitigating the impact of the UHI with focusing Istanbul’s urban development plans will proposed.
Study Area
Istanbul, which is located at 41.09°N, 29.42°E, has over 14 million population and 5461 square km area. So, it is the largest city with highest density in Turkey (Figure 1). The Bosporus, a 30 km strait that connects the Black Sea with the Sea of Marmara, is considered to be the boundary between Europe and Asia, and the urban Istanbul is located on both sides of the southern half of the strait [7]. The population of the city passed the 1 million milestone 110 years ago, and after that Istanbul’s population doubled within 70 years; the rapid changes in population of the city continued during years and it caused unplanned and unexpected urbanization in Istanbul. Therefore, it made some urban problems in the city and changed Istanbul in to metropolitan.

Figure 1: Istanbul, study area.
This urbanization made changes in structure and morphology of the city. Some of the problems which were effected from this rapid urbanization are: high urban density, change of green areas to constructed area, Increasing transportation issues, traffics, energy consumption, unplanned sprawl development and lack of basic urban services, illegal construction, creation of slums, crime, water, soil and air pollution leading to environment degradation, climate change and poor governance arrangements. Problems resulting from concentration and mobility of the population and the social actors have transformed the social relations as well as the infrastructure and spatial features of the metropolitan area. In this way, various activities from political to cultural are largely taking place in Istanbul and its urban places are affected by them [8]. Therefore, it is essential to have an understanding of how Istanbul grew and changed through the time (Table 1).
| Year | 1860 | 1885 | 1890 | 1897 | 1901 | 1914 | 1927 |
|---|---|---|---|---|---|---|---|
| Population | 715,000 | 873,570 | 874,000 | 1,059,000 | 942,900 | 909,978 | 680,857 |
| Year | 1935 | 1940 | 1945 | 1950 | 1955 | 1960 | 1965 |
| Population | 741,148 | 793,949 | 860,558 | 983,041 | 1,268,771 | 1,466,535 | 1,742,978 |
| Year | 1970 | 1975 | 1980 | 1985 | 1990 | 2000 | 2010 |
| Population | 2,132,407 | 2,547,364 | 2,772,708 | 5,475,982 | 6,629,431 | 8,803,468 | 13,120,596 |
Table 1: Population changes in Istanbul [8].
Because of rapid urbanization and unplanned built environment growth in Istanbul, dramatic land cover changes have occurred especially within the past 70 years. Now Istanbul has 39 districts that some of them have the highest density in Turkey and in these districts which mostly located in south of the city, there is not more open space and vegetation (Figure 2 and Table 2).

Figure 2: Density in 39 districts of Istanbul 2015.
| District | Density (per km2) | District | Density (per km2) | District | Density (per km2) |
|---|---|---|---|---|---|
| Gaziosmanpaşa | 42,977 | Beşiktaş | 10,534 | Sultangazi | 14,391 |
| Güngören | 42,129 | Avcılar | 10,144 | Kartal | 11,872 |
| Bahçelievler | 36,333 | Maltepe | 9,185 | Sultanbeyli | 11,148 |
| Bağcılar | 33,802 | Şişli | 7,834 | Arnavutköy | 466 |
| Kağıthane | 29,531 | Bakırköy | 7,529 | Silivri | 191 |
| Bayrampaşa | 28,551 | Beylikdüzü | 7,419 | Çatalca | 37 |
| Beyoğlu | 27,037 | Sancaktepe | 5,736 | Şile | 31 |
| Fatih | 26,324 | Pendik | 3,783 | Esenyurt | 17,227 |
| Zeytinburnu | 25,613 | Başakşehir | 3,382 | Ataşehir | 16,211 |
| Esenler | 24,851 | Sarıyer | 2,275 | Üsküdar | 15,298 |
| Küçükçekmece | 20,290 | Tuzla | 1,891 | Ümraniye | 15,195 |
| Kadıköy | 18,586 | Eyüp | 1,646 | Çekmeköy | 1,566 |
| Adalar | 1,414 | Beykoz | 805 | Büyükçekmece | 1,465 |
| http://www.citypopulation.de/php/turkey-istanbulcity.php | |||||
Table 2: Istanbul’s districts and their density 2015.
During last decades some of urban development patterns such as Sprawls and isolated high-rises have been formed in the city’s surroundings (open lands), that is continuing to the future in combination with mega development projects such as third bridge. These development strategies will transform the only northern forest and vegetated areas into artificial settlement areas. The dense development will intensify UHI effect with increasing temperature differences between urban and rural areas [9]. Based on Istanbul’s expansion process there is emergent need for finding the interaction between urban factors (such as LULC, albedo and NDVI), LST and their effect on Istanbul’s UHI as well as to evaluate and reconsider to the urban development plans and strategies of Istanbul.
Data Presentation
This investigation based on Landsat 8 OLI (Operational Land Imager) satellite image and available meteorological data include two stations, one in city center and the other one in rural area. According to meteorological data from Istanbul’s meteorological organization the most-high temperature and UHI of Istanbul is in summer so based on that it has been tried to find out the clearest satellite image of the city (with least cloud cover) close to summer months. The image captured on 6 September 2015 (Table 3). In order to examine the relationship between urban factors (LULC, albedo and vegetation), LST and UHI in Istanbul, these data have been analyzed. The Landsat 8 OLI providing moderate-resolution imagery, from 15 meters (in visible and SWIR bands) to 100 meters (in thermal Infra-Red bands), of earth’s land surface and polar regions, Landsat 8 operates in the visible, nearinfrared, short wave infrared and thermal infrared spectrums [10].
| Satellite | Sensor | Bands Spectrums | Spectral Resolution (micrometer) | Spatial Resolution | Temporal Resolution | WRS_PATH | WRS_PATH | Cloud Cover |
|---|---|---|---|---|---|---|---|---|
| Landsat 8 | OLI | Coastal aerosol | 0.43-0.45 0.45-0.51 0.53-0.59 0.64-0.67 0.85-0.88 1.57-1.65 2.11-2.29 |
30 meter | 16 Days | 180 | 31 | 0.46 |
| Blue | ||||||||
| Green | ||||||||
| Red | ||||||||
| NIR | ||||||||
| SWIR | ||||||||
| SWIR | ||||||||
| (Panchromatic) 8 | 0.50-0.68 | 15 | ||||||
| (Cirrus) 9 | 1.36-1.38 | 30 | ||||||
| (TIRS) 10 | 10.60-11.19 | 100 | ||||||
| (TIRS) 11 | 11.50-12.51 | 100 |
Table 3: Landsat 8 OLI, 6 September 2015.
Methodology
Image pre-processing
The Landsat8 OLI satellite image of Istanbul was downloaded from Earth Explorer website. It has been tried to select image with the least of cloudiness (10%). The overall cloud cover of the image is 0.12 and cloud cover of Land is equal to 0.46 (Table 3). Visible and thermal bands of Landsat8 OLI imagery have been used for mapping Land Surface Temperature (LST) of Istanbul (Figure 3), therefore bands 2, 3 and 4 as visible bands, and band 5 as Near Infrared band were been stacked together. In addition, thermal bands 10 and 11 were been preprocessed separately to calculate Land surface temperature. Some algorithms and methods developed for LST retrieval such as Sobrino, 2003 and Qin, 2001. Standard Landsat 8 data products provided by the USGS consist of quantized and calibrated scaled Digital Numbers (DN) representing multispectral image data, acquired by both the Operational Land Imager (OLI) and Thermal Infrared Sensor (TIRS). The products are delivered in 16-bit unsigned integer format and can be rescaled to the top of atmosphere (TOA) reflectance and radiance using radiometric rescaling coefficients provided in the product metadata file (MTL file), as briefly described below, The MTL file also contains the thermal constants needed to convert TIRS data to the atsatellite brightness temperature.

Figure 3: LST map of Istanbul, Turkey, 06 September 2015, WGS 84 UTM zone 36N.
Conversion to TOA reflectance
For converting OLI band data to TOA planetary reflectance using reflectance-rescaling coefficients provided in the product metadata file (MTL file). The equation 1 is used to convert DN values to TOA reflectance for OLI data as follows:
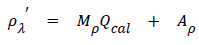 (1)
(1)
Where:
ρλ' = TOA planetary reflectance, without correction for solar angle.
Mρ = Band-specific multiplicative rescaling factor from the metadata.
Aρ = Band-specific additive rescaling factor from the metadata.
Qcal = Quantized and calibrated standard product pixel values (DN).
TOA reflectance with a correction for the sun angle is calculated in equation 2.
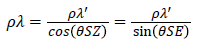 (2)
(2)
Where: ρλ = TOA planetary reflectance.
θSE = Local sun elevation angle.
θSZ = Local solar zenith angle; θSZ = 90° - θSE
For more accurate reflectance calculations, per pixel solar angles could be used instead of the scene center solar angle, but per pixel solar zenith angles are not currently provided with the Landsat 8 products.
Conversion to At-Satellite brightness temperature
TIRS band data is converted from spectral radiance to brightness temperature using the thermal constants provided in the metadata file using equation 3:
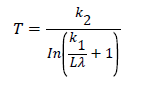 (3)
(3)
Where,
T = At-satellite brightness temperature (K).
Lλ = TOA spectral radiance (Watts/ (m2 * srad * μm).
K1 = Band-specific thermal conversion constant from the metadata).
K2 = Band-specific thermal conversion constant from the metadata.
Normalized Difference Vegetation Index (NDVI) calculation of Satellite Images of Istanbul
The Normalized Differential Vegetation Index (NDVI) is a standardized vegetation index, which allows us to generate an image showing the relative biomass. The chlorophyll absorption in Red band and relatively high reflectance of vegetation in Near Infrared band (NIR) are using for calculating NDVI. The NDVI is often used worldwide to monitor drought, monitor and predict agricultural production, assist in predicting hazardous fire zones, and map desert encroachment (Figure 4). The NDVI is preferred for global vegetation monitoring because it helps to compensate for changing illumination conditions, surface slope, aspect, and other extraneous factors [11]. Green vegetation reflects more energy in the near- infrared band than in the visible range. Output of the NDVI method creates a single-band dataset that only shows greenery [12]. Values close to zero represent rock and bare soil and negative values represent water, snow and clouds. Taking ratio or difference of two bands makes the vegetation growth signal differentiated from the background signal. The NASA scientist developed NDVI method (Equation 4). By taking a ratio of two bands, drop the values between -1 to +1. Table 4 shows the red and infrared bands reflectance values of features and their NDVI values. Water has an NDVI value less than zero, bare soils between zero and 0.1, and vegetation over 0.1. Increase in the positive NDVI value means greener the vegetation.
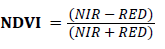 (4)
(4)

Figure 4: NDVI map of Istanbul, Turkey, 06 September 2015, WGS 84 UTM zone 36N.
| Cover Type | Red | NIR | NDVI |
|---|---|---|---|
| Dense vegetation | 0.1 | 0.5 | 0.7 |
| Dry Bare soil | 0.269 | 0.283 | 0.025 |
| Clouds | 0.227 | 0.228 | 0.002 |
| Snow and ice | 0.375 | 0.342 | -0.046 |
| Water | 0.022 | 0.013 | -0.257 |
Table 4: Typical reflectance values in the red and infrared channels, and the NDVI for typical cover types.
Where: RED = DN values from RED band and NIR = DN values from Near Infrared band
Here the Landsat image acquired from USGS Earth Explorer has been used. The data is in GeoTiff format with 16-bit radiometric resolution (ranges from 0-65535). Landsat 8 OLI and Thermal Infrared Sensor (TIRS) images consist of nine spectral bands with a spatial resolution of 30 meters for Bands 1 to 7 and 9. The resolution for Band 8 (panchromatic) is 15 meters. In addition, it also has two Thermal IR bands with a spatial resolution of 100 m (later resampled into 30 m). Before calculating the NDVI the DN data must be converted to reflectance, here the IR and NIR bands are 4 and 5 respectively. OLI spectral radiance data also is converted to TOA planetary reflectance using reflectance-rescaling coefficients provided in the landsat8 OLI metadata file. The equation 5 is used to convert DN values to TOA reflectance for OLI image:
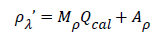 (5)
(5)
Where:
ρλ’ = TOA planetary reflectance, without correction for solar angle. Note that ρλ’ does not contain a correction for the sun angle.
Mρ = Band-specific multiplicative rescaling factor from the metadata.
Aρ = Band-specific additive rescaling factor from the metadata.
Qcal = Quantized and calibrated standard product pixel values (DN).
Correcting the Reflectance value with sun angle Reflectance with a correction for the sun angle is then equation 6:
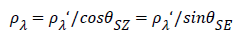 (6)
(6)
Where:
ρλ = TOA planetary reflectance.
θSE = Local sun elevation angle.
θSZ = Local solar zenith angle; θSZ = 90° – θSE
Calculating NDVI from 4th and 5th bands
As we discussed earlier to find NDVI we use the formula of
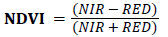
NDVI = (Band 5 corrected –Band 4 corrected)/ (Band 5 corrected + Band 4 corrected)
Estimation of Fractal Vegetation Cover (FVC)
Estimation FVC for an image using NDVI image obtain using the equation 7. FVC estimate the fraction of area under vegetation. Split- Window algorithm utilize FVC to estimate Land Surface Emissivity (LSE). After reclassifying NDVI layer into soil and vegetation and calculate NDVI for soil and vegetation, the algorithm of FVC was implemented by equation 7:
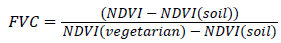 (7)
(7)
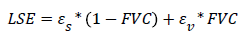
Estimation LSE from FVC layer using algorithm in equation 8. Land Surface Emissivity measure the inherent characteristic of earth surface. It measures its ability to convert thermal or heat energy into radiant energy. LSE estimation required emissivity of soil and vegetation of both Band 10 and 11 are given in Table 5. LSE of Band 10 and 11 are individually calculated.
| Emissivity | Band 10 | Band 11 |
|---|---|---|
| εs | 0.971 | 0.977 |
| εv | 0.987 | 0.989 |
Table 5: Emissivity for soil and vegetation of Band 10 and 11.
Where:
ɛs = Emissivity for soil
ɛv = Emissivity for vegetation
FVC = Fractional Vegetation Cover
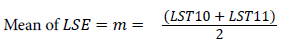
Mean and Difference of LSE
Difference of 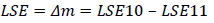
m: Mean LSE
Δm: Difference of LSE
Estimation of Land Surface Temperature (LST)

Where:
TB10 and TB11 = Brightness Temperature of Band 10 and 11. C0- C9 = Split-Window coefficient values (Table 6).
 (8)
(8)
| Constant | Value |
|---|---|
| C0 | -0.268 |
| C1 | 1.378 |
| C2 | 0.183 |
| C3 | 54.300 |
| C4 | -2.238 |
| C5 | -129.200 |
| C6 | 16.400 |
Table 6: C0-C9 – Split-Window coefficient values.
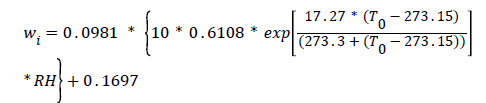
w: Atmospheric water-vapor content = 0.013.
Albedo calculation using Landsat8 OLI satellite imagery of Istanbul
Albedo is an important property of the Earth surface heat budget. A simple definition of albedo is the average proportion of solar energy that is reflected by Earth’s surface, it is an essential climate describing the energy available to drive atmospheric, land, oceanic, and cryosphere temperature and evaporation regimes as well as vegetative evapotranspiration, photosynthesis, and carbon assimilation [13,14]. Improving the spatial detail and precision of surface albedo measures using Landsat is especially important in understanding the impacts of local land cover change. Variations in surface albedo, particularly in areas of permanent and seasonal snow cover, have been shown to play a significant role in the radiative forcing of the Earth system and represent a significant contributor to ongoing changes in the terrestrial energy balance [15-17]. This unit less quantity has values ranging from 0 to 1.0 and will vary based on the land cover. For example, snow would have a high value and coniferous forests a low value. The input to the albedo calculation will be a Landsat image that has been converted from digital numbers to Top of Atmosphere (TOA) reflectance. Liang (2000) developed a series of algorithms for calculating albedo from various satellite sensors. His Landsat formula to calculate Landsat shortwave albedo was normalized by Smith (2010) and is presented below.
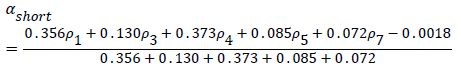 (9)
(9)
Where,
ρ represents Landsat bands 1, 3, 4, 5 and 7 Note that Landsat band 2 (green) is not used.
Mn= 0.055
Max= 0.3
Figure 5 shows the output of albedo map and Table 7 shows Classification of albedo and related value.

Figure 5: Albedo map of Istanbul, Turkey, 06 September 2015, WGS 84 UTM zone 36N
| Albedo Classification | Albedo Value |
|---|---|
| High albedo | 0.160-0.300 |
| Moderate albedo | 0.100-0.160 |
| Low albedo | 0.08-0.100 |
| Very Low albedo | 0.05-0.08 |
Table 7: Classification of albedo and related value.
Standard range value for feature albedo is: Asphalt = 0.04 -0.12, Sand = 0.15 -0.45, Thin cloud = 0.20-0.50, Grass = 0.16 -0.25, Water =0.03-010
Results and Discussion
According to the results and maps of above analysis, the mean temperature of the retrieved LST is 31.67°C, and the mean nearsurface air temperature is 29.43°C. The LST retrieving difference is about 2.24°C. On the other hand, to complement and find temperature difference between urban and rural area (UHI), temperature data of two Istanbul’s meteorological stations from 1912 and 1939 has been analysed. One of these stations is located in Central Business District (CBD) of the city (Kandilli) and the other one is located in rural area (Sile), (Figures 6 and 7). Comparison the average temperature data of these meteorological stations shows the amount of temperature difference and UHI of Istanbul and its range of increasing for 100 years. The Figure 8 shows the average temperature of Kandilli station, for 103 years which it shows the slope of increasing temperature. Moreover, Figure 9 shows the average temperature of Sile for 76 years. Because of the range of urbanization and land use changes in Sile is very slow, it can be seen the increasing slope of temperature is very low too. The results show that (Figures 8 and 9) for the first five years’ temperature difference increased from 5.7°C to 7.6°C. This was an increase of 1.9°C for the period. It dropped by 6.3°C in 1946. Over the next 14 years, there were fluctuations. It started decreasing from 1.8°C in 1961 but after that it increased to 0.5°C in 1975 and it reached to peak on 1990 by 8.4°C urban- rural difference after this highest difference the temperature difference decreased to 6.4°C in 2005. The highest temperature differences during last decade is 8.2 and 8.3°C occurred in 2007, 2015 and 2016, while the lowest one with 4.8°C occurred in 2011. It means that from 2011 forward there is higher intensity of UHI.

Figure 6: Location of Kandilli (urban) meteorological Stations in Istanbul (Google earth, 2015).

Figure 7: Location of Sile (rural) meteorological Stations in Istanbul (Google earth, 2015).

Figure 8: Analysis of the past 100 years’ weather data at Kandilli Station (Urban).

Figure 9: Analysis of the past 77 years’ weather data at Sile Station (Rural).
The distribution of urban heat islands in Istanbul due to the unsustainable urban planning and uncontrolled urban growth conclusions reached by policy makers who make urban strategies regarding rapid urbanization and passion for development, this LST belongs to September 6th of 2015 and based on that it will predicted that Istanbul will face an intense UHI effect in the future. In 2015 LST map of Istanbul, most of the districts and urban areas are experiencing a high UHI effect. The effect is more specified in the industrial areas like Tuzla, Sultanbeyli, Pendik, Kartal, Maltepe, Sancaktepe, Atasehir, Kagithane, Zeytinburnu and Bakirkoy (Ataturk airport area) (Figure 3). To analyse the effect of Land Use and Land Cover in formation UHI of Istanbul, the LULC map of the city is provided by categories of Water, Green land, Soil, Agriculture, Forest and constructed areas (Figure 10). Since the districts which are covered by dense constructed (urban) area with land uses of dense residential, commercial, high rises and factories with the least vegetation and green area; producing large amounts of heat and air pollution, their temper ature are higher compared with other districts in LST map (Figure 3).

Figure 10:LULC map of Istanbul, Turkey, 06 September 2015, WGS 84 UTM zone 36N.
By analyzing the above maps, the districts of Bakirkoy, Tuzla, Sultanbeyli, Bagcilar, and Pendik have a strong UHI intensity that their land uses are mostly industrial and two international airports of Istanbul (Ataturk International Airport at Bakirkoy and Sabiha Gokcen Airport at Pendik) are located in these areas. The surface temperature is higher than 35°C in Ataturk International Airport and higher than 39°C at Sabiha Gokcen Airport and their surrounding areas. The districts of Maltepe, Bakirkoy, Kartal, Sariyer, Kagithane, Sisli, Beyoglu, Gaziosmanpasa, Bagcilar, Zeytinburnu, and Gungoren all show higher temperatures because of locating in CBD and the higher density of urban construction, and urban infrastructure (streets, roads, highways, etc.). Due to the urban development strategies without environmental consideration, Istanbul has gained several new zones with different shape of urban designs. It is obvious in the LST map that the new residential areas (sprawl) have higher temperatures because of the high density of the buildings especially in Basaksehir, Cekmekoy, Atasehir, Sancaktepe, etc. In the other hand, Sultanbeyli, Esenler, and Beyoglu have dense buildings and high rises that cause higher temperatures and more UHI. The most densely populated parts of the city lie in the old core of the city and South along the Sea of Marmara. These areas have also high land surface temperature, Low albedo and very poor NDVI values with constructed LULC. The districts of Gaziosmanpasa, Catalca, and Silivri, which are located in the outer part of the city, have high surface temperatures with land cover of mines and land uses related to the mining. Agricultural fields are mainly located in Catalca, Buyukkilicli, Kestanelik, and Kartal that have high temperature values because of poor value of natural vegetation (NDVI) and mostly became vacant to reserve for future urban development. The districts of Beykoz, Sariyer, Arnavutkoy, Sile and Eyup include the last forest areas, which are mainly located in the northern, northern west and northern east parts of the city. These areas have lower surface temperature, low albedo and higher NDVI values, LST ranging between 17°C and 31°C.
Conclusion
However, it is not possible to prevent the uncontrolled and unplanned urbanization. This urbanization, in turn, causes an increase in the surface temperature of the areas having very high ecological value and also leads negative effects on natural resources. The clear observation in the surface temperature of Istanbul, which, is produced from Landsat 8 OLI satellite image (Figure 3), and albedo map together shows. The warm regions that, are represented by red, orange and yellow colours, are mostly located in the southern, western and old part of Istanbul where Central Business District (CBD) is located. High-density area and low vegetated are located in these areas respectively. In the other hand, in albedo map it can be seen that, the most built environment (urban area) has moderate albedo (over 90% of urban area). The northern parts of Istanbul are relatively cool with green colour in LST and NDVI map also in albedo map; it can be seen low and very low albedo materials in the north. This is due to the concentration of greenery and water bodies as well as less impact from the densely placed urban developments. The clear temperature boundary observed from the image is relevant to the current land use distribution. The temperature difference between urban and rural areas, which is close to 11°C, hints at the prevalence of the UHI effect in Istanbul. Based on results of this study, it is clear that vegetated, water and high albedo areas have important roles in prevention of increased UHI effect in Istanbul. Urban green areas (vertical or horizontal) should be planned and protected more seriously in future of urban planning strategies and urban development. Urban development planning models without considering to their effects on UHI and temperature of the city will have negative impacts on urban quality of life and health of its citizens, in order to mitigating these negative impacts, there is an emergent need to develop an efficient management strategy for protecting the natural vegetation areas. In Istanbul left vegetation areas, should be protected in the other hand the walls, roofs and open lands are potential for being green, using high albedo materials in new buildings is another sustainable strategy to mitigate UHI effects in Istanbul.
References
- Santamouris M (2001) The role of green spaces. Energy and climate in the urban built environment pp: 145-159.
- Rushtone (2001) Low-impact parking lot design reduces runoff and pollutant loads. J Water Resour Plan Manage pp: 172-179.
- Brattebo BO (2003) Long-term stormwater quantity and quality performance of permeable pavement systems. Water Research 37: 4369-4376.
- Gartland LM (2012) Heat islands: Understanding and mitigating heat in urban areas. Routledge.
- Li JJ (2009) Remote sensing evaluation of urban heat island and its spatial pattern of the Shanghai metropolitan area, China. Ecological Complexity 6: 413-420.
- Celikoyan TM (2004) Monitoring and analysis of land use changes in historical periods for the city of Istanbul by means of aerial photography and satellite imagery. Istanbul: Doktora Tezi, İTÜ Fen Bilimleri Enstitüsü.
- Inceoglu A, Yurekli I (2011) Urban transformation in Istanbul: potentials for a better city. In: Enhr Conference, Istanbul pp: 5-8.
- Lemonsu A, Viguié V, Daniel M, Masson V (2015) Vulnerability to heat waves: Impact of urban expansion scenarios on urban heat island and heat stress in Paris (France). Urban Climate 14: 586-605.
- Lillesand T, Kiefer RW, Chipman J (2014) Remote sensing and image interpretation. John Wiley & Sons, NY, USA.
- hahmohamadi P, Che-Ani AI, Etessam I, Maulud KNA, Mohd-Nor MFI (2010) Conflict between population and urbanization factors: Impact of urban heat island on energy consumption balance. Journal of Civil Engineering 4: 35.
- Schaaf CLB, Liu J, Gao F, Strahler AH (2011) MODIS albedo and reflectance anisotropy products from Aqua and Terra. Land Remote Sensing and Global Environmental Change: NASA's Earch Observing System and the Science of ASTER and MODIS, Remote Sensing and Digital Image Processing Series 11:Â 873.
- Schaaf CB, Cihlar J, Belward A, Dutton E, Verstraete M (2009) Albedo and reflectance anisotropy. ECV-T8: GTOS assessment of the status of the development of standards for the terrestrial essential climate variables. FAO, Rome.
- Barnes CA, Roy DP (2010) Radiative forcing over the conterminous United States due to contemporary land cover land use change and sensitivity to snow and inter annual albedo variability. J Geophys Res: Bio Geosciences p: 115.
- Flanner MG, Shell KM, Barlage M, Perovich DK, Tschudi MA (2011) Radiative forcing and albedo feedback from the Northern Hemisphere cryosphere between 1979 and 2008. Nature Geoscience 4: 151-155.
- Myhre G, Stordal F, Johnsrud M, Diner DJ, Geogdzhayev IV, et al. (2005) Intercomparison of satellite retrieved aerosol optical depth over ocean during the period September 1997 to December 2000. ‎Atmospheric Chem Phys 5: 1697-1719.
Citation: Zaeemdar S, Baycan T (2017) Analysis of the Relationship between Urban Heat Island and Land Cover in Istanbul through Landsat 8 OLI. J Earth Sci Clim Change 8: 423. DOI: 10.4172/2157-7617.1000423
Copyright: © 2017 Zaeemdar S, et al. This is an open-access article distributed under the terms of the Creative Commons Attribution License, which permits unrestricted use, distribution, and reproduction in any medium, provided the original author and source are credited.
Select your language of interest to view the total content in your interested language
Share This Article
Recommended Journals
Open Access Journals
Article Tools
Article Usage
- Total views: 10980
- [From(publication date): 0-2017 - Nov 10, 2025]
- Breakdown by view type
- HTML page views: 9750
- PDF downloads: 1230