Research Article Open Access
Automatic Extraction of Facade Details of Heritage Building Using Terrestrial Laser Scanning Data
| Kenza Ait el Kadi1*, Driss Tahiri2, Elisabeth Simonetto3, Imane Sebari4 and Hakim Boulaassal5 | |
| 1IAV Hassan II institute, Rabat, Morocco-6202 | |
| 2Professor, Department of Photogrammetry, IAV Hassan II Institute, Morocco-6202 | |
| 3Assistant Professor, School of Land Surveyors Le Mans, France, 72000 | |
| 4Assistant Professor, Department of Photogrammetry, IAV Hassan II Institute, Morocco-6202 | |
| 5Assistant Professor, University of Science and Technology, FST, Morocco-416 | |
| *Corresponding Author : | Kenza Ait el kadi IAV Hassan II institute, Rabat, Morocco-6202 Tel: +212 37 77 17 45 E-mail: k.aitelkadi@gmail.com |
| Received July 24, 2014; Accepted October 25, 2014; Published November 03, 2014 | |
| Citation: Aitelkadi K, Tahiri D, Simonetto E, Sebari I, Boulaassal H (2014) Automatic Extraction of Facade Details of Heritage Building Using Terrestrial Laser Scanning Data. J Archit Eng Tech 3:133. doi:10.4172/2168-9717.1000133 | |
| Copyright: © 2014 Aitelkadi K, et al. This is an open-access article distributed under the terms of the Creative Commons Attribution License, which permits unrestricted use, distribution, and reproduction in any medium, provided the original author and source are credited. | |
Visit for more related articles at Journal of Architectural Engineering Technology
Abstract
The Terrestrial Laser Scanning (TLS) has become an interesting technology in various fields. The architecture and heritage fields benefit more and more of this technology. In the heritage field, TLS data and derived products are used to complete the digital archive of cultural sites all over the world. Among these cultural sites, we deal with the historical Moroccan sites, especially the old Medina. The rehabilitation of the old Medina requires the reconstruction of facade planes. For that purpose, Moroccan authorities need a precise inventory of all facades. The planes extracted from 3D point cloud provide the desired results. However, the manual process is too long and sometimes difficult. Automatic methods of plane recognition including the point cloud segmentation are generally based on geometric approaches which fail to identify some facade details of such heritage buildings. In this context, we propose a new automatic approach of point cloud segmentation. This approach relies on all the components of a colored point--both geometric and radiometric--combining the RGB values, laser intensity and geometric data. Our approach also includes a new method to filter the segmentation result through Delaunay triangulation. The last step of our processing is the facade and detail contour detection that is based on alpha-shape algorithm to find interior and exterior boundaries. Experiments are performed on facades presenting an example of old Medina architecture located in Casablanca’s Medina. Results show the importance of integrating all point cloud components for the detail facades extraction and planes establishment.
| Keywords |
| Heritage building; Terrestrial laser scanning; Segmentation; Contour detection |
| Introduction |
| The automatic production of 3D CAD (Computer Assisted Design) of building facade includes several steps of processing from 3D point cloud. It starts with the segmentation operation that aims at extracting the facade from the point cloud. The facade generally consists in one main plane. Segmentation allows the definition of a main plane and points belonging to this plane. This result can first be filtered to reduce noise and then is used to delimitate the facade edges. However, the difficulty for an automatic recognition is the presence of several other objects such as shutters, doors, windows or balconies. Nevertheless, the segmentation result will greatly influence the accuracy of the final model. |
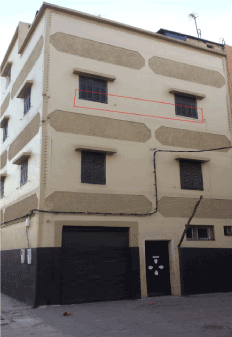
| Segmentation usually means partition of space into characteristic regions according to some homogeneity criteria. Several segmentation approaches are based on geometric criteria, either through constraints of point co-normality and co-planarity or through the recognition of geometric shapes. When we examine a building facade, one can be aware that geometrical considerations facilitate the identification of its geometric components. This, at least, enables the segmentation of facade, characterized by well-defined primitives, thanks to plane recognition algorithm. However, when the architectural configuration presents several details in a same plane such as the window shutters or doors, the geometric information is not sufficient to separate the different parts from the point cloud. Such configuration characterizes a majority of old Medina buildings. Figure 1 shows an example of the most common architecture of buildings in Casablanca old Medina. The red frame drawn on Figure 1 is a concrete example where an extraction only based on geometric information will fail to discriminate the wall from the window shutters. |
| For these reasons, we propose a new approach that takes into account these characteristics. Besides, the method is adapted both for structured point clouds acquired in the static framework and for unstructured point clouds resulting from a mobile terrestrial acquisition. Then, we propose a method to reduce noise before producing the internal and external boundaries of facade detail. |
| Related Work |
| In the literature, several approaches for segmentation and contour detection leading to the 3D CAD model of building have been proposed. Concerning the segmentation process, two categories of methods can be distinguished. The first one is the aggregation of points into segments according to certain homogeneity criteria. The second one defines the best fitting primitives to a point cloud. The first class is limited in the case of unstructured point clouds. For example, the region growing algorithm is influenced by the presence of noise at the identification of the seed surface and the growing phase [1,2]. The clustering principle requires important computational time for multi-dimensional data (3D) and is also sensitive to noisy data [3]. Segmentation by means of profiling technique also presents some limitations and is not appropriate to unstructured data characterized by varying densities [4]. |
| The second category is reliable even in the presence of a high proportion of noisy points. However, they show other kinds of problems. In the literature, two pattern recognition algorithms are often used in the context of point clouds: the Hough transform and the RANSAC (Random Sample Consensus) paradigm. The Hough transform has the drawback to be time-consuming [5]. The RANSAC approach is less efficient when points belonging to two adjacent planes are associated too early with the first defined plane [6,7]. Moreover, in the architectural field, details cannot always be modelled into easily identifiable geometrical shapes. Besides, if some entities can be characterized by geometric properties, others are more readily distinguished by their color content [8]. |
| So, the proposed segmentation approach combines both fitting and aggregation, using geometric and radiometric criteria. The regions obtained from the segmentation result are affected by some set of points that are called here “noisy connected components”. These points are due to linear errors and surface defects. They will distort the results of contour detection and modelling. To delete these components, some authors convert the segments into image and use some image processing filters to separate noise points from surface inliers [7]. However, in our case, available data are only the point cloud and its characteristics. For this purpose, we develop an algorithm for suppressing the noisy connected components based on the Delaunay triangulation. |
| The final step of the CAD model is to define the surface contour. There are many possible techniques which can be classified as geometric, statistical, or topological approaches [9]. In this work, we have considered geometric solutions. Most feature line extraction algorithms rely on a triangular mesh as input. They consider the problem of computing the shape as a generalization of the convex hull of planar point set [10,11]. In [12], the authors recommended the use of the Delaunay triangulation. Among the algorithms based on the Delaunay triangulation, we also find the alpha-shape family [13]. In [14,15] the roof shapes from airborne LIDAR data are vectorised with the alpha-shape method. Alpha-shape is an n-dimensional simplex. The level of detail of the shape depends on the choice of alpha that is the radius of a sphere that can occupy a space without enclosing any point of the point cloud. Then, in our work, the alphashape is used for the contour definition. It means that we assume that the desired reconstruction is provided by a set of simplices from the three-dimensional Delaunay triangulation that verify some topologic condition in term of alpha [16,17]. |
| We will now detail the method in part 3 and present some results and discussion in part 4 and 5. |
| Methodologies |
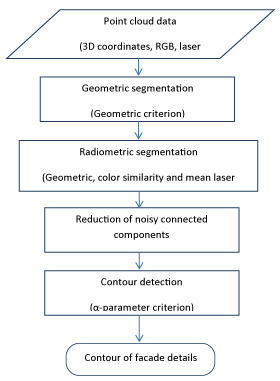
| Our methodology contains four main steps: Geometric process, radiometric process, reduction of noisy connected component and contour detection. The following figure presents flowchart of the proposed methodology (Figure 2). |
| Segmentation |
| We present in this paper a new approach which benefits from the wealth of the point cloud information by combining geometric and radiometric aspects in order to segment facades. These facades have an architecture that merges to the same geometric plane other components [18]. |
| Let us note PTS={p1, p2… pm} the set of laser points. The first step based on geometric criteria leads to a set of planes, ΣSPi = {SP1, SP2, …, SPn}. Each plane is processed by adopting criteria based on color homogeneity, namely the RGB color similarity. Segmentation errors due to the brightness variations in RGB data are corrected according to a criterion based on the laser intensity similarity. We obtain at the end of the process homogeneous regions in terms of point co-planarity and radiometric similarity: ΣΣSPij = {SPi1, SPi2,.., SPik}. We now detail these steps. |
| Geometric processing: Our approach relies on the RANSAC paradigm (to recognize geometric shapes from a set of points, despite the presence of noise and outliers. It is used during two distinct steps to: |
| ✔ distinguish the facade plane containing a maximal number of points compared to other details (tree, fountain, grass, etc.). These details are not interesting for our study. |
| ✔ extract main and secondary planes on the facade. |
| The RANSAC algorithm is iterative. The recognition begins with the random sampling of a minimal number of points to estimate the parameters of the shape model. The set of points lying below a certain distance from the model are appointed inliers while the rest of the points are considered as outliers. In the case of simple facades, the geometric shape is the plane and requires a minimum of three points for its estimation. The RANSAC approach uses the geometric components (X, Y and Z coordinates). Let us note ESS the subset of three random coplanar and non-collinear points from PTS: ESS={p1, p2, p3}. The three randomly selected points are used to estimate the parameters of the mathematical plane model, M, defined as follows: |
| M=a1X + a2Y + a3Z + a4 (1) |
| Where (a1, a2, a3) : the normal vector. |
| a4: the distance of the plane to the coordinates system origin. |
| Using the Euclidean distance of the point p to the model M, we can define the Consensus Set (CS). This set presents all points that are close enough to the estimated model M (ESS). The authorized maximal distance to the model is controlled by a threshold, named ds. The cardinal of CS represents the number of points considered as inliers: |
| Card(CS)={p ∈ PTS/ dist(p, M(ESS)) ≤ ds} (2) |
| Computational time depends on the number, N, of iterations required finding the best theoretical plane [17] and the size of the point cloud. The facade main plane is defined as the plane which contains a maximal number of inliers. Secondary planes are obtained in a second RANSAC process considering previous outliers and an adapted coordinate system [18]. The result is then a set of planes, ΣSPi. |
| Radiometric processing: The second step is the segmentation of each extracted plane to recognize facade details. These details are contained in a same plane. Our segmentation approach is based on region growing algorithm. The process begins with the identification of a seed point and evolves with respect to its neighbors to define a homogeneous region (si) checking a predicate (Pr). It relies on the verification of constraints such as a limited radiometric variance or the radiometric similarity with the seed point. The segmentation operation, ΘSPi, of SPi segment produces a set of homogeneous regions ΣSPij. These regions respect predefined criteria. Also each point can belong to only one region. |
| As RANSAC paradigm, the region growing algorithm is an iterative process. It is performed in three steps: |
| • Randomly select a seed point from the point cloud related to SPi, |
| • Growing the seed point to initial, |
| • Seed surface, |
| • Growing the seed surface to a homogeneous area. |
| The growing of the seed point to a seed surface depends on the verification of a geometric criterion and a radiometric one. |
| ✔ The geometric criterion |
| To define an initial seed surface we should verify the distance of candidate point to the growing spherical neighborhood centered on the seed point. The radius r of the initial seed surface should be inferior to threshold td. The geometric criterion prevents the detection of initial seed plane in sparsely distributed points as it adapts the area of interest according to the point density. This situation can be avoided using threshold value td. The initial seed surface is accepted only if the following criterion is satisfied. |
| ✔ The color homogeneity criterion |
| The distance between the seed point RGB color and the RGB mean color (gravity center) of the initial seed surface is small enough: Simco1 <tr. Simco1 is the Euclidian distance in the RGB color space and tr is a threshold. The color variance (var) of the seed surface is small enough: var <Vr. Vr is a threshold. |
| var=(VR+ VG+VB) (3) |
| Where VR, VG and VB are the empirical variances of each color component of the initial seed surface. |
| Once acceptable seed surface is detected, the region growing process starts with respect of the color similarity measurement. The use of a seed surface, instead of a seed point makes the seed selection more robust. The color homogeneity criterion is the similarity measurement computed in the RGB color space, Simco2<tr2. Here, the use of the previous geometric constraint is not significant since we cannot predict the spatial distribution of a homogeneous region. |
| The obtained segmentation presents some errors due to the brightness variation in RGB colors along the facade, mainly due to illumination condition and shadow effects. In order to correct these errors, we suggest using the laser intensity that is not sensitive to illumination conditions since laser scanner is an active sensing system. This phase consists in the fusion of similar segments. Here, the similarity is measured through the difference between the laser intensity averages of each region. The fusion is accepted if the difference is inferior to a threshold, f. |
| Contour detection |
| The contour detection is performed on each extracted plane. It leads to a vector description of the facade. |
| Reduction of noisy connected components: Before proceeding to contour detection, an intermediate step is necessary because the segmentation result presents some small and distant clusters of points. These ones will distort the contour detection result. They are named here ‘noisy connected components’. To reduce them, we adopt a new approach which is based on the distribution and the spacing of points. Indeed, each resulting segment presents a class of facade details and another class of noisy points. The characteristics of the first class are the high density of points and the short distance between each point and its neighborhood. In the second class, we find either aggregations of spaced points or isolated points remote from details. To distinguish the second class, we use the Delaunay triangulation result where we remark a significant variation of number and size of triangles associated to the noisy points or vertex. |
| The second class is associated to several large triangles. The spaced noisy points are also attached to more triangles than the inliers points. Thus, we can define criteria according to the number and the surface of triangles. |
| ✔ Triangle Surface (TS)>δ |
| ✔ Triangle Number (TN)>η |
| Where, |
| δ: threshold on the surface of a triangle whose point is a vertex. The value should be superior to the mean surface of triangles set which is more influenced by the small triangles. |
| η: threshold on the numbers of triangles whose point is a vertex. |
| The process is iterative. Each iteration reduces the points constituting the noisy connected components. |
| Contour detection: The output of filtered clusters is used as input data of the contour detection processing. Our work exploits an alpha-shape algorithm to detect the boundaries of facade details. The definition of alpha-shape has been presented by Edelsbrunner and Mücke. Alpha-shape exploits the result of Delaunay triangulation. The principle of alpha-shape algorithm is to excavate the convex hull of a sample of points using a ball. This ball is naturally empty and the simplices forming the alpha-shape boundaries are among the Delaunay simplices. |
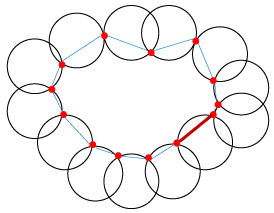
| Let S be the set of points without any degenerate configuration (as defined in the Delaunay triangulation). The alpha-parameter (α) controls the level of detail reflected by the shape around S-set. This parameter can be set via suitable operator input device or can be calculated based on the ideal value of α. In the Delaunay triangulation, an edge is defined by connecting a straight line between two points p and q if and only if p and q are Voronoi neighbor points (Figure 3). |
| The alpha-shape boundary of S on Figure 3 is indicated by the solid line. When α value is large (the extreme being the radius of the largest enclosing circle of a point set), the alpha-shape is rather crude. As α decrease, the alpha-shape shrinks and eventually develops cavities or voids in the triangulation. When α becomes zero, no triangles are filled. In this case, all points are isolated. Naturally, changing the value of α will change the set of points that are alpha-extreme. |
| ✔ If α = 0, it is a point; |
| ✔ If α > 0, the a-shape is the graph whose vertices are a-extreme; |
| ✔ If α tends to ∞, it is a convex hull. |
| To approximate the real contours of facade details, the value of α should be lower than radius of circumscribed circles of free boundary triangulation facets. |
| Results |
| Experimental data |
| The buildings have been scanned by a TLS FARO Focus 3D. The scanner range reaches 120 m indoor or outdoor with low ambient light and normal incidence to a 90% reflective surface. Its accuracy is 2 mm for a distance of 10 m. This system is equipped with a camera. The integrated color camera delivers 70 megapixels of photorealistic color data. The RGB colors are coded with 8 bits [0–255] and the laser intensities on 10 bits [-1024–1023]. |
| Segmentation results |
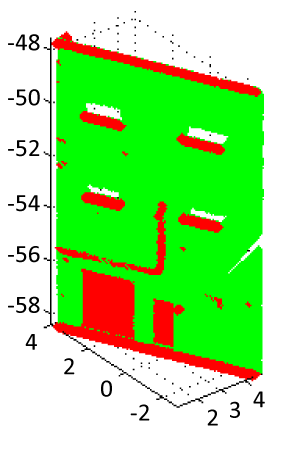
| The segmentation process requires the thresholds determination. During the geometric processing, the ds-threshold determines inliers and outliers of the RANSAC algorithm. Its choice depends on the characteristics of the facades to be segmented. For example, in the case of walls, ds-value depends on wall planarity, which reflects the level of perfection of the building construction. ds also depends on modelling objectives. The basic reconstruction of a building requires wider values. On the other hand, if the purpose is the verticality control, the choice should be more accurate and sometimes variable from a zone to another. Our objective is limited to the original building architecture recognition. The definition of an optimal threshold is difficult. Here the choice of ds is heuristic in order to avoid over-segmentation and subsegmentation. We have chosen ds=0.05 m (Figure 4). |
| During the radiometric processing of the segmentation step, four thresholds are chosen: td, tr and Vr for seed surface delineation, and tr2 for initial seed surface growing. Each threshold depends on the data: |
| • Radius td for seed surface selection should be set so as to avoid the aggregation of distant points and the selection of seed surface on sparsely distributed regions. |
| • Thresholds tr and Vr are influenced by maximum color distance of a point to the mean of the corresponding region. |
| • Color distancetr2should be higher than tr since the color variation could increase when we observe details of the facades. The values oftr2exceed also the average of color difference of same region. |
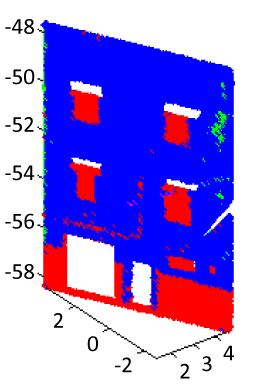
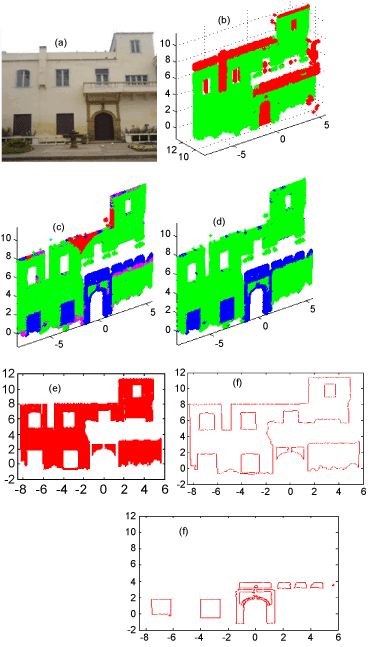
| In this work, the values of these thresholds have been chosen by the visual examination of intermediate results. In spite of various trials, the shadow and illumination conditions induce unexpected RGB variations, which cause over-segmentation. In most cases, it will be difficult to find suitable thresholds, especially with large variation of brightness. Furthermore, decreasing the threshold values produce remarkable defects and over-segmentation. We have fixed manually the following thresholds: td=0.2 m, tr=30, Vr=200 and tr2=60. The result of the region growing algorithm presents 8 planar segments. Six regions resulting from the color segmentation corresponds to the wall. The two remaining regions contain the window shutters and a rectangular segment associated to the door frame and garage. The Figure 5 presents the segmentation after adding color similarity criteria. In this figure, segments with few numbers of points cannot be visualized (Figure 5). |
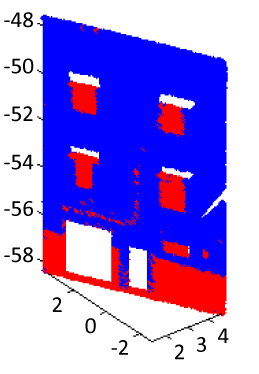
| To correct the brightness variation effect, we introduce the laser intensity value as explained in part 3.1.2. In this step, we merge all regions that have similar laser intensity values. It requires a laser intensity similarity threshold, f. The threshold should be chosen according to the degree of intensity variation of the obtained regions. The wall region has an important value of laser intensity (1022). The others regions have a less level of intensity (700). The result shows an adjustment of previous imperfections. Indeed, the six regions corresponding to the wall are merged and the two others (shutters and door frame and garage) are also associated. The number of regions is reduced from 8 down to 2 (Figure 6). |
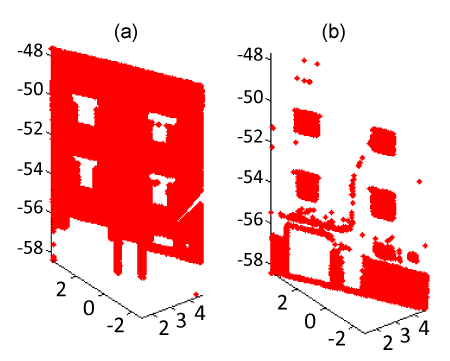
| At the end of segmentation process, we obtain two regions belonging to the same plane but presenting different details. Figure 7 presents the regions after the complete segmentation process. |
| Contour detection result |
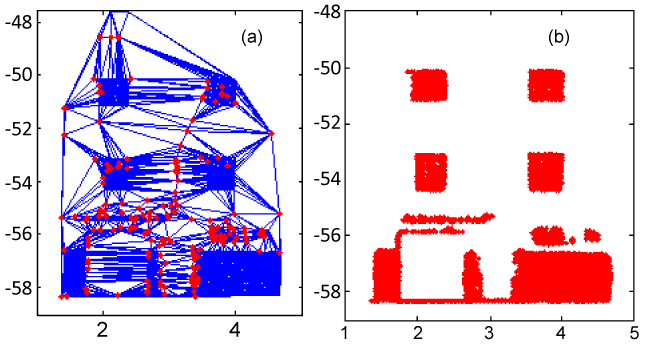
| The segmentation result isolates the window shutters and the rectangular segment of the wall plane. We note that the two obtained regions, especially the one of windows and shutters, are characterized by noisy connected components. To reduce them, the Delaunay triangulation is computed and the noise filtering as explained in part 3.2.1 is applied. It is based on two thresholds, δ and η. Their values depend on the spatial distribution of connected components, level of noisy points and their distance from details. The value of δ depends also on the proportion of large triangles compared to small triangles. Generally, three percent of the triangles have surface superior than average. Also, the noisy points are at least attached to five triangles. Thus, for three different data, the retained values are δ=3*m where m is the mean surface of triangles in the Delaunay triangulation and η=5. The iteration number depends on the number of noisy components we want to remove. To obtain the result presented on the Figures 8 and 10 iterations were needed (Figure 8). |
| Then, the detail level of the contour detection depends on the input alpha-parameter. Here, the value of α is chosen so that the extracted contour closely approximates the wireframe model of the points cloud (Figure 9). |
| This method of segmentation and contour detection has been tested on four building facades of Casablanca old Medina. Figure 10 presents an example of result tested on the former residence of general Lyautey. The former residence of the Medina of Casablanca is more than 100 years old. This heritage building has similar architectural characteristic than the discussed example (Figure 10). |
| Results evaluation |
| To evaluate the quantitative results of our automatic process, we produce a manual extraction and measured some 19 lengths. The values obtained with manual process are compared to the lengths found by the automatic extraction of details. The presented measures are those of the former residence of general Lyautey since it allows us to extract several details (window shutters, frame of door and door). Table 1 shows the difference between manual and automatic measures. |
| The mean difference is 4 mm with a standard deviation about ± 6 mm. These measurements are higher than the point cloud accuracy that is 2 mm. This difference can also be due to the difficulty of pointing the real corner of a detail. Our approach has been tested on four other facades of the old Medina with architecture similar to the residence. It had led to similar results. |
| Discussion |
| The process developed in this work allows automatic detection of facade details of heritage buildings. The contour extraction is mainly conditioned by the segmentation step. The segmentation result may be adjusted by reducing the noisy connected components. The aim is to define the contours of the details that will fit in our future work to establish 3D architectural model. |
| In the specific architecture of the old Medina buildings, we find more details in a same plane. In this context, a new segmentation strategy is developed by integrating geometrical, color and laser intensity information in a single step process. The geometric process provides interesting results if we decide to extract spaced planes. However, the defect of facades planarity generates a thickness for each plane. This thickness makes difficult the extraction of details from the same plane. The weakness of the geometric criterion is overcome by adding radiometric components. The radiometric process allows separating details. The product is improved compared to geometric result in spite of over-segmentation caused by light and shadow variations. The approach corrects the obtained color regions by merging those with similar laser intensities. |
| The final result of the segmentation presents classes of noisy connected components whose importance depends on the threshold segmentation. The timeliness and filtering efficiency based on the Delaunay triangulation led to recovery of the input data for contour detection of facade details. |
| The steps of the process depend on a number of thresholds. In our case, the thresholds have been determined by empirical tests. Indeed, in the context of this work, each threshold is identified according to the data. The geometric threshold depends on the perfection of the facades planarity. The RGB threshold depends on the color difference between the details of main plane and also of the arbitrary brightness distribution. Concerning the laser intensity threshold, it refers to the type of material and color clarity. During, contour detection, the alpha-parameter is a function of point’s density. Several threshold values were tested; those who have been adopted are the thresholds that have provided us the best results in terms of visualization, number of connected components and quantitative evaluation of contour measurements. Thus, the methodology can be transferable to other cases, but by adopting suitable thresholds according to data characteristics. |
| The quantitative evaluation of the results obtained from the tested data validates the reliability of facade details extraction that integrates all the components of the point cloud for 3D building modeling of this specific architecture. |
| Conclusion |
| The main purpose of this paper is to describe a novel approach used in computer vision for automatic extraction of 3D (CAD/vector) model of cultural heritage building from a LIDAR point cloud. Our approach is a solution to extract facade details even if they are in the same plane using all the components of terrestrial laser scanning data. In our work, the radiometric information is complementary to the geometric data during the first segmentation step. Then, the facade contour is detected using the alpha-shape algorithm. The process is very fast but the accuracy of the result depends on the value of different thresholds. The following step will be to adjust the raw plane. The final product allows the storage of the architectural planes of the patrimonial buildings of the old Medina. These archives will facilitate the rehabilitation of heritage sites as well as the maintenance of prominent work-of-arts in compliance with the requirements of the Culture Ministry and the urban agencies. |
| References |
References
- Pu S, Vosselman G (2009) Building facade reconstruction by fusing terrestrial laser points and images. Sensors, 9: 4525-4542.
- Pu S, Vosselman G (2006) Automatic extraction of building features from terrestrial laser scanning. International Archives of Photogrammetry, Remote Sensing and Spatial Information Sciences, Dresden, Germany. 33-39.
- Filin S (2002) Surface clustering from airborne laser scanning data. International Archives of Photogrammetry, Remote Sensing and Spatial Information Sciences, Graz, Austria. 119-124.
- Mapuris WT, Sithole G (2012) 3D Object Segmentation of point clouds using profiling techniques. South African Journal of Geomatics, 1: 60-76.
- Borrmann D, Elseberg J, Lingemann K, N√?¬ľchter A (2011) The 3D Hough Transform for Plane Detection in Point Clouds: A Review and a new Accumulator Design. 3D Research. 2.
- Boulaassal H, Landes T, Grussenmeyer P (2009) Automatic Extraction of Planar Clusters and their Contours on Building Facades Recorded by Terrestrial Laser Scanner. International Journal of Architectural Computing, 7:1-20.
- Boulaassal H (2010) Segmentation et mod√?¬©lisation g√?¬©om√?¬©triques de fa√?¬ßades de b√?¬Ętiments √?¬† partir de relev√?¬©s laser terrestres. PhD. INSA Strasbourg.
- Barnea S,Filin S (2013) Segmentation of terrestrial laser scanning data using geometry and image information. ISPRS Journal of Photogrammetry and Remote Sensing: pp. 33-48.
- Wang Y, Gao J (2006) Boundary recognition in sensor networks by topological methods. MobiCom√ʬ?¬?06, Proceedings of the 12th Annual International Conference on Mobile Computing and Networking, ACM.
- Stylianou G, Farin G (2003) Crest lines extraction from 3D triangulated meshes. Hierarchical and geometrical methods in scientific visualization. 269√ʬ?¬?81.
- Jarvis RA (1977) Computing the shape hull of points in the plane. In proceeding Computing Society Conference on Pattern Recognition and Image Processing. 231-241.
- Boissonnat JD (1984) Geometric structures for three dimensional shape representation. ACM transactions on Graphics. 3:266-286.
- Edelsbrunner H,M√?¬ľke EP (1994) Three-dimensional alpha shapes. ACM Trans. Graph 13:43-72.
- Demir N, Baltsavias E (2012) Automated modeling of 3D building roofs using image and Lidar data. ISPRS Annals of the Photogrammetry, Remote Sensing and Spatial Information Sciences, Melbourne, Australia.
- Xiao Y, Wang C, Xi XH, Zhang WM (2014) A comprehensive framework of building model reconstruction from airborne LIDAR data. 35th International Symposium on Remote Sensing of Environment, IOP Conf. Ser.: Earth Environ. Sci.
- Fischlerand MA, Bolles RC (1981) Random Sample Consensus: A Paradigm for Model Fitting with Applications to Image Analysis and Automated Cartography, Comm. Of the ACM. 24: 381√ʬ?¬?395
- Hartley R, Zisserman A (2003) Multiple view geometry in computer vision. Cambri dge University Press. 2nd Edition: 170-178.
- Aitelkadi K, Tahiri D, Simonetto E, Sebari I, Polidori L (2013) Segmentation of heritage building by means of geometric and radiometric components. ISPRS Annals of the Photogrammetry, Remote Sensing and Spatial Information Sciences. 1-6.
Tables and Figures at a glance
| Table 1 |
Figures at a glance
 |
 |
 |
 |
 |
| Figure 1 | Figure 2 | Figure 3 | Figure 4 | Figure 5 |
 |
 |
 |
 |
 |
| Figure 6 | Figure 7 | Figure 8 | Figure 9 | Figure 10 |
Relevant Topics
- Architect
- Architectural Drawing
- Architectural Engineering
- Building design
- Building Information Modeling (BIM)
- Concrete
- Construction
- Construction Engineering
- Construction Estimating Software
- Engineering Drawing
- Fabric Formwork
- Interior Design
- Interior Designing
- Landscape Architecture
- Smart Buildings
- Sociology of Architecture
- Structural Analysis
- Sustainable Design
- Urban Design
- Urban Planner
Recommended Journals
Article Tools
Article Usage
- Total views: 14888
- [From(publication date):
December-2014 - Aug 24, 2025] - Breakdown by view type
- HTML page views : 10192
- PDF downloads : 4696
