Research Article Open Access
Climate Change in Chile: An Analysis of State-of-the-Art Observations, Satellite-Derived Estimates and Climate Model Simulations
Charles JR Williams*
Department of Meteorology, Room 2U18, Walker Institute, University of Reading, Earley Gate, UK
- *Corresponding Author:
- Charles JR Williams
Department of Meteorology
Room 2U18, Walker Institute
University of Reading, Earley Gate, UK
Tel: +44 0118 378 5586
E-mail: C.J.R.Williams@reading.ac.uk
Received Date: November 22, 2016; Accepted Date: May 02, 2017; Published Date: May 08, 2017
Citation: Williams CJR (2017) Climate Change in Chile: An Analysis of State-ofthe- Art Observations, Satellite-Derived Estimates and Climate Model Simulations. J Earth Sci Clim Change 8:400. doi: 10.4172/2157-7617.1000400
Copyright: © 2017 Williams CJR. This is an open-access article distributed under the terms of the Creative Commons Attribution License, which permits unrestricted use, distribution, and reproduction in any medium, provided the original author and source are credited.
Visit for more related articles at Journal of Earth Science & Climatic Change
Abstract
Although there is a reasonably large body of work focusing on South American climate, few studies focus on just Chile and even fewer consider climate processes operating over longer timescales, such as those at which climate change becomes apparent.
This paper provides an overview of Chilean present-day and future climate, needed to plan for potential impacts of climate change. Firstly, present-day climate conditions are assessed using a number of observational rainfall and temperature datasets. All available GCMs are then examined, to firstly assess their ability to simulate climate during the end of the 20th century and secondly to examine their projections during the 21st century.
The results of the present day analysis show a showing general agreement in spatial and temporal patterns of rainfall and temperature, between the datasets. When assessing the models’ ability to simulate observed rainfall and temperature, the results suggest that although the majority captures the spatial and temporal patterns, there are significant differences between models. When assessing future projections, the results suggest that over the next ~30 years, most GCMs show either no change in rainfall or a small reduction; however there is a lack of agreement regarding the sign of change, suggesting high uncertainty. For temperature, most models agree on a warming trend. This is also true for the longer-term, with most GCMs suggesting a small rainfall decrease by 2100 but a large temperature increase. Lastly, it is suggested that this temperature increase is due to an increase in minimum temperatures, which may have implications for certain frost-sensitive crops.
Keywords
Rainfall and temperature variability; Climate modeling; Climate change; Chile
Introduction
To date, although numerous studies exist on synoptic scale weather and climate variability over South America as a whole, relatively few focus on just Chile and even fewer consider longer (e.g. climate change) timescales. A comprehensive review of the current state-of-the-art for observational, satellite-derived and climate model data across Chile is currently lacking, and is a knowledge gap which this paper aims to fill. Climatologically speaking, Chile is a vast and diverse country with climate zones ranging from an extremely dry North to an extremely wet South. Meridionally, Chile spans over 38° of latitude or approximately 4,300 km, whilst at the same time being no more than 350 km in the East-West direction at its widest point. Chile’s relatively small zonal extent means its width is often much less than a standard global climate model (GCM) grid box, and the steep topography within this zonal extent (going from sea level to over 6000 m) is often not well represented in models [1].
Given the focus of this study on climate change timescales, as well as the spatial resolution of current state-of-the-art models, synoptic scale processes are not discussed here. On monthly or seasonal timescales, Chilean rainfall is controlled by the interaction of the ITCZ (and associated rain-belt) with larger-scale processes e.g. the South Pacific High. For central Chile, the majority of rainfall (on average 350 mm year-1) occurs during the winter months of April to September (and specifically during June-August), when the South Pacific High is at its most northerly latitude, allowing the passing of extra-tropical fronts and bringing rainfall [2,3]. There is also a strong seasonal cycle in temperature over central Chile, again linked to the annual cycle of incoming solar radiation [4]. A full review of the various climatological mean fields across South America as a whole is given by Garreaud [5] where, for example, they show that in January the winds are westerly at the southern tip of Chile before becoming southerly and flowing up the entire Chilean coast, whereas in July the southerly flow is weakened [5].
On inter-annual timescales, rainfall in central Chile varies greatly and ranges from between 100-700 mm year-1 in Santiago; this variability is strongly linked to ENSO [1,2]. Broadly speaking, during warm ENSO (El Niño) events Chile (and particularly the central region) experiences conditions that are wetter than normal during winter months, attributed to a higher than normal frequency of atmospheric blocking episodes in the southeast Pacific at mid-latitudes [3,6-8]. This is because during El Niño events the South Pacific High is weaker and located further north than its usual position, due to an SST-induced change to the larger scale Walker cell circulation [9]. The main impact of these wetter than normal conditions is flooding, often worst during subsequent spring and summer months because of increased river discharge as a result of the increase in wintertime rainfall (and therefore snow accumulation) over the Andes [3]. For southern Chile, interannual rainfall variability is mainly linked to the Antarctic Oscillation (AAO), which is characterized by pressure anomalies of one sign over the Antarctic and the opposite sign at around 40-50°S [10,11]. On even longer (decadal and interdecadal) timescales, rainfall variability over Chile (and South America as a whole) is thought to be linked to the Pacific Decadal Oscillation (PDO), which is a long-lived pattern of SST variability in the North Pacific [5,12,13].
Concerning climate change, the 20th century has seen a small but long-term decrease in rainfall over northern Chile, as well as a reduction in total cloud cover; both of these are likely to be linked to an observed decline in coastal vegetation during recent decades [14]. Temperature changes during the late 20th century are characterised by coastal cooling and inland warming, and this has been interpreted as being due to differences in altitude; temperature changes at high altitudes of the country are different from those nearer sea level [1]. The previous generation of climate models (from Phase 3 of the Climate Model Intercomparison Project, CMIP3) show a marked contrast in central and northern Chile from 1979-2006, between a cooling of -0.2°C decade-1 over coastal regions and a warming of +0.25°C decade-1 over the Andes [1]. A study of annual temperature records from 1960- 1992 found a significant warming of between +0.14 to +0.38°C decade-1, primarily over northern Chile and due to an increase in daily minimum temperatures [15-17]. Future impacts of climate change are also likely to be highly regionally variable across Chile. In central regions, it is expected that climate change will be characterised by a decrease in rainfall and a greater proportion of precipitation falling as rain [18]. In contrast, for northern Chile, the majority of CMIP3 models predict that the dry conditions currently experienced will not change significantly during the 21st century [19].
Following this introduction, Section 2 describes the data and methods used here, then Section 3 presents the results. This is divided into 3 subsections: i) global observational or satellite-derived datasets are discussed; ii) current GCMs are compared, focusing on their ability to reproduce present-day Chilean climate and validated against the observational/satellite data; iii) the models’ projections of future climate change over Chile are discussed. Section 4 discusses a case study of particular relevance to Chilean agriculture, before summarizing and concluding.
Data and Methods
Data
Observational data: Two key variables are focused upon here when discussing present-day and future climate, namely rainfall and surface air temperature, although rainfall receives preferential treatment due to its importance in socio-economic activities. It is generally agreed that to properly understand the variability and potential change in these variables, data need to be publicly available, accurate, reliable, longterm and spatially distributed [20]. However, this is often not the case. An alternative, therefore, is to use satellite-based datasets of rainfall estimates, or reanalysis data.
The first rainfall product used here is from the Global Precipitation Climatology Project (GPCP), which merges satellite-based (from both microwave and infra-red measurements) rainfall estimates with rain gauge data. The dataset provides monthly rainfall values on a 2.5° global grid, beginning in January 1979 and extending to the present day; here, January 1979 to December 2008 is used to roughly correspond to the other selected datasets. For full details on GPCP Version 2 Satellite- Gauge refer [21]. Rainfall data are also obtained from the CPC Merged Analysis of Precipitation (CMAP) and the Tropical Rainfall Measuring Mission (TRMM). CMAP comprises monthly rainfall values on a 2.5° global grid, covering the period from January 1979 to July 2014; here, due to data availability, the period from January 1984 to December 2010 is used. For full details on CMAP [22,23]. TRMM contains rainfall estimates at high spatial and temporal resolution, with 3 hourly rainfall values on a 0.25° grid going from 50°N-50°S. Here, the data are averaged into monthly values and the period from January 1998 to December 2009 is used [24]. Finally, rainfall data are taken from ERA-Interim, one of the more recent global reanalysis products from the European Centre for Medium-Range Weather Forecasts (ECMWF). Precipitation is dependent on the model convection scheme, but this has been improved since previous versions to give a more realistic representation of rainfall [25]. Here, monthly rainfall values on a global 1.5° grid are used, covering the period from January 1979 to December 2010.
For temperature, the first product used here is a gridded monthly climatology and time-series of air temperature from the University of Delaware, USA (UDEL). The dataset comprises monthly mean air temperature values on a 0.5° global grid, covering land points only and extending from 1900-2010; here, to maintain approximate consistency with the other products, January 1979 to December 2010 is used. For full details, refer to [26] for the climatology and [27] for the global timeseries. The second observational temperature dataset used here is from CRUTEM4, a collaborative project between the UK Meteorological Office (UKMO) Hadley Centre and the Climatic Research Unit (CRU). The dataset contains gridded near surface air temperature anomalies on a 5° global grid, covering land points only and extending from 1850 to the present-day; the values are based on monthly mean temperatures from over 5500 weather stations around the world, converted into anomalies with respect to the 1961-1990 mean for each grid box [28]. Here, the period from January 1979 to December 2010 is used. Refer to [29] and [30] for full updated details on CRUTEM4. Finally, temperature data are also considered from two reanalysis products. Firstly, ERA-Interim is again used, still on a 1.5° global grid but, due to data availability, covering a slightly shorter period from January 1980 to December 2005. Secondly, temperature data are obtained from the National Centers for Environmental Prediction/National Center for Atmospheric Research (NCEP/NCAR) reanalysis project [31]. The full surface air temperature dataset is available on a 2.5° global grid, covering the period 1948-2014; here, again to maintain consistency, the period from January 1979 to December 2010 is used.
GCM data: The most current GCMs are included in Phase 5 of the Coupled Model Inter-comparison Project (CMIP5), used to inform the most recent Assessment Report of the Intergovernmental Panel on Climate Change (IPCC AR5). Here, for its representation of presentday (e.g. 20th-century) climate, the CMIP5 Historical run is used, which is a model simulation from 1850-2005 in which realistic changing conditions based on observations (e.g. atmospheric composition, solar forcing, land use) are imposed [32]. To maintain approximate consistency with the above observational datasets, only the last 35 years (1970-2004) of this experiment are used. Due to data availability, only 27 models are included here (Table 1); the models have varying spatial resolutions, ranging from the lowest resolution of 3.75° longitude by 2.5° latitude (HadCM3) to the highest resolution of 0.56° longitude by 0.55° latitude (MIROC4h).
| Institution and Modelling Centre | Websites Link | Model |
|---|---|---|
| Commonwealth Scientific and Industrial Research Organisation and | ACCESS1-0 | |
| Bureau of Meteorology, Australia (CSIRO-BOM) | http://www.csiro.au/ | |
| http://www.bom.gov.au/ | ||
| Canadian Centre for Climate Modelling and Analysis, Canada | CanCM4 | |
| (CCCma) | http://www.ec.gc.ca/ccmac-cccma/ | |
| NCAR / UCAR Community Earth System Model (CESM) | http://www.cesm.ucar.edu/models/ccsm4.0/ | CCSM4.0 |
| Centre National de RecherchesMeteorologiques / Centre | CNRM-CM5 | |
| Europeen de Recherche et Formation Avancees en Calcul | CNRM-CM5-2 | |
| Scientifique, France (CNRM-CERFACS) | http://www.cnrm.meteo.fr | |
| http://www.cerfacs.fr/ | ||
| Commonwealth Scientific and Industrial Research Organisation and | CSIRO-MK3 | |
| Queensland Climate Change Centre of Excellence, Australia | ||
| (CSIRO-QCCCE) | http://www.csiro.au/ | |
| https://www.ehp.qld.gov.au/ | ||
| Geophysical Fluid Dynamics Laboratory, USA (NOAA GFDL) | GFDL-CM3 | |
| http://www.gfdl.noaa.gov/ | GFDL-ESM2M | |
| NASA Goddard Institute for Space Studies, USA (NASA GISS) | GISS-E2-H | |
| http://www.giss.nasa.gov/ | GISS-E2-H-CC | |
| GISS-E2-R | ||
| GISS-E2-R-CC | ||
| Met Office Hadley Centre, UK (MOHC) | HadCM3 | |
| http://www.metoffice.gov.uk | HadGEM2-CC | |
| HadGEM2-ES | ||
| Institute for Numerical Mathematics, Russia (INM) | http://www.inm.ras.ru | inmcm4 |
| Institut Pierre-Simon Laplace, France (IPSL) | https://www.ipsl.fr | IPSL-CM5A-LR |
| IPSL-CM5A-MR | ||
| Atmosphere and Ocean Research Institute (University of Tokyo), | http://www.aori.u-tokyo.ac.jp | MIROC4h |
| National Institute for Environmental Studies and Japan Agency | http://www.nies.go.jp/gaiyo | MIROC5 |
| for Marine-Earth Science and Technology, Japan (MIROC) | http://www.jamstec.go.jp/ | MIROC-ESM |
| MIROC-ESM-CHEM | ||
| Max Planck Institute for Meteorology, Germany (MPI-M) | http://www.mpimet.mpg.de | MPI-ESM-LR |
| MPI-ESM-P | ||
| Meteorological Research Institute, Japan (MRI) | http://www.mri-jma.go.jp | MRI-CGCM3 |
| Norwegian Climate Centre, Norway (NCC) | NorESM1-M | |
| http://folk.uib.no/ngfhd/EarthClim | NorESM1-ME |
Table 1: Institutions and modelling centres, along with their corresponding models selected from CMIP5.
For their representation of future (e.g. 21st - century) climate, the IPCC AR5 considers four Representative Concentration Pathway (RCP) scenarios. These are GHG concentration trajectories, describing four possible climate futures dependent on the level of GHG emissions [33]. The scenarios are RCP2.6, RCP4.5, RCP6 and RCP8.5, which correspond to a stabilisation of radiative forcing by the year 2100 (relative to pre-industrial values) of 2.6W m-2, 4.5W m-2, 6W m-2 and 8.5W m-2, respectively [32,33]. Here, only RCP4.5 and 8.5 are assessed, as RCP2.6 represents a level of mitigation that is unlikely to be achieved under the current political climate and RCP6 represents mitigation lying in between RCP4.5 and 8.5. Due to data availability, only 19 models are included here (Table 1) selected to match those used when considering present-day climate. However, when considering longerterm changes (i.e., 2006-2100), only 17 models are assessed; this is because the simulations from 2 models (GISS-E2-H and GISS-E2-HCC) do not extend beyond 2055.
Methodology
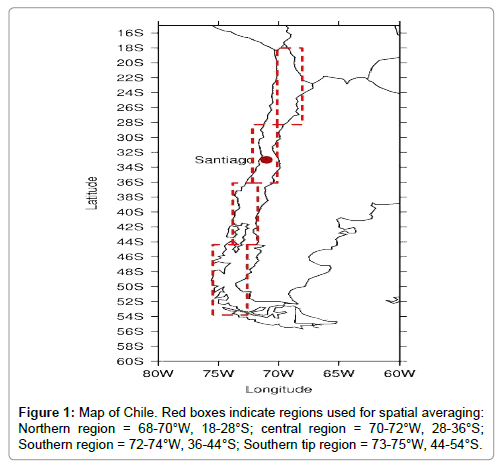
Here, the data (observational, satellite-derived or climate model) are assessed by simple metrics such as area averages, temporal means and seasonal cycles, as these are again of most importance to agricultural activities. For the area averages and seasonal cycles, the country is divided into 4 regions as shown in Figure 1, the Northern region (68- 70°W, 18-28°S), the central region (70-72°W, 28-36°S), the Southern region (72-74°W, 36-44°S) and the southernmost tip (73-75°W, 44- 54°S). For much of the analysis, the central region is focused upon due to this being the centre in terms of population and agricultural activity. For the temporal means, shown in the form of spatial maps for the whole of Chile, each dataset is considered at its own spatial resolution, to maintain the high resolution of some of the products. For reasons of brevity, only the two main seasons are focused upon, namely winter (June-August, JJA) and summer (December-February, DJF).
For future climate change, the following results are presented in 2 sections: i) the ‘near future’ which covers 35 years from 2006-2040; and ii) the ‘far future’ which covers the whole 21st century up to the year 2100. Whilst it is accepted that, for policy-making purposes, the next 30 years is of more relevance than the end of the century, in order to see the sensitivity of climate to emissions scenario the longer term needs to be considered. This is because the mitigation scenarios represented by RCP4.5 and 8.5 are approximately the same until 2040 (i.e., increasing emissions), therefore no difference between scenario would be expected in the near future and so only results from RCP4.5 are shown here for this time period. However, climate sensitivity to emissions scenario should be more apparent beyond 2040, and in particular near the end of the century, and therefore the two scenarios can be compared.
Results
Current climate from observations
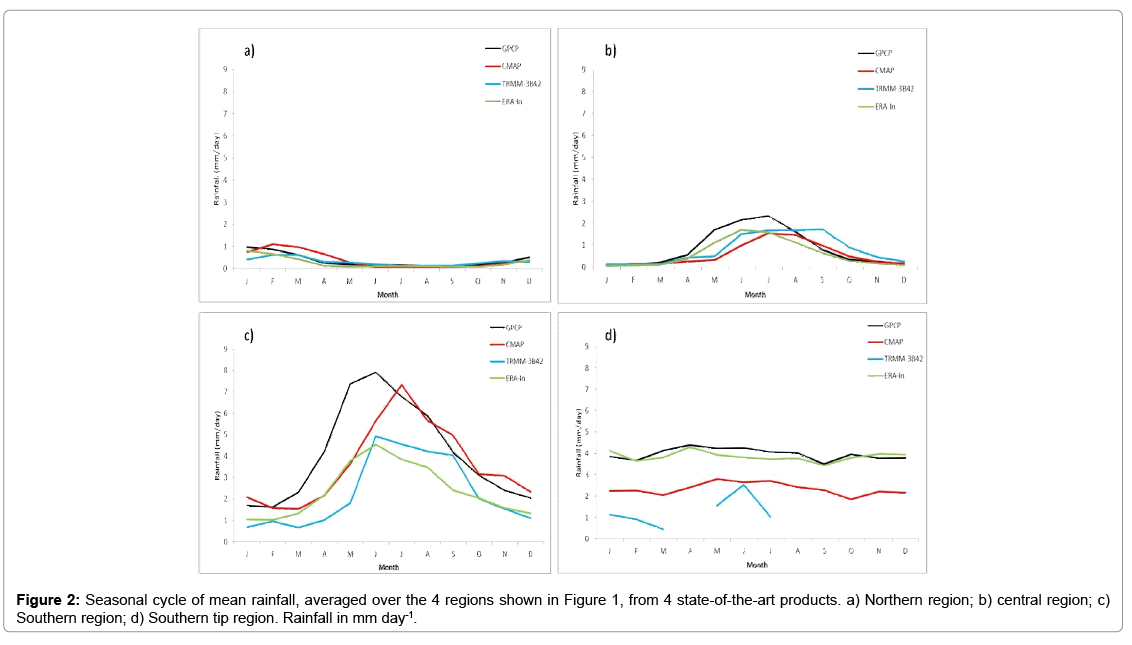
Mean rainfall, averaged over the 4 regions, from the 4 datasets for both summer and winter seasons was analysed. The meridional spatial variation of rainfall across Chile is obvious, with higher JJA rainfall in the central and southern regions compared to the drier southern tip and extremely arid conditions of the Northern region (not shown). The 4 datasets agree reasonably well through time; during JJA in the central region, for example, all datasets pick-up rainfall maxima in years such as 1987 and 1997, both of which experienced strong El Niño events. The seasonal cycle of rainfall for each region is more clearly shown in Figure 2. Moving from North to South, all datasets approximately agree on rainfall maxima occurring during DJF in the dry northern region (Figure 2a) and during JJA in the wetter central region (Figure 2b). In the wettest Southern region, the datasets again show a clear seasonal cycle and agree on peak rainfall occurring in JJA. There is more disagreement here, however, particularly over the exact timing of peak rainfall, with GPCP putting it as occurring during May or June but CMAP putting it later in the year (Figure 2c). Spatially, there is also reasonably good agreement between the datasets, with all products agreeing that maximum rainfall (of between 5-10 mm day-1) occurs south of Santiago during JJA (not shown).
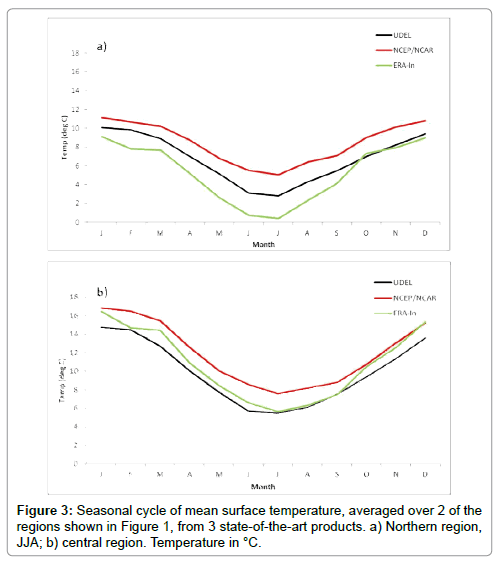
Concerning surface air temperature, the seasonal cycle averaged over the two regions is shown in Figure 3a. The central region (Figure 3b) shows warmer temperatures than further north, but this is due to the fact that the Northern region (Figure 1) includes a large area of highland which is artificially reducing the mean temperature. There is again a general agreement between the datasets, although NCEP/ NCAR is consistently showing a warm bias throughout the year. The only product containing actual temperature observations, UDEL, lies between the two reanalysis datasets. Spatially, there is again a general agreement across the datasets. During JJA, all products agree on cooler temperatures across Chile, with the coldest regions being along the Andes and in southern Chile (not shown). Conversely, during DJF, the majority of the country is warmer, particularly across central regions and further inland into South America.
Current climate from GCMs
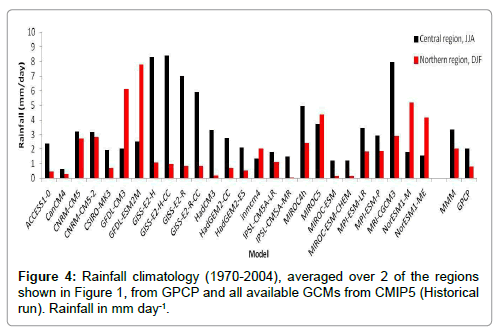
Figure 4 shows the rainfall climatology for the wet seasons over the two regions (i.e., JJA for the central region and DJF for the northern region), from the available GCMs from CMIP5 as well as from GPCP. The multi-model mean (MMM) is also shown.
Immediately obvious is the difference in rainfall between the models, such as for the central region during JJA where mean rainfall ranges from over 8 mm day-1 in some models to less than 2 mm day-1 in others. Compared to GPCP, the majority of models overestimate rainfall during both seasons, and although the MMM is closer to GPCP, it is still overestimating rainfall. In the simulated seasonal cycles of rainfall from each GCM, although all models agree on the approximate rainfall cycle, there is a considerable spread between models concerning both the magnitude and timing of peak rainfall (not shown). In the northern region, all models agree reasonably well on the timing of peak rainfall (occurring in February), but some models make rainfall maxima as over 9 mm day-1 whereas others show less than 1 mm day-1. In the central region, the majority of models get the timing of peak rainfall roughly correct, although they simulate the wet season as being longer than in observations. Approximately half of the models agree that peak rainfall is between 1-4 mm day-1 and occurs during June or July (more similar to the observations), but some models put the magnitude of peak rainfall much higher. The spatial extent of this overestimation is shown in Figure 5, where JJA mean rainfall over central Chile is higher than GPCP in the majority of models.
At least half of the models overestimate rainfall over Santiago and central Chile by ~5 mm day-1 or more. In this region, the rest of the models either show little difference to GPCP or, in some cases, underestimate rainfall over central Chile, again by up to 5 mm day-1 . Over northern Chile, the majority of the models underestimate JJA rainfall, relative to GPCP. It is worth noting, however, that dry conditions prevail over this region during JJA, with little or no rainfall observed over the highland areas. The same is true during DJF, when the majority, if not all, of the models overestimate rainfall north of 20°S (not shown).
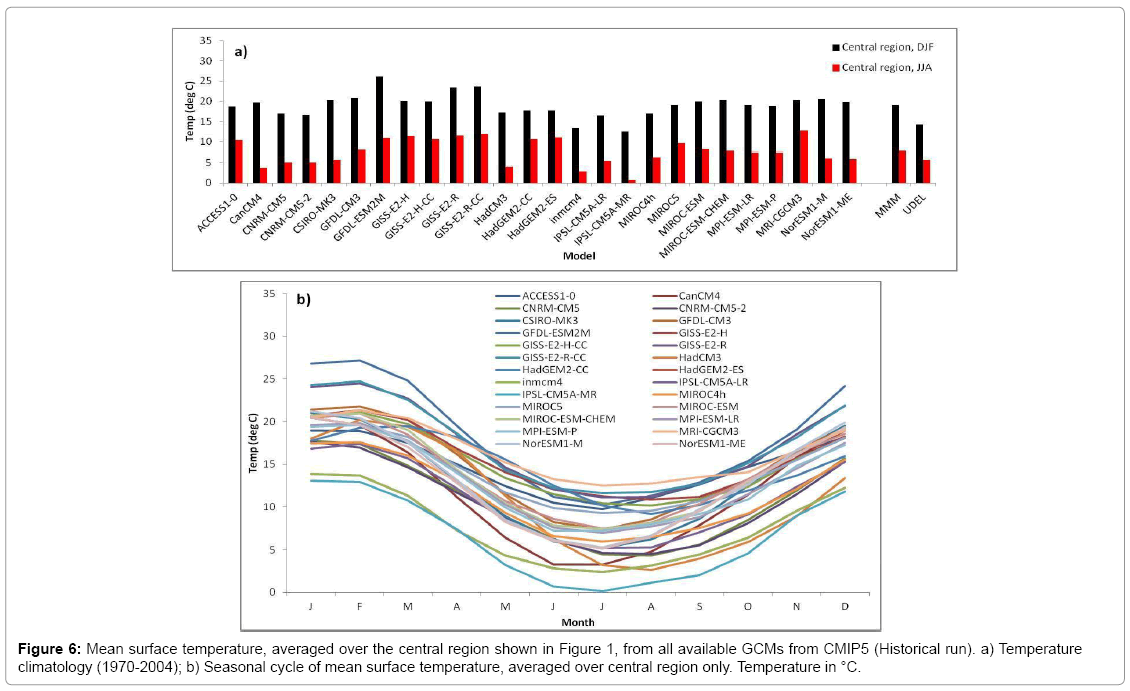
It is unsurprising that there is more agreement between models, as well as with observations, when considering the 1970-2004 surface air temperature climatology and seasonal cycle (Figure 6).
All models (including the MMM), however, overestimate temperatures during both seasons, relative to UDEL. During DJF, the majority of models agree on temperatures between 15°C to 20°C, although mean values range from just over 10°C to above 25°C (Figure 6a). The same general agreement is true during JJA, with all models agreeing on lower mean temperatures. Concerning the seasonal cycle of temperature, there is a general agreement across models in both the timing and magnitude of minimum and maximum temperatures (Figure 6b). However, in comparison to observations, all models greatly overestimate mean temperatures during summer months and in particular during January-February, with temperatures peaking at 26°C in the models compared to 15°C in UDEL. Spatially, the majority of models underestimate mean JJA temperatures across most of Chile relative to UDEL, with the exceptions being the NASA GISS family of models which all overestimate mean temperatures (not shown).
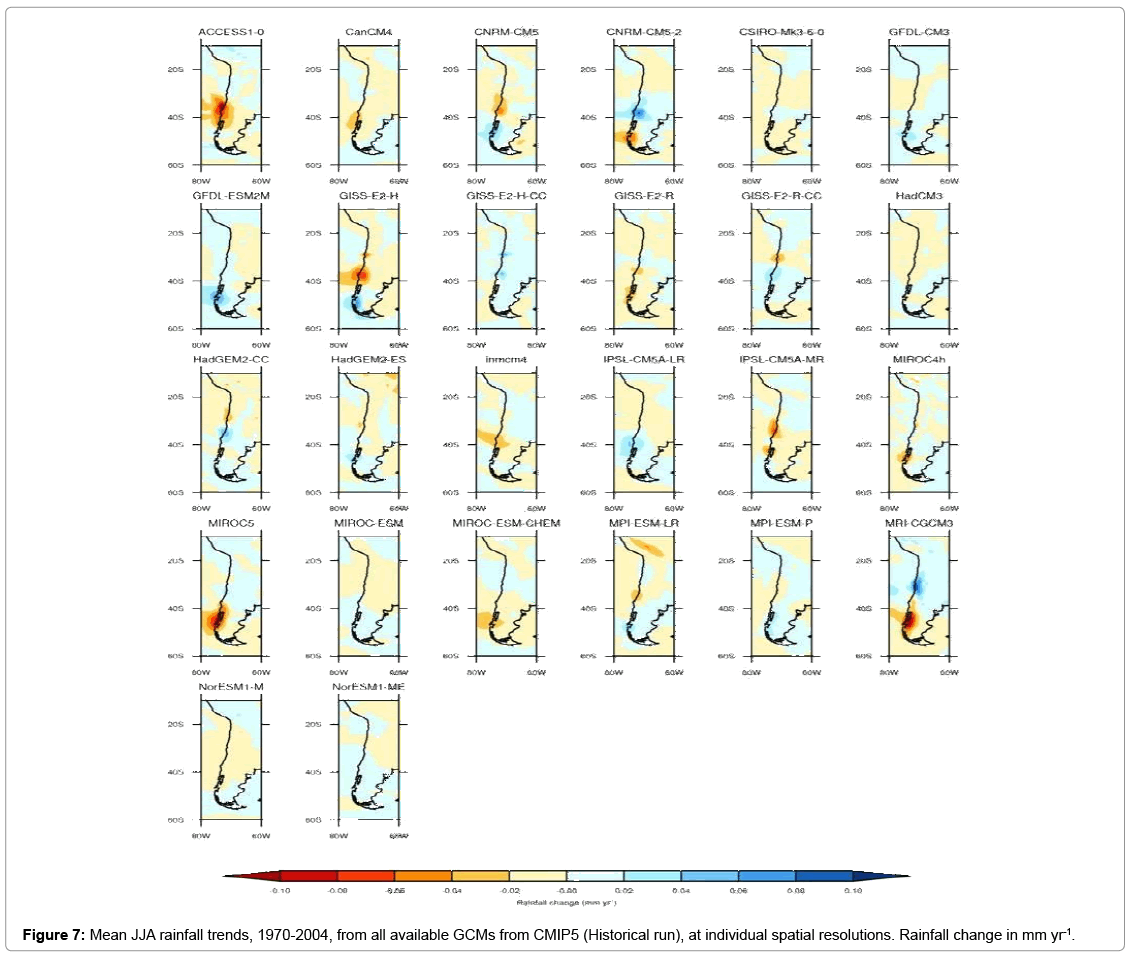
Concerning potential changes during this 35 year period, (Figure 7) shows the trends in mean JJA rainfall. Trends are generally small and do not exceed +/- 0.1 mm year-1; at least half of the models, however, suggest a drying trend over much of Chile, consistent with other studies e.g. [14]. This is also true during DJF, although the majority of models suggest even smaller trends than JJA, as expected (not shown). For JJA surface temperature, trends are generally positive (over 0.1°C year-1 in some models), and the majority of models agree on warming over northern and central Chile and cooling further south (not shown), consistent with other studies (e.g. [15]).
Future climate change
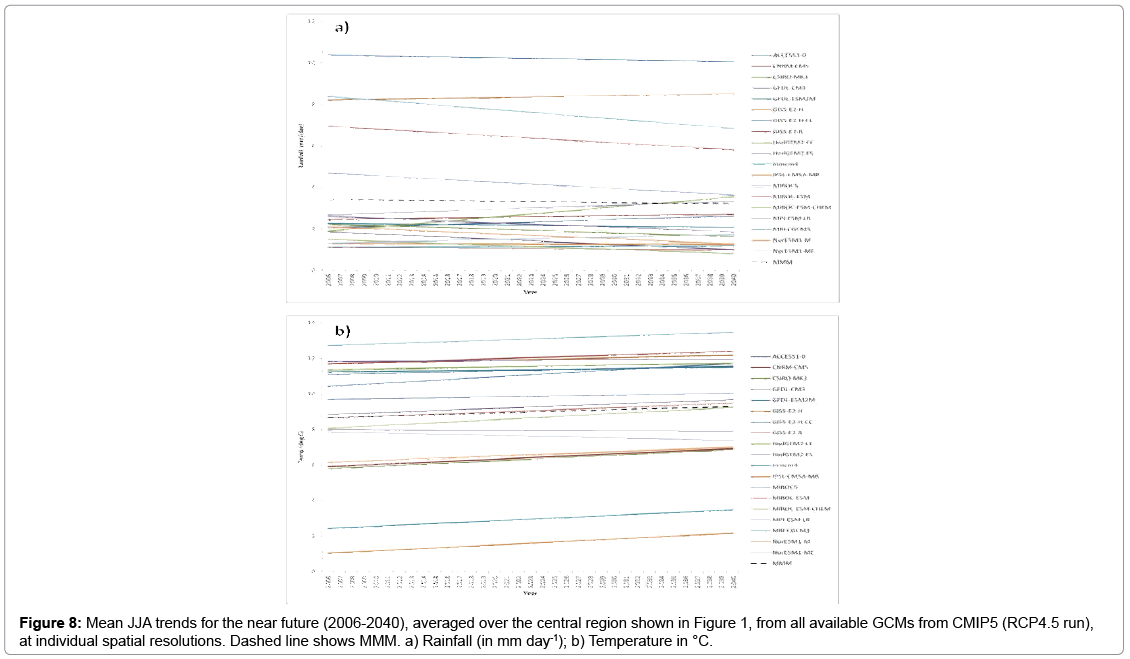
Near future (2006-2040): Mean JJA rainfall and surface air temperature trends from the 19 available GCMs (RCP4.5) is shown in Figure 8.
Qualitatively, for rainfall, although some models show a reduction in rainfall over the period, the majority of models (and the MMM) suggest little or no change (Figure 8a), consistent with the earlier results for the present day. A quantitative assessment of rainfall change during the period also suggests this, with the majority of models showing a reduction in rainfall but rarely more than a 0.5 mm day-1 difference between the beginning and end of the 35 year period. For temperature, however, almost all of the models suggest a warming trend, as does the MMM, again consistent with the end of the 20th century; only 2 models suggest a cooling trend, and this is small (Figure 8b). Quantitatively, some models show an increase of up to 1.4°C between the beginning and end of the 35 year period, although most (and the MMM) are more conservative and suggest a difference of around 0.7°C. Spatially, for rainfall, many models suggest little or no change (less than +/- 0.1 mm year-1) over most of the country (not shown). However, there is a clear lack of coherence among the models regarding the sign of change, with some models projecting wetter conditions, some projecting drier conditions and others no change. For example, some models suggest that the drying trend over central Chile seen during the end of the 20th century will continue, with approximately half the models suggesting a decrease in rainfall in this region of up to 0.1 mm year-1 during the near future. For temperature, there is more agreement across models, with the majority showing a warming trend (greater than 0.1°C year-1 in some models) over most of the country and particularly in northern regions (not shown).
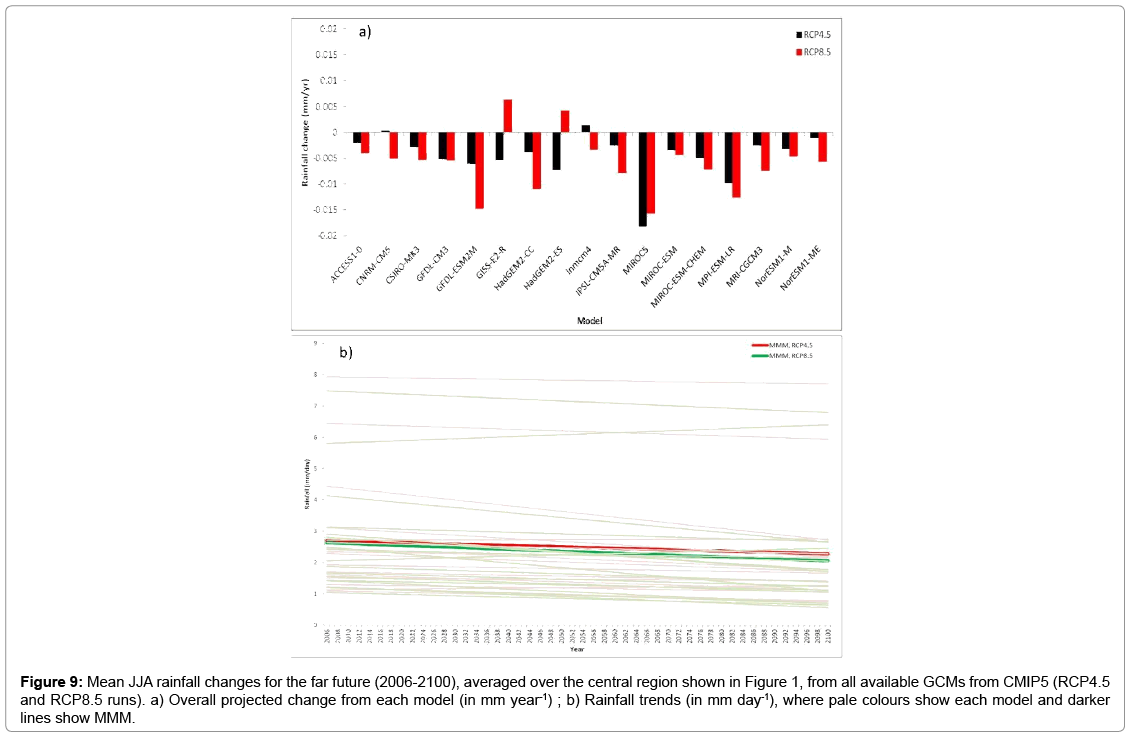
Far future (2006-2100): Figure 9 shows the mean JJA rainfall trends from the 19 available GCMs, according to the RCP4.5 and 8.5 scenarios. Irrespective of scenario, the majority of models show a decrease in rainfall over the century (Figure 9a). For approximately half the models, the decrease is larger in RCP8.5 than RCP4.5. Similar to the shorter-term near future rainfall trends, the majority of models show either a decreasing rainfall trend or little trend during the century, as does the MMM (Figure 9b). For mean JJA surface air temperature changes, however, the models are all more consistent and all project a warming trend (not shown).
Figure 9: Mean JJA rainfall changes for the far future (2006-2100), averaged over the central region shown in Figure 1, from all available GCMs from CMIP5 (RCP4.5 and RCP8.5 runs). a) Overall projected change from each model (in mm year-1) ; b) Rainfall trends (in mm day-1), where pale colours show each model and darker lines show MMM.
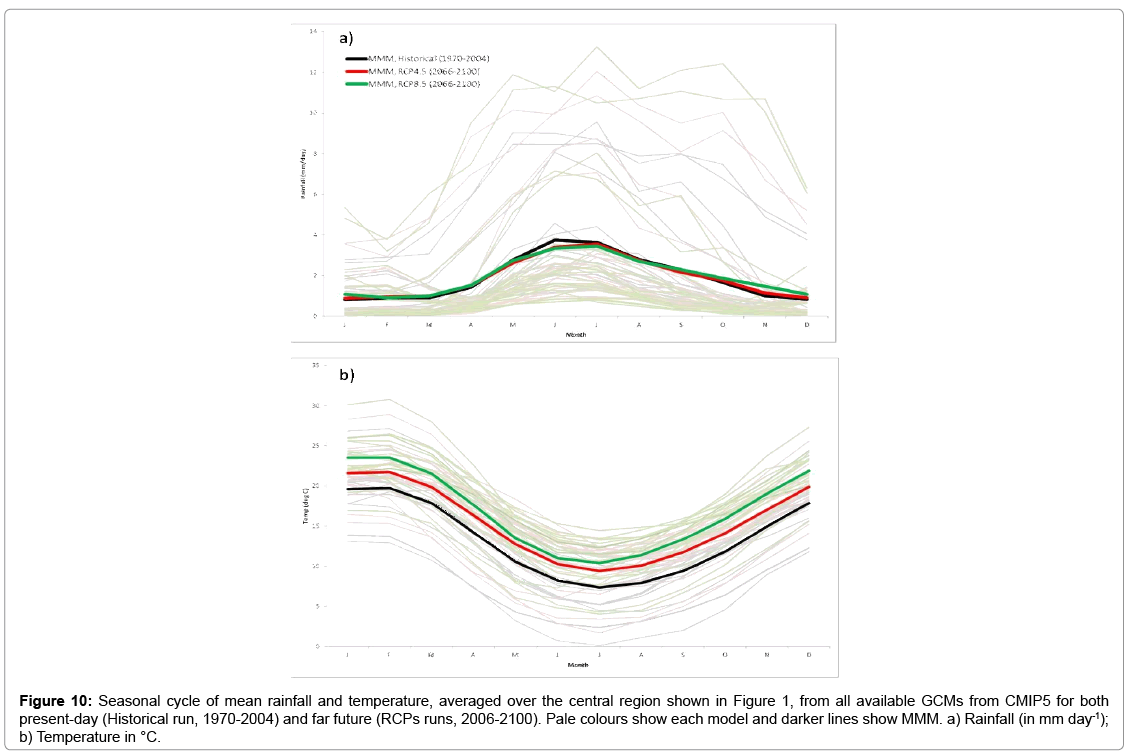
The lack of long-term change in mean rainfall and increase in mean surface air temperatures is shown more clearly in Figure 10, where the seasonal cycle of rainfall and temperature is shown for 3 separate 35 year time-slices, according to model simulation.
Figure 10: Seasonal cycle of mean rainfall and temperature, averaged over the central region shown in Figure 1, from all available GCMs from CMIP5 for both present-day (Historical run, 1970-2004) and far future (RCPs runs, 2006-2100). Pale colours show each model and darker lines show MMM. a) Rainfall (in mm day-1); b) Temperature in °C.
During the latter time-slice, the differences between the two RCP scenarios should be most evident. For rainfall, as suggested previously, the MMM shows little or no change between the ends of the 20th and 21st centuries (Figure 10a). For temperature, however, all models (and all simulations) agree on the timing (if not magnitude) of maximum and minimum temperatures, and there is clearly an increase in mean surface air temperature, during all months, at the end of the 21st century relative to the end of the 20th century (Figure 10b).
Spatially, there are again differences between mean JJA rainfall from the end of the 20th century (as simulated by the Historical run) and mean JJA rainfall from the end of the 21st century (as simulated by the two RCP scenarios). Under RCP4.5, the majority of models suggest a reduction in rainfall over central and northern regions in the future relative to the present-day (not shown). Under RCP8.5, these same patterns are again present, but are stronger in magnitude, as expected. For temperature, under RCP4.5 all models project that the end of the 21st century will be significantly warmer than the end of the 20th century, particularly over northern Chile and inland regions (not shown). Although there is some variability across models in the magnitude of warming, many suggest temperature increases of up to 5°C. Under RPC8.5, the same patterns are again present but, under this scenario, the magnitudes of warming are even larger, exceeding 5°C in northern regions in some models. The cooling trends seen over southern Chile during the end of the 20th century and suggested by other studies (e.g. [15]), are no longer suggested by either scenario at the end of the 21st century.
Discussion
Case study example of direct relevance for Chilean agriculture
Although a clear increase in temperatures has been suggested during the 21st century, these are mean temperatures and as such do not provide any information on other measures of temperature. Minimum and maximum temperatures are two such examples, the former of which has particular relevance for avocado growing in Chile. This crop is highly sensitive to freezing temperatures, meaning that an entire harvest can be lost if an unexpected frost occurs during the growing season [34,35]. A study of minimum temperatures therefore, and how they might change in the future, is of direct relevance to this activity.
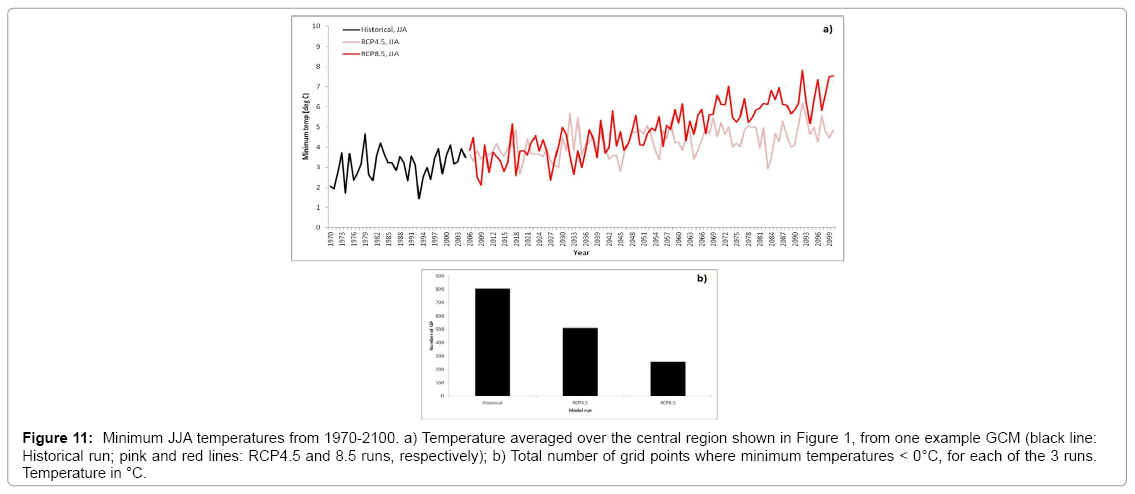
To this end, Figure 11 shows minimum temperatures averaged over the central region, from 1970 to 2100, as represented by the historical and RCP runs from one example GCM (CCSM4.0).
Figure 11: Minimum JJA temperatures from 1970-2100. a) Temperature averaged over the central region shown in Figure 1, from one example GCM (black line: Historical run; pink and red lines: RCP4.5 and 8.5 runs, respectively); b) Total number of grid points where minimum temperatures < 0°C, for each of the 3 runs. Temperature in °C.
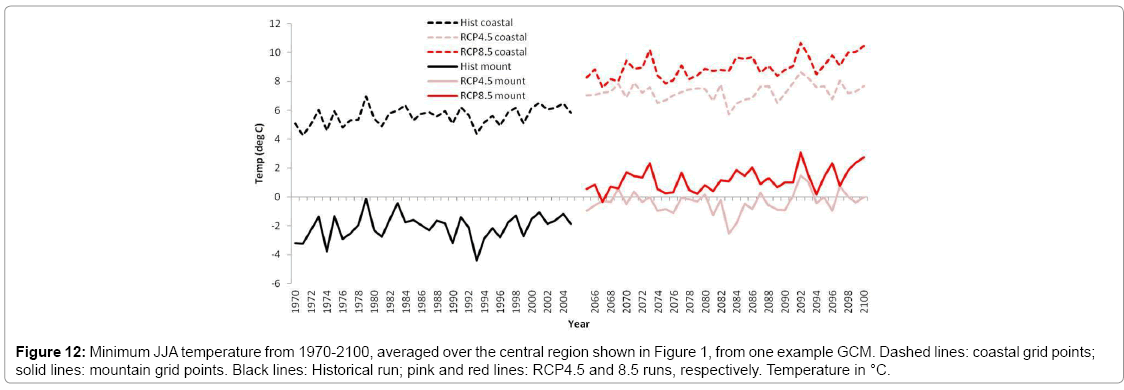
Figure 11a shows a clear increase in minimum temperatures over the century, particularly so in the strongest GHG emission scenario (RCP8.5). No year shows JJA temperatures that are below 0°C; however this figure is somewhat misleading and demonstrates the problem of spatial resolution. In this model, the central region box is only 2 grid points wide; one which runs along the warmer coast, and the other in the much colder mountains. When averaged over both of these, the minimum temperatures even out and gave a misleading image. Figure 12 resolves this problem by dividing the region longitudinally in two, plotting the average of all coastal and mountainous grid boxes separately. Whilst the coastal zone minimum temperatures never fall below freezing, in the mountains they are consistently well below freezing during the end of the 20th century but above freezing at the end of the 21st century (particularly so for RCP8.5). When amalgamated (i.e., coastal and mountain grid points considered together), there is nevertheless a decrease over time in the total number of grid points where minimum temperatures were below 0°C, as shown in Figure 11b. Here, the end of the 20th century (as represented by the Historical run) shows significantly more grid points below freezing than the end of the 21st century.
This clearly has implications for avocado growing. The results suggest a reduction in the number of days below freezing in a warming climate, particularly in mountainous regions of central Chile where many avocado fields are found. This would suggest a reduced risk of harvest damage from freezing temperatures, and potentially a positive impact of climate change. This work clearly warrants further investigation, but is consistent with previous studies which have suggested that the warming trend seen over northern Chile is primarily due to an increase in minimum temperatures rather than a change in the mean [15-17].
Summary and Conclusion
Four rainfall and surface air temperature products from publiclyavailable observational and satellite-derived datasets were compared. Most of these products are either observational, satellite-derived or a combination of the two. The other two products, ERA-Interim and NCEP/NCAR, are global reanalysis datasets and are therefore comprised of model output that has assimilated observational data into its simulations. In general, the datasets agree in both temporal and spatial patterns of rainfall and temperature. Despite this general agreement, however, there are small differences between some of the datasets, particularly when considering rainfall and the approximate timing of the wet season.
Nevertheless, despite these discrepancies between the datasets, they nevertheless provide a platform for validating present-day simulations from GCMs. Here, 26 state-of-the-art climate models from CMIP5 were compared, focusing on their simulations of the end of the 20th century (1970-2004). In general, although most models reproduce the largescale spatial and temporal patterns of mean rainfall and temperature, there is significant variability between models and particularly when considering long-term change. Some models are consistent with observations in terms of increasing or decreasing trends, whereas others disagree on both sign and magnitude of change. This highlights some of the uncertainties when considering GCM simulations, with all models utilising different setups, parameterisation schemes, spatial resolution, etc.
When considering future climate change, either in the near future (next ~30 years) or at the end of the 21st century, the same climate models from CMIP5 was again compared. As a basis for their projections, two emissions scenarios were assessed. In the near future, most models suggest either a small decrease in rainfall or no change over Chile; however the lack of agreement between models regarding the sign of change suggests that rainfall trends in this region are highly uncertain. For temperature, there is more consistency, with a clear warming trend over northern and inland regions, consistent with previous studies. These trends are also seen on the longer term and are found irrespective of scenario, with most models agreeing on a small reduction in rainfall and a larger increase in temperatures by the end of the 21st century.
Acknowledgements
C. Williams wishes to thank the UK Newton Funding Programme for funding this project at NCAS-Climate/Department of Meteorology, University of Reading, UK. UDEL and NCEP/NCAR data provided by the NOAA/OAR/ESRL Physical Sciences Division PSD, Boulder, Colorado, USA, from their website at http:// www.esrl.noaa.gov/psd/. C. Williams acknowledges the World Climate Research Programme's Working Group on Coupled Modelling, which is responsible for CMIP, and thanks the climate modeling groups (listed in Table 1 of this paper) for producing and making available their model output. For CMIP the U.S. Department of Energy's Program for Climate Model Diagnosis and Inter-comparison provides coordinating support and led development of software infrastructure in partnership with the Global Organization for Earth System Science Portals.
References
- Falvey M, Garreaud R (2009) Regional cooling in a warming world: Recent temperature trends in the southeast Pacific and along the west coast of sub-tropical South America from 1979-2006. J Geophys Res 114.
- Falvey M, Garreaud R (2007) Winter-time precipitation episodes in Central Chile: Associated meteorological conditions and orographic influences. J Hydrometeorol 8: 171-193.
- Aceituno P (2008) The 1877-1878 El Niño episode: Associated impacts in South America. Climatic Change 92: 3890-416.
- Favier V (2008) Interpreting discrepancies between discharge and precipitation in high altitude areas of Chile's Norte Chico region (26°S-32°S). Water Resources Res 1: 1-60.
- Garreaud R (2008) Present-day South American climate.Palaeoecol 032.
- Karoly DJ (1989) Southern hemisphere circulation features associated with El Niño-southern oscillation events. J Climate 2: 1239-1252.
- Rutllant J, Fuenzalida H (1991) Synoptic aspects of the central Chile rainfall variability associated with the Southern Oscillation. Int J Climatol 11: 63-76.
- Montecinos A, Aceituno P (2003) Seasonality of the ENSO-related rainfall variability in Central Chile and associated circulation anomalies. J Climate 16: 281-296.
- Rojas M (2006) Multiply nested regional climate simulations for Southern South America: Sensitivity to Model Resolution. Mon Weather Rev 134: 2208-2223.
- Kidson J (1988) Indices of the southern hemisphere zonal wind. J Climate 1: 183-194.
- Thompson DW, Wallace JM (2000) Annular modes in the extratropical circulation. Part I: Month-to-month variability. J Climate 13: 1000-1016.
- Mantua NJ (1997) A Pacific interdecadal climate oscillation with impacts on salmon production. Bull. Am. MeteorolSoc 78: 1069-1079.
- Quintana J, Aceituno P (2012) Changes in the rainfall regime along the extratropical west coast of South America (Chile): 30°-43°S, Atmosfera 25: 1-22.
- Schulz N, Boisier JP, Aceituno P (2012) Climate change along the arid coast of northern Chile. Int J Climatol 32: 1803-1814.
- Rosenbluth B, Fuenzalida H, Aceituno P (1997) Recent temperature variations in southern South America. Int J Climatol 17: 67-85.
- Vincent LA (2005) Observed trends in indices of daily temperature extremes in South America from 1960-2000. J Clim 18: 5011-5023.
- Villarroel C, Rosenbluth B, Aceituno P (2006) Climate change along the extratropical west coast of South America (Chile): Daily max/min temperatures. AmMeteorolSocFoz de Iguazu 28: 487-489.
- Demaria EM (2013) Climate change impacts on an alpine watershed in Chile: Do new model projections change the story?. J Hydrol 502: 128-138.
- Fuenzalida H (2007) Study on climate variability for Chile during the 21st century. Technical Report prepared for the National Environmental Committee, Santiago, Chile.
- Williams CJ, Kniveton DR (2011) Introduction to African climate and climate change: Physical, social and political perspectives. Springer Science +Business Media BV 2011. Dordrecht, Heidelberg, London and New York: 212
- Adler RF (2003) The Version 2 Global Precipitation Climatology Project (GPCP) Monthly precipitation analysis (1979-Present). J Hydrometeor 4: 1147-1167.
- Xie P, Arkin PA (1996) Analyses of global monthly precipitation using gauge observations, satellite estimates, and numerical model predictions. J Climate 9: 840-858.
- Xie P, Arkin PA (1997) Global precipitation: A 17-year monthly analysis based on gauge observations, satellite estimates, and numerical model outputs. Bull Amer Meteor Soc 78: 2539-2558.
- Huffman GJ (2007) The TRMM multi-satellite precipitation analysis: Quasi-Global, multi-year combined-sensor precipitation estimates at fine scale. J Hydrometeor 8: 38-55.
- Dee DP (2011) The ERA-Interim reanalysis: configuration and performance of the data assimilation system. QJR MeteorolSoc 137: 553-97.
- Willmott CJ, Matsuura K, Legates DR (2001) Global air temperature: Regridded monthly and annual climatologies.
- Matsuura K, Willmott CJ (2012) Terrestrial air temperature: 1900-2010 Gridded monthly time series.
- UKMO (2015) CRUTEM4 dataset. Met Office Hadley Centre observations datasets.
- Jones PD (2012) Hemispheric and large-scale land surface air temperature variations: An extensive revision and an update to 2010. J Geophys Res 117: 05127
- Osborn TJ, Jones PD (2014) The CRUTEM4 land-surface air temperature data set: construction, previous versions and dissemination via Google Earth. Earth System Sci Data. 6: 61-68.
- Kalnay E (1996) The NCEP/NCAR Reanalysis 40-year Project. Bull Amer Meteor Soc 77: 437-471.
- Taylor KE, Stouffer RJ, Meehl GA (2009) A summary of the CMIP5 experiment design CMIP5.
- Moss R (2008) Towards new scenarios for analysis of emissions, climate change, impacts, and response strategies. Intergovernmental Panel on Climate Change, Geneva, 132.
- Irazabal FG (2001) History and development of the avocado in Chile. California Avocado Society 85: 113-128
- Schmidt M (1965) Avocado growing in Chile. California Avocado Society49: 45-46.
Relevant Topics
- Atmosphere
- Atmospheric Chemistry
- Atmospheric inversions
- Biosphere
- Chemical Oceanography
- Climate Modeling
- Crystallography
- Disaster Science
- Earth Science
- Ecology
- Environmental Degradation
- Gemology
- Geochemistry
- Geochronology
- Geomicrobiology
- Geomorphology
- Geosciences
- Geostatistics
- Glaciology
- Microplastic Pollution
- Mineralogy
- Soil Erosion and Land Degradation
Recommended Journals
Article Tools
Article Usage
- Total views: 11195
- [From(publication date):
May-2017 - Aug 17, 2025] - Breakdown by view type
- HTML page views : 9893
- PDF downloads : 1302

