Diffusion Weighted and Dynamic Contrast-Enhanced MRI as a Predictor of Treatment Response in Head and Neck Cancer to Chemoradiotherapy: The Role of Early Intratreatment Scanning
Received: 03-May-2018 / Accepted Date: 22-May-2018 / Published Date: 28-May-2018 DOI: 10.4172/2167-7964.1000296
Abstract
Background: In locoregionally advanced Head and Neck Squamous Cell Carcinoma (HNSCC), intra-treatment scanning early during the course of Concomitant Chemoradiotherapy (CRT) with advanced functional Magnetic Resonance Imaging (MRI) could potentially allow for modification of treatment to maximize the chance of favourable outcome. The aim of this prospective study was to assess the predictive value of parameters derived from Dynamic Contrast-Enhanced (DCE) and Diffusion Weighted (DW) MRI for treatment response early during the course of CRT in patients with HNSCC.
Methods: MRI scans were performed in 20 patients with locoregionally advanced HNSCC at baseline, after 10 Grays (Gy) and 40 Gy of CRT. DW and DCE derived parameters as well as the volumes were measured from primary tumours and lymph nodes. Tumour kinetic parameters (volume transfer constant (Ktrans), extracellular extravascular volume fraction (ve) and plasma volume fraction (Vp)) were assessed using the extended Tofts model. Relative changes in studied parameters from baseline to 10 Gy and 40 Gy were calculated. Factors predictive for treatment response were identified by the Firth logistic regression. Spearman’s rank correlation coefficient was used to investigate correlations among the parameters.
Results: Responders showed a significant decrease in Ktrans after 10 Gy (median, -50.2 %; range, -25.1 to -90.9 %; P = 0.047). In addition, decreased ve after 10 Gy (median, -26.9%; range -76.7 to -126.8%) and increased apparent diffusion coefficient (ADC) after 40 Gy (median, 73.4%; range, 17.8 - 121.6%) were borderline significant (P=0.066 and P=0.079, respectively). Positive correlation between Ktrans and ve after 10 Gy (r = 0.823, P <0.05) was noticed.
Conclusion: In HNSCC, early changes in DCE- and DWI-MRI derived parameters appear to predict tumour response before the actual morphologic changes occur.
Keywords: Treatment response; Diffusion-Weighted imaging; Dynamic contrast-enhanced MRI; Squamous cell head and neck cancer; Concomitant chemoradiotherapy
Introduction
Head and neck squamous carcinoma (HNSCC) is the most commonly diagnosed cancer and the sixth most common cause of cancer death worldwide [1]. Offering good chances for organ preservation, concomitant chemoradiotherapy (CRT) is currently used in a significant proportion of patients with locoregionally advanced HNSCCs [2,3]. However, in addition to not negligible toxicity of CRT, around 50% of patient experience tumour recurrence [4,5]. Therefore, intra-treatment scanning early during the course of therapy would potentially allow for modification of treatment scenario with reduction of toxicity and costs due to potential under- or overtreatment [6]. In addition, more intensive post-treatment surveillance could address the sites of possible treatment failures in order to identify them at still salvageable times [7].
Morphological assessment of tissues with conventional magnetic resonance (MR) and computed tomography (CT) imaging is only of a limited value when predicting tumour response to nonsurgical treatments and for intra-treatment monitoring as changes at a cellular level typically occur prior to morphological changes. Hence, more advanced functional methods that allow assessing for biological characteristics of tumour and its microenvironment are being recently introduced to conventional methods. CT perfusion (CTP) has already been reported to provide valuable information on tumour vascularity and CTP derived parameters may serve as possible predictive biomarkers for assessing response of advanced HNSCC during treatment with CRT. However, CTP exposes the patient to non-negligible doses of ionising radiation [8-10]. A molecular non-invasive imaging (18F)- fluorodeoxyglucose (FDG)-PET/CT with its mean standard up-take value (SUV) is also widely used for monitoring treatment response, though some studies suggested the poor predictive value of intra-treatment FDG-PET compared to FDG after the end of CRT [11]. In comparison with PET/CT, PET/MRI offers better anatomical detail without exposure to ionizing radiation and may provide greater accuracy than the currently available imaging techniques in assessing response to treatment after the end of CRT [12]. However, to our knowledge the role of PET/MRI during CRT of head and neck cancers is still un-known. An advanced functional MR imaging has been used for prediction of treatment response before and during non-surgical treatment over the past decade [13,14]. Although MR spectroscopy (MRS) has been used to predict response of head and neck cancers to RT/ CRT, the results showed no predictive role of pre-treatment choline (Cho) value or a change in Cho during treatment as predictors of clinical outcome [15]. It is also technically challenging to apply MRS to head and neck applications [16].
Diffusion-weighted (DW) MR imaging (MRI) is an important and widely used technique that allows for non-invasive measurement of water self-diffusivity in biological tissues [17] and studies have already shown that lower rise in apparent diffusion coefficient (ADC) during CRT indicates poor prognosis [18-22]. Although not so commonly used, dynamic contrast-enhanced MRI (DCE-MRI) with its quantitative pharmacokinetic parameters can assess the flow of blood through vessels in targeted tissue and therefore enables non-invasive characterization of tumour perfusion and angiogenesis [23]. However, due to lack of standardization of data acquisition and analysis [23], the results of studies assessing the value of perfusion parameters are still scarce and contradictory [24-26]. Combined use of DW and DCEMRI early during treatment has already proven to evaluate therapeutic response on other cancer types [27-29]. To the best of our knowledge, however, there is no published research study that would adress the utility of combined DW and DCE-MRI parameters measured early during CRT of HNSCC.
In the present study we assessed the role of DW and DCE MRI derived parameters in predicting early treatment response of locoregionally advanced HNSCC to cisplatin-based CRT. Primary objective was to determine whether the DW and DCE- MRI derived parameters, measured from primary tumours and metastatic lymph nodes can predict tumour response early during the course of CRT. The secondary objective was to examine the correlation between MRI-derived parameters as well as between tumour and node volumes.
Materials and Methods
Patients and concomitant radiochemotherapy
The study was approved by the National Medical Ethics Committee of the Republic of Slovenia (No. 22k/03/13) and written informed consent was obtained from the entire patient. Twenty patients with locally and/or regionally advanced (stages III-IVB) and histologically proven p16/HPV-negative SCC of the oro- or hypopharynx were enrolled in this study. They were all presented at the multidisciplinary tumour board which recommended a first-line treatment with cisplatinbased CRT. P16/HPV status was assessed as described elsewhere [30].
Patients were irradiated with a 6-MV linear accelerator photon beam using a concomitant boost intensity-modulated radiation technique. The dose to the primary tumour and enlarged lymph nodes was 70 Gy (gross tumour volume with a margin to compensate microscopic tumour extensions), whereas elective doses of 63 Gy (intermediate-risk volume - around larger nodes and non-palpable but radiologically suspicious nodes) and 56 Gy (low-risk volume) were applied for neck regions of probable microscopic disease in daily fractions of 2.0, 1.8 and 1.6 Gy respectively, over 7 weeks. During radiotherapy, cisplatin in a dose of 40 mg/m2/week was concurrently administered. No antiangiogenic therapy was added to the protocol.
MR imaging protocol
Between September 2013 and April 2017, all patients underwent four MR imaging with DWI and DCE-MRI: 1) 0-7 days before the treatment; 2) after 1 week (i.e., after the fifth fraction of radiotherapy, i.e. 10 Gy) and 3) after 4 weeks (i.e., after the 20th fraction of radiotherapy, i.e. 40 Gy) after the treatment started and 4) 2.5-3 months after the completion of CRT to conventionally assess radiological response to treatment.
MR imaging was performed on 3T MAGNETOM Trio, A Tim System (Siemens Medical Systems®, Erlangen, Germany) with a neck array coil. The diagnostic imaging protocol included axial T2-weighted sequences with short tau inversion recovery (STIR) from the base of the scull to aortic arch (TR/TE 5010/71 ms, TI 170 ms, flip angle (FA) 70°, receiver bandwidth 287 Hz/pixel, matrix size 256 × 256, slice thickness 3 mm, gap 0.3 mm and field of view (FOV) 18 x 18 cm). Axial slices that covered the entire primary tumour were selected for DW and DCE-MR imaging.
DW images were acquired in axial plane using pulsed spin-echo echo-planar image sequence (TR/TE 3600/86 ms, receiver bandwidth 1302 Hz/pixel, matrix size 180 × 192, slice thickness 5 mm, gap 1.5 mm, FOV 230 cm2 and total acquisition time 5.04 min). Five different b-values (b=0, 100, 200, 500 and 1000 s/mm2) were used to generate diffusion maps.
DCE-MRI was performed using 3D fast low angle shot (FLASH) sequence optimised for spatial and temporal resolution (TR/TE 5/1.16 ms, FA 15°, receiver bandwidth 490 Hz/pixel, matrix size 220 cm2, slice thickness 4 mm, temporal resolution 4 s, total acquisition time 5 min. T1 mapping was used to convert signal intensities into gadolinium concentration. The T1 map was calculated from precontrast multiple flip angle images (6°, 10° in 15°). A ĸ–space weighted image contrast algorithm was used to generate images with full spatial resolution of 128 × 128. Baseline images were acquired for 28 s. While the imaging continued, the gadobutrol (Gadovist®, Bayer HealthCare Pharmaceuticals) was administered intravenously in a dose of 0.1 mmol/kg body weights with a flow-rate of 3.5 ml/s followed by a 20 ml of saline flush with power injector.
Finally, post-contrast axial T1 weighted volumetric interpolated breath-hold examination (VIBE) sequences were acquired from skull base to aortic arch (TR/TE 3.26/1.26 ms, voxel size 1.1 x 0.9 × 1.5 mm with 4 mm averages, receiver bandwidth 640 Hz/pixel, matrix size 218 × 288 and FOV 250 cm2).
Image processing and analysis
The DCE and DW images together with conventional images were transferred for post-processing to a workstation running commercially available software Olea Sphere® 3.0 MR Head & Neck expanded applications (Olea Medical®, La Ciotat, and France). The software enabled simultaneous multi-parametric analysis and computation of all diffusion and perfusion parameters and tumour volume from all available sequences and slices.
Before data analysis, motion correction algorithm was applied that allowed for pairwise in-plane (acquisition plane) rigid co-registration of all raw perfusion images of a given slice location with well-chosen reference image over time. Apparent diffusion coefficient (ADC) maps were computed by a single exponential fit using the DW signal intensity-b value curves. Pharmacokinetic modelling of the DCE-MRI data was based on the extended Tofts model – a two compartment model, which is suitable for any freely diffusible tracer. The equation modelling the contrast agent’s concentration was the following:
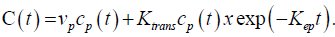
The Arterial Input Function (AIF) for the pharmacokinetic analysis was derived from automatic selection of perfusion weighted image pixels selected in suitable arteries using a dedicated algorithm.
DCE- and DW derived parameters as well as tumour volumes were measured at baseline, after 10 Gy and 40 Gy. The selected maps for multi-parametric analysis were ADC, volume transfer constant (Ktrans), extracellular extravascular volume fraction (ve) and plasma volume fraction (Vp). Three regions of interest (ROIs) were drawn by a head and neck radiologist (three years of experience, MG) who was blinded for treatment response. The ROIs were drawn manually on all imaging sections encircling solid-appearing portions of primary tumours and metastatic lymph node or nodal masses. The largest lymph node that was most favourably located and reproducible to repeated measurements was selected for the analysis. Special attention was paid not to include necrotic and cystic areas (hyper-intense areas on STIR images), large feeding vessels and surrounding normal tissue. Detection of lesions and assessing ROIs after 40 Gy in responders was difficult in 3 patients, particularly when measuring kinetic parameters. Overall, ADC after 40 Gy was measured in 16 of 17 responders and kinetic parameters were measured in 13 of 16 responders.
Tumour and representative metastatic lymph node volumes were calculated by manually encircling tumour and nodal borders on each T1 post-contrast sequence on all axial slices. Soft wear algorithm then calculated the volume by using the equation:
V = encircled area × section thickness.
Volumetric and functional data analysis
Mean value of the selected ROIs from primary tumour and metastatic lymph nodes was calculated for each parameter at each time point. In addition, relative change in each functional parameter (ADC, Ktrans, Ve and Vp) and tumour volume after 10Gy and 40 Gy was calculated according to pre-treatment values separately for tumours and lymph nodes for individual patient using the formula:
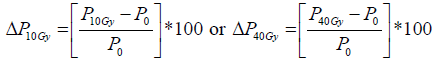
where P represents any given parameter (ADC, Ktrans, Ve, Vp or tumour volume), P10Gy represents absolute value of the parameter after 10Gy, P40Gy represents absolute value of the parameter after 40Gy and P0 absolute value of the parameter before treatment.
Follow-up and response evaluation
During therapy, toxicity was monitored on a weekly basis. After treatment completion, patients were examined for toxicity and tumour response every 2 to3 months in the first and second year and every 6 months thereafter. Radiological assessment of tumour response was scheduled as described above by using the Response Evaluation Criteria in Solid Tumours (RECIST), Version 1.1. Radiologically determined response to RCT was used to categorize patients into two groups: responders (clinically no evidence of disease and radiologically disappearance of tumour and all metastatic lymph nodes) and nonresponders (those with residual disease).
Statistical analysis
All data analysis and graphs were performed using Statistical Software program R, Version 3.4.2 (package: logistf). The continuous variables are presented by median and range. The relative changes in parameters between pre-treatment values and 10 Gy and pre-treatment values and 40 Gy are expressed in percentage (%). Due to small sample size and rare data event Firth penalized logistic regression was used to identify the independent predictors for treatment response [31]. Prognostic models for treatment response were calculated separately for tumour and neck lymph nodes parameters. Survival was calculated using Kaplan-Meier curves. The Spearman’s rank correlation coefficient was used to investigate the correlations among the parameters. Twotailed p values less than 0.05 were considered statistically significant.
Results
Baseline and survival analysis
Baseline demographic and clinical data of twenty consecutive patients (19 men, 1 woman) aged from 46 to 67 (mean age, 58) are summarised in Table 1. None of the patients had systemic disease at the time of presentation. All patients completed CRT according to the protocol. Overall, 80 MR examinations were performed. No adverse effects were observed after contrast administrations. All MR data acquisitions had good quality DWI and DCE-MRI data. Using RECIST v.1.1 criteria, 17 patients were classified as responders and 3 as non-responders. The illustrative example of a responder and a nonresponder with pre-treatment, 10 Gy and 40 Gy post-contrast MR images, ADC maps and colour-coded Ktrans, Ve and Vp maps are shown in Figures 1 and 2 respectively.
| Patient | Sex/Age (yrs) | Tumor location | TNM |
|---|---|---|---|
| 1 | M/ 53 | Oropharynx | T4N1 |
| 2 | M/ 67 | Hypopharynx | T3N1 |
| 3 | M/ 66 | Hypopharynx | T3N2b |
| 4 | M/ 56 | Oropharynx | T3N2b |
| 5 | M/ 49 | Oropharynx | T2N2b |
| 6 | M/ 57 | Oropharynx | T4N2c |
| 7 | M/ 59 | Hypopharynx | T4N2b |
| 8 | M/ 60 | Oropharynx | T3N2b |
| 9 | M/ 58 | Oropharynx | T4aN2b |
| 10 | M/ 53 | Oropharynx | T4N2c |
| 11 | M/ 64 | Oropharynx | T3N2c |
| 12 | M/ 56 | Hypopharynx | T3N2b |
| 13 | M/ 65 | Oropharynx | T2N2b |
| 14 | M/ 53 | Hypopharynx | T4N2c |
| 15 | M/ 66 | Oropharynx | T3N2b |
| 16 | M/ 65 | Oropharynx | T3N2a |
| 17 | M/ 46 | Oropharynx | T3N3 |
| 18 | M/ 67 | Hypopharynx | T3N1 |
| 19 | F/ 58 | Oropharynx | T3N1 |
| 20 | M/ 48 | Hypopharynx | T3N1 |
Table 1: Baseline patients's demographic and clinical data.

Figure 1: MR images of a 53-year old male with squamous cell carcinoma of the hypopharynx that completely responded to chemoradiotherapy (CRT). Axial postcontrast T1 images, co-registred and corresponding apparent diffusion coefficient (ADC) maps and color-coded dynamic contrast-enhanced MRI derived volume transfer constant (Ktrans), extracellular extravascular fraction (Ve) and plasma volume fraction (Vp) maps in the area of the tumour (arrows) are shown. Top: before treatment; middle: after 10 Gray (Gy); and bottom: after 40 Gy of CRT.

Figure 2: MR images of a 52-year old male with squamous cell carcinoma of the oropharynx with residual disease (non- responder) after chemoradiotherapy (CRT). Axial post-contrast T1 images, co-registred and corresponding apparent diffusion coefficient (ADC) maps and color-coded dynamic contrast-enhanced MRI derived volume transfer constant (Ktrans), extracellular extravascular fraction (Ve) and plasma volume fraction (Vp) maps in the area of the tumour (arrows) are shown. Top: before treatment; middle: after 10 Gray (Gy); and bottom: after 40 Gy of CRT.
The median follow-up was 15.1 months (range, 2.6 – 41.2 months). Disease reappearance was diagnosed in 5 patients: 3 (15 %) patients had local recurrence at primary site and 2 patients (10%) developed distant metastases (lungs). Two patients died of acute respiratory insufficiency due to acute lower respiratory tract infection (2.6 months after CRT) and of massive bleeding from recurrent tumour (10.6 months after CRT). Median disease-free survival (DFS) was 6.5 months (range, 4.2 – 25.3 months) and a median overall survival time 15.1 months (range, 2.6 – 41.2 months).
Absolute values and relative changes of DWI and DCE-MR parameters as well as tumour and lymph node volumes at baseline and after 10 Gy and 40 Gy separately for the responders and nonresponders are shown in Tables 2 and 3, respectively.
| Baseline | 10 Gy | 40 Gy | |||||||
|---|---|---|---|---|---|---|---|---|---|
| Responders | Nonresponders | Responders | Nonresponders | Responders | Nonresponders | ||||
| Measurements from primary tumors | |||||||||
| ADC (x 10-3 mm2/s) | 0.77 (0.62-0.91) | 1.02 (0.96-1.07) | 0.98 (0.81-1.49) | 1.07 (0.98-1.14) | 1.33 (0.85-1.81) | 1.17 (1.05-1.36) | |||
| Ktrans (min-1) | 0.48 (0.23-0.79) | 0.24 (0.13-0.24) | 0.18 (0.06-0.39) | 0.25 (0.12-0.67) | 0.12 (0.03-0.52) | 0.10 (0.03-0.16) | |||
| Ve (NA) | 0.31 (0.17-0.64) | 0.22 (0.15-0.37) | 0.26 (0.09-0.71) | 0.24 (0.09-0.31) | 0.30 (0.13-0.87) | 0.25 (0.04-0.36) | |||
| Vp (NA) | 0.15 (0.07-0.43) | 0.20 (0.06-0.26) | 0.24 (0.11-0.43) | 0.17 (0.12-0.22) | 0.17 (0.11-0.40) | 0.19 (0.11-0.24) | |||
| Tumor volume (ml) | 8.84 (6.61-54.94) | 50.83 (0.55-44.55) | 44.47 (0.78-39.10) | 34.34 (5.35-57.40) | 1.69 (0.00-21.33) | 3.72 (2.96-24.44) | |||
| Measurments from metastatic lymph nodes | |||||||||
| ADC (x 10-3 mm2/s) | 0.84 (0.54-0.90) | 1.11 (1.06-1.11) | 1.12 (0.91-1.52) | 1.07 (1.03-1.11) | 1.21 (1.00-1.67) | 1.27 (1.08-1.41) | |||
| Ktrans (min-1) | 0.55 (0.35-1.25) | 0.23 (0.14-0.23) | 0.14 (0.04-0.36) | 0.15 (0.11-0.43) | 0.18 (0.07-0.62) | 0.15 (0.03-0.22) | |||
| Ve (NA) | 0.40 (0.23-0.61) | 0.22 (0.11-0.27) | 0.22 (0.04-0.43) | 0.28 (0.18-0.34) | 0.28 (0.10-0.50) | 0.33 (0.04-0.35) | |||
| Vp (NA) | 0.19 (0.05-0.43) | 0.34 (0.08-0.53) | 0.41 (0.18-0.57) | 0.23 (0.19-0.55) | 0.26 (0.03-0.52) | 0.21 (0.06-0.32) | |||
| Tumor volume (ml) | 2.49 (0.65-28.15) | 11.14 (2.37-134.98) | 2.12 (0.77-24.67) | 14.97 (0.94-91.93) | 1.38 (0.27-9.30) | 7.08 (0.40-29.02) | |||
Table 2: DWI and DCE-MR parameters as well as the volume (median and range) measured from primary tumors and metastatic lymph nodes at baseline and after 10 Gy and 40 Gy separate according to response.
| Δ10 Gy (%) | Δ40 Gy (%) | |||
|---|---|---|---|---|
| Responders | Nonresponders | Responders | Nonresponders | |
| Measurements from primary tumors | ||||
| ADC | 35.37 (8.52 to 109.90) | 4.90 (1.77 to 6.84) | 73.40 (17.85 to 121.57) | 21.81 (2.65 to 27.74) |
| Ktrans | -50.22 (-90.91 to -25.11) | 5.49 (-7.69 to 179.20) | -64.07 (-95.00 to 6.16) | -35.58 (-86.08 to -20.77) |
| Ve | -26.97 (-76.74 to 126.80) | -35.14 (-41.18 to 40.91) | -4.71 (-67.18 to 178.91) | -2.70 (-73.86 to 13.64) |
| Vp | 50.21 (-72.97 to 357.1) | 8.50 (-35.36 to 100.0) | 10.31 (-71.59 to 410.0) | -5.00 (-7.61 to 83.33) |
| Tumor volume | -15.98 (-81.29 to 254.5) | -19.06 (-37.50 to 12.93) | -72.60 (-100.00 to -15.97) | -55.22 (-93.23 to -51.92) |
| Measurements from metastatic lymph nodes | ||||
| ADC | 38.27 (12.35 to 132.31) | -2.83 (-3.60 to 0.00) | 42.35 (11.11 to 129.23) | 14.41 (1.89 to 27.03) |
| Ktrans | -67.50 (-93.44 to 38.46) | 7.14 (-52.17 to 86.96) | -66.67 (-84.80 to 1.64) | -34.78 (-78.57 to -4.35) |
| Ve | -43.48 (-88.99 to 19.44) | 3.70 (-18.18 to 209.09) | -22.22 (-70.21 to 52.17) | 22.22 (-63.64 to 59.09) |
| Vp | 126.67 (-57.14 to 400.00) | 61.76 (-59.60 to 137.50) | 30.00 (-82.35 to 540.0) | -38.24 (-39.62 to -25.00) |
| Tumor volume | 7.14 (-65.18 to 31.31) | -31.89 (-60.34 to 34.38) | -52.68 (-82.80 to -35.39) | -78.50 (-83.12 to -36.45) |
Table 3: Relative changes of DWI and DCE-MR parameters as well as the volume median (median and range) measured from primary tumors and metastatic lymph nodes from baseline to 10 Gy and 40 Gy separate according to response.
Logistic regression analysis
Firth penalized logistic regression analysis was performed to identify significant prognostic factors for treatment response (Table 4). In the pre-treatment measurements, responders showed lower ADC values in primary tumours (0.77; 0.62 – 0.91 x 10⁻³ mm2/s) and lymph nodes (0.84; 0.54 – 0.90 x 10⁻³ mm2/s) compared with non-responders (1.02; 0.96 – 1.07 x 10⁻³ mm2/s in primary tumours and 1.11; 1.06 – 1.11 x 10⁻³ mm2/s in lymph nodes). However, the difference was not significantly different (p = 0.195 and p = 0.178, respectively). Responders also showed a non-significantly higher Ktrans in both sites (0.48; 0.23 – 0.79 min-1; p = 0.634 and 0.55; 0.35 – 1.25min-1; p = 0.597, respectively).
| Baseline (p value) | ΔP10Gy/ ΔP40Gy (p value) | |
| Measurements from primary tumor site | ||
| ADC | 0.195 | 0.508/ 0.079 |
| Ktrans | 0.634 | 0.047/ 0.875 |
| Ve | 0.962 | 0.066/ 0.357 |
| Vp | 0.846 | 0.552/ 0.882 |
| Volume | 0.741 | 0.751/ 0.345 |
| Measurements from lymph node site | ||
| ADC | 0.178 | 0.937/ 0.092 |
| Ktrans | 0.597 | 0.210/ 0.268 |
| Ve | 0.452 | 0.204/ 0.625 |
| Vp | 0.571 | 0.927/ 0.567 |
| Volume | 0.440 | 0.272/ 0.493 |
Legend: ΔP10Gy, relative change in parameters after 10 Gy; ΔP40Gy relative change in parameters after 40 Gy; ADC, Apparent diffusion coefficient; Ktrans, volume transfer constant; ve, extracellular extravascular volume fraction; Vp, plasma volume fraction.
Table 4: Firth logistic regression analysis of prognostic factors for treatment response.
In regard to the relative changes after 10 Gy (compared to baseline measurements), the analysis identified that the reduction of Ktrans, measured from primary tumour was a weak significant predictor of treatment response (p =0.047; odds ratio 0.97, 95% CI 0.9997 – 0.8706) with a median reduction of 50.2% (-25.1 to -90.9 %) in responders vs. 5.5 % (-7.7 to 179.2%) in non-responders. In addition, responders showed a borderline significant reduction of Ve after 10 Gy, measured form primary tumours (-26.9%; 76.7 to -126.8%; p = 0.066 in responders vs. -35.1 %; -41.2 to 40.9%) in non-responders). A relative increase in ADC after 10 Gy neither from primary tumours neither from metastatic lymph nodes was not identified as a significant prognostic factor (35.4%; 8.5 – 109.9.0%; p = 0.508 and 38.3%; 12.4 – 132.3%; p = 0.937, respectively for responders vs. 4.9%; 1.8 to 6.8 %; p = 0.508 and -2.8 %; -3.6 to 0.00 %; p = 0.937 for non-responders).
Analysis of relative changes in primary tumours after 40 Gy (compared to baseline measurements) showed a borderline significant increased (p = 0.079) ADC in responders compared to non-responders (73.4%; 17.8 – 121.6%; vs. 21.8 %; 2.7 to 27.7 %, respectively). Changes in Ktrans (-64.1%; -95.0 to -6.2% in responders vs. -35.6 %; -86.1 to -20.8 % in non-responders) and Ve (-4.7%; -67.2 to -178.9 in responders vs. -2.7 %; -73.9 to 13.6 % in non-responders) were not significant (p = 0.875 and p = 0.357, respectively). No parameter or any measured change from lymph nodes turned out to be significant. In addition, tumour and lymph nodes volumes failed to show any predictive value of treatment response.
Correlation analysis
A significant and strong positive correlation between Ktrans and ve before treatment (p = 0.033; r = 0.65) and also after 10 Gy (P < 0.001; r = 0.83), when measured from lymph nodes was observed. No such correlation was observed for primary tumour measurements (pbaseline = 1.00; p10Gy = 0.250). A strong negative correlation was also noticed between lymph node Vp and tumour volume after 10 Gy (p = 0.027; r = −0.66). In addition, Ve and ADC showed no correlation at any time point, neither from primary tumours (pbaseline = 1.00; p10Gy = 1.00) nor lymph nodes (pbaseline = 0.780; p10Gy = 0.76).
Discussion
In conclusion, our study shows that DW and DCE-MRI can be used for the assessment of early biological changes that occur in HNSCC during CRT. A reduction of Ktrans and ve after only five fractions of radiotherapy (i.e. at the end of the first week of CRT) and increased ADC after 4 weeks may indicate a good response to cisplatin-based CRT. This correlates with early changes in tumour vascularity and cellularity. Particular combination of changes in functional parameters early during treatment could indicate the need for modification (to intensify/ de-intensify) of the existing treatment scenario in order to maximize the chance of favourable outcome or to reduce unnecessary toxicity [6,14]. In addition, a more intensive follow-up could be performed in patients with ‘high-risk’ combination(s) of functional parameters in order to address eventual treatment failure at still salvageable stage [14].
Our results showed there was a significant reduction of Ktrans after 10 Gy in responders, when measured from primary tumours. In nonresponders, there was either no change (in primary tumours) or a rise in Ktrans (in lymph nodes). Our results are in agreement with those of Jakubovic et al. who also documented a reduction of Ktrans in brain metastases of responders after one week of RT [32]. In addition, Kim et al. reported tumour reduction of Ktrans in human head and neck tumour xenografts after only three days of RT or chemotherapy [24] and the same was observed by Moestue et al. in aggressive, highly vascularised breast xenografts treated with combination of chemotherapy and bevacizumab [33].
As the Ktrans is a useful measure of perfusion and permeability, its reduction may be explained by the difference in radiation susceptibility of intra-tumoural endothelial cells between individual tumours. More effective killing of radiosensitive intra-tumoural endothelial cells increases perfusion and permeability during the first days of CRT. Thereafter, the survived, RT-resistant endothelial cells repopulate, which in turn leads to lower permeability, lower micro-vessel density and a reduction in Ktrans value [24]. The latter has already been demonstrated by Moon et al. who confirmed a positive correlation between an increased permeability surface area and Ktrans. [34]. This is probably due to radiation-induced early inhibition of angiogenesis, secondary to tumour cell killing, that happens after one week of therapy and can increase the chances of response [35,36]. In addition, a more effective therapy was found to lead to a more rapid endothelial cell killing and, consequently, reassembling of tumour matrix [24]. Conversely, Baer et al. reported that patients with large HNSCC with decreased Ktrans after two weeks of therapy may have a shorter survival period [26] However, in their study Ktrans was measured as a mean value from the whole tumour, including the necrotic parts. Cao et al. reported that locally controlled tumours showed an increase in the blood volume after two weeks of CRT [25]. The observed discrepancy in results might be explained with different parameters under evaluation, as the Ktrans represents blood plasma-tumour volume transfer constant and blood volume only reflects the fraction of tissue volume occupied by blood.
Reduction of Ve showed a statistically significant trend after 10 Gy, when measured from primary tumours. Studies on Ve are scarce and, to our knowledge, no study on HNSCC confirmed the predictive role of this parameter for early response to CRT. In general, Ve reflects EES volume which represents a supportive frame made out of interstitial fluid and connective tissue. The composition of tumour EES significantly differs from that of normal tissues because the former has larger interstitial space, higher collagen concentration, elevated interstitial pressure and higher diffusion coefficient of macromolecules [37]. These characteristics are responsible for accumulation of injected CA in EES. Thus, Ve probably represents the amount of CA delivered to and accumulated within the interstitial space of the tumour [38]. In addition, Ve depends on the Ktrans and is inversely dependent to Kep  , with Kep representing only vessel permeability and surface area. Kep may be positively correlated with stimulation of new vessel growth caused by increased levels of VEGF, which in turn suggests that lower Kep may reflect lower CA delivery to EES from plasma [39,40]. Therefore, the reduction of Ve (similarly as with Ktrans) in responders in our study was probably due to the difference in radiation sensitivity of endothelial cells in tumour vessels that led to lower permeability which reduced the amount of macromolecules of CA in the EES.
Another important finding in the present study was a strong and positive correlation between Ve and Ktrans, measured from lymph nodes after 10 Gy and also at baseline. Ng et al. [41] and Han et al. [38] also demonstrated a positive correlation between these two parameters, though no previous study has demonstrated such correlation early during CRT. Therefore, we believe the positive correlation between Ve and Ktrans found in our study may be due to reduced passage (Ktrans) and accumulation (Ve) of CA in tumour EES of responders.
A strong negative correlation between Vp and volume of metastatic lymph nodes was shown in responders after 10 Gy. Although there was a slight rise of Vp and no change in node volume after 10 Gy in responders, the differences were not significant. Lis et al. showed that a decline in Vp, that reflects the volume of plasma, in osseous spine metastasis only one hour after high-dose image-guided RT probably represents reduction of vascularity in successfully treated lesions [42]. The correlation in our study could be an indicator of higher overall micro-vessel density due to repopulation of RT-resistant endothelial cells in otherwise unchanged node volume.
In addition, an increase in ADC after 40 Gy in primary tumours was of borderline significance for favourable treatment response, while the difference after 10 Gy was not significant. Also in other studies, a lower rise in ADC during the treatment predicted poor prognosis [18-22]. DW MRI is a quantitative imaging technique that measures diffusion of water molecules. Thus, in tissues with high cellularity (e.g. tumours), diffusion of water molecules is limited, showing as low ADC [36]. It has been postulated that CRT resulted in rise of ADC due to tumour cells killing and formation of necrosis [14].
No correlation between DCE- and DW- MRI derived parameters was noticed in our study. This is in agreement by a study of Choi et al. that showed no correlation between ADC and permeability parameters (Ktrans and Ve) in grading gliomas. Although theoretically ADC and EES (ve) should be interdependent, ADC value is probably affected by various other physiologic parameters, such as tumor cellularity, capillary bed perfusion and permeability [43]. On the contrary, in HNSCC Han et al. showed a positive correlation between Ktrans and ADC and between Ve and ADC [38].
Our study has several limitations which have to be addressed. The main limitation is the small sample size, multiple parameters analysed and an uneven distribution of treatment outcome that made the statistical analysis difficult. Therefore, no firm conclusions can be made and larger series with a longer follow-up is needed to confirm our results. However, our series is relatively homogeneous in regard to primary tumour site, histological characteristics and therapy when compared to other studies conducted in HNSCC. Majority of patients had advanced-stage oropharyngeal or hypopharyngeal SCC as those patients are most often offered non-surgical treatment (contrary to patients with advanced oral cavity or laryngeal primaries). Second, the DWI- and DCE-MRI-derived parameters were calculated as a mean value from the three most representative ROIs, drawn by an experienced head and neck radiologist. Studies have shown that heterogeneity of head and neck tumours, represented by skewness and standard deviation of Ktrans, may better correlate with prognosis [44]. Therefore, measurements that would cover the whole tumour volume may better describe tumour biology or predict prognosis. Furthermore, in DCEMRI non-specific nature of vessel leakage can lead to false-negative and false-positive results [13]. Finally, in all three patients with tonsillar cancer, the measurements of DCE-MRI derived parameters were only possible from lymph nodes but not from primary tumour. Imaging of tumours arising in palatine tonsils represents a challenge since they have homogenous appearance on post-contrast T1 imaging similar to normal tissue [45]. In the future, inclusion of tonsillar cancers in the analysis of DWI-MRI parameters should be carefully reconsidered.
Conclusion
The results of our study show that changes in Ktrans, ve and ADC early during cisplatin-based CRT of HNSCC may reflect some changes in the tumour vascularity and cellularity. Therefore, functional MR imaging of HNSCC early during treatment could be of value to predict tumour response before the actual morphologic changes occur.
Acknowledgment
The authors thank Associate Professor Sotirios Bisdas MD, Ph.D. of University College London Hospitals NHS for help with establishing the DCE- and DWI-MR protocols.
Declaration of Interest
The authors of this manuscript certify that they have no affiliations with or involvement in any organization or entity with any financial interest or non-financial interest in the subject matter or materials discussed in this manuscript. The authors state that this work has not received any funding.
References
- Ferlay J, Soerjomataram I, Dikshit R, Eser S, Mathers C, et al. (2015) Cancer incidence and mortality worldwide: Sources, methods and major patterns in GLOBOCAN 2012. Int J Cancer 136: 359-386.
- Strojan P (2010) Novosti v radioterapiji tumorjev glave in vratu. Zdr Vestn 79: 339-353.
- Winquist E, Agbassi C, Meyers BM, Yoo J, Chan KK (2017) Systemic therapy in the curative treatment of head and neck squamous cell cancer: a systematic review. J Otolaryngol Head Neck Surg 46: 29.
- Leeman JE, Li J, Pei X, Venigalla P, Zumsteg ZS, et al. (2017) Patterns of treatment failure and postrecurrence outcomes among patients with locally advanced head and neck squamous cell carcinoma after chemoradiotherapy using modern radiation techniques. JAMA Oncol 3: 1487-1494.
- Pignon JP, Maître A le, Maillard E, Bourhis J (2009) Meta-analysis of chemotherapy in head and neck cancer (MACH-NC): An update on 93 randomised trials and 17,346 patients. Radiother Oncol 92: 4-14.
- Schwartz DL, Garden AS, Thomas J, Chen Y, Zhang Y, et al. (2012) Adaptive radiotherapy for head-and-neck cancer: initial clinical outcomes from a prospective trial. Int J Radiat Oncol Biol Phys 83: 986-993.
- King AD, Thoeny HC (2016) Functional MRI for the prediction of treatment response in head and neck squamous cell carcinoma: potential and limitations. Cancer Imaging 16: 1-8.
- Bisdas S, Rumboldt Z, Surlan-Popovic K, Baghi M, Koh TS, et al. (2010) Perfusion CT in squamous cell carcinoma of the upper aerodigestive tract: long-term predictive value of baseline perfusion CT measurements. Am J Neuroradiol 31: 576-581.
- Surlan-Popovic K, Bisdas S, Rumboldt Z, Koh TS, Strojan P (2010) Changes in perfusion CT of advanced squamous cell carcinoma of the head and neck treated during the course of concomitant chemoradiotherapy. Am J Neuroradiol 31: 570-575.
- Pietsch C, de Galiza Barbosa F, Hullner MW, Schmid DT, Haerle SK, et al. (2015) Combined PET/CT-perfusion in patients with head and neck cancers might predict failure after radio-chemotherapy: a proof of concept study. BMC Med Imaging 15: 60.
- Garibaldi C, Ronchi S, Cremonesi M., Gilardi L, Travaini L, et al. (2017) Interim 18F-FDG PET/CT during chemoradiation therapy in the management of head and neck cancer patients: a systematic review. Int J Radiat Oncol Biol Phys 98: 555-573.
- Szyszko TA, Cook GJR (2018) PET/CT and PET/MRI in head and neck malignancy. Clin Radiol 73: 60-69.
- Jansen JF, Parra C, Lu Y, Shukla-Dave A (2016) Evaluation of head and neck tumors with functional MRI. Magn Reson Imaging Clin N Am 24: 123-133.
- Yuan J, Lo G, King AD (2016) Functional magnetic resonance imaging techniques and their development for radiation therapy planning and monitoring in the head and neck cancers. Quant Imaging Med Surg 6: 430-448.
- King AD, Yeung DKW, Yu K, Mo FKF, Hu C, et al. (2010) Monitoring of treatment response after chemoradiotherapy for head and neck cancer using in vivo 1H MR spectroscopy. Eur Radiol 20: 165-172.
- Razek AAK, Poptani H (2013) MR spectrsocopy of head and neck cancer. Eur J Radiol 82: 982-989.
- Koh DM, Lee JM, Bittencourt LK, Blackledge M, Collins DJ (2016) Body Diffusion-weighted MR imaging in oncology. Magn Reson Imaging Clin N Am 24: 31-44.
- Vandecaveye V, Dirix P, De Keyzer F, Op de Beeck K, Vander Poorten V, et al. (2010) Predictive value of diffusion-weighted magnetic resonance imaging during chemoradiotherapy for head and neck squamous cell carcinoma. Eur Radiol 20: 1703-1714.
- Hong J, Yao Y, Zhang Y, Tang T, Zhang H, et al. (2013) Value of magnetic resonance diffusion-weighted imaging for the prediction of radiosensitivity in nasopharyngeal carcinoma. Otolaryngol Neck Surg 149: 707-713.
- King AD, Chow KK, Yu KH, Mo FKF, Yeung DKW, et al. (2013) Head and neck squamous cell carcinoma: diagnostic performance of diffusion-weighted mr imaging for the prediction of treatment response. Radiol 266: 531-538.
- Matoba M, Tuji H, Shimode Y, Toyoda I, Kuginuki Y, et al. (2014) Fractional change in apparent diffusion coefficient as an imaging biomarker for predicting treatment response in head and neck cancer treated with chemoradiotherapy. Am J Neuroradiol 35: 379-385.
- Kim S, Loevner L, Quon H, Sherman E, Weinstein G, et al. (2009) Diffusion-weighted magnetic resonance imaging for predicting and detecting early response to chemoradiation therapy of squamous cell carcinomas of the head and neck. Clin Cancer Res 15: 986-994.
- Gaddikeri S, Gaddikeri RS, Tailor T, Anzai Y (2015) Dynamic contrast-enhanced mr imaging in head and neck cancer: techniques and clinical applications. Am J Neuroradiol 37: 588-595.
- Kim H, Hartman YE, Zhai G, Chung TK, Korb ML, et al. (2015) Dynamic contrast-enhanced MRI evaluates the early response of human head and neck tumor xenografts following anti-EMMPRIN therapy with cisplatin or irradiation. J Magn Reson Imaging 42: 936-945.
- Cao Y, Popovtzer A, Li D, Chepeha DB, Moyer JS, et al. (2008) Early prediction of outcome in advanced head-and-neck cancer based on tumor blood volume alterations during therapy: a prospective study. Int J Radiat Oncol Biol Phys 72: 1287-1290.
- Baer AH, Hoff BA, Srinivasan A, Galbán CJ, Mukherji SK (2015) Feasibility analysis of the parametric response map as an early predictor of treatment efficacy in head and neck cancer. Am J Neuroradiol 36: 757-762.
- Park JJ, Kim CK, Park SY, Simonetti AW, Kim E, et al. (2014) Assessment of early response to concurrent chemoradiotherapy in cervical cancer: value of diffusion-weighted and dynamic contrast-enhanced MR imaging. Magn Reson Imaging 32: 993-1000.
- Montelius M, Spetz J, Jalnefjord O, Berger E, Nilsson O, et al. (2018) Identification of potential mr-derived biomarkers for tumor tissue response to177lu-octreotate therapy in an animal model of small intestine neuroendocrine tumor. Transl Oncol 11: 193-204.
- Jeon TY, Kim CK, Kim JH, Im GH, Park BK, et al. (2015) Assessment of early therapeutic response to sorafenib in renal cell carcinoma xenografts by dynamic contrastenhanced and diffusion-weighted MR imaging. Br J Radiol 88: 20150163.
- Strojan P, Zadnik V, Šifrer R, Lanišnik B, Didanović V, et al. (2015) Incidence trends in head and neck squamous cell carcinoma in Slovenia, 1983-2009: role of human papillomavirus infection. Eur Arch Oto-Rhino-Laryngology 272: 3805-3814.
- Heinze G, Schemper M (2002) A solution to the problem of separation in logistic regression. Stat Med 21: 2409-2419.
- Jakubovic R, Sahgal A, Soliman H, Milwid R, Zhang L, et al. (2014) Magnetic resonance imaging-based tumour perfusion parameters are biomarkers predicting response after radiation to brain metastases. Clin Oncol 26: 704-712.
- Moestue SA, Huuse EM, Lindholm EM, Bofin A, Engebraaten O, et al. (2013) Low-Molecular contrast agent Dynamic Contrast-Enhanced (DCE)-MRI and Diffusion-Weighted (DW)-MRI in early assessment of bevacizumab treatment in breast cancer xenografts. J Magn Reson Imaging 38: 1043-1053.
- Moon J, Kim JH, Choi D, Yang J, Lee MW, et al. (2016) Correlation of quantitative dynamic contrast-enhanced MRI with microvascular density in necrotic, partial necrotic, and viable liver tumors in a rabbit model. J Appl Clin Med Phys 17: 1-10.
- Lu F, Li YQ, Aubert I, Wong CS (2012) Endothelial cells regulate p53-dependent apoptosis of neural progenitors after irradiation. Cell Death Dis 3: e324.
- Kargiotis O, Geka A, Rao JS, Kyritsis AP (2010) Effects of irradiation on tumor cell survival, invasion and angiogenesis. J Neurooncol 100: 323-338.
- Jain RK (1990) Vascular and interstitial barriers to delivery of therapeutic agents in tumors. Cancer Metastasis Rev 9: 253-266.
- Han M, Kim SY, Lee SJ, Choi JW (2015) The correlations between MRI perfusion, diffusion parameters, and 18F-FDG PET metabolic parameters in primary head-and-neck cancer. Medicine 94: 2141.
- Jansen JF, Carlson DL, Lu Y, Stambuk HE, Moreira AL, et al. (2012) Correlation of a priori DCE-MRI and 1H-MRS data with molecular markers in neck nodal metastases: Initial analysis. Oral Oncol 48: 717-722.
- Ng SH, Liao CT, Lin CY, Chan SC, Lin, YC, et al. (2016) Dynamic contrast-enhanced MRI, diffusion-weighted MRI and 18F-FDG PET/CT for the prediction of survival in oropharyngeal or hypopharyngeal squamous cell carcinoma treated with chemoradiation. Eur Radiol 26: 4162-4172.
- Ng SH, Lin CY, Chan SC, Lin YC, Yen TC, et al. (2014) Clinical utility of multimodality imaging with dynamic contrast-enhanced MRI, diffusion-weighted MRI, and18F-FDG PET/ CT for the prediction of neck control in oropharyngeal or hypopharyngeal squamous cell carcinoma treated with chemoradiation. PLoS One 9: e115933.
- Lis E, Saha A, Peck KK, Zatcky J, Zelefsky MJ, et al. (2017) Dynamic contrast-enhanced magnetic resonance imaging of osseous spine metastasis before and 1 hour after high-dose image-guided radiation therapy. Neurosurg Focus 42: e9.
- Choi HS, Kim AH, Ahn SS, Shin NY, Kim J, et al. (2013) Glioma grading capability: Comparisons among parameters from dynamic contrast-enhanced MRI and ADC value on DWI. Korean J Radiol 14: 487-492.
- Shukla-Dave A, Lee NY, Jansen JFA, Thaler HT, Stambuk HE, et al. (2012) Dynamic contrast-enhanced magnetic resonance imaging as a predictor of outcome in head and neck squamous cell carcinoma patients with nodal metastases. Int J Radiat Oncol Biol Phys 82: 1837-1844.
- Cinar F (2004) Significance of asymptomatic tonsil asymmetry. Otolaryngol Neck Surg 131: 101-103.
Citation: Garbajs M, Strojan P, Šurlan-Popovič K (2018) Diffusion Weighted and Dynamic Contrast-Enhanced MRI as a Predictor of Treatment Response in Head and Neck Cancer to Chemoradiotherapy: The Role of Early Intratreatment Scanning. OMICS J Radiol 7:296. DOI: 10.4172/2167-7964.1000296
Copyright: © 2018 Garbajs M, et al. This is an open-access article distributed under the terms of the Creative Commons Attribution License, which permits unrestricted use, distribution, and reproduction in any medium, provided the original author and source are credited.
Select your language of interest to view the total content in your interested language
Share This Article
Open Access Journals
Article Tools
Article Usage
- Total views: 5385
- [From(publication date): 0-2018 - Oct 14, 2025]
- Breakdown by view type
- HTML page views: 4433
- PDF downloads: 952