Effects of N and P Fertilizer Application Rates on Yield and Economic Performance of Upland Rice in Tselemti District of N.W Tigray, Ethiopia
Received: 27-Jan-2018 / Accepted Date: 26-Feb-2018 / Published Date: 01-Mar-2018 DOI: 10.4172/2375-4338.1000191
Abstract
Rice agronomy plays a great role in increasing and sustaining rice production and productivity. Due mainly to its relatively recent history of cultivation in Ethiopia, the scientific information available with regards to the response of rice to N and P sources of fertilizers for its production is very limited. An experiment was conducted in 2014 and 2015 in Tigray, Ethiopia, with the objectives of determining the economically optimum rates of N & P sources of fertilizer on yield of rice. Five levels of N (0, 23, 46, 69 and 138 kg N/ha) and four levels of P (0, 23, 46 and 69 kg P2O5/ha) Factorial experiment was laid out in a randomized complete block design with three replications. The interaction effects of N and P were significant (P ≤ 0.05) for grain yield, biomass yield, plant height and days to heading but not for days to maturity, harvest index and thousand seed weight. From the view point of the physical (agronomic) yield, the combined results of the experiment revealed that the combination of 138 kg N/ha and 46 kg P2O5/ha recorded maximum grain yield of 5723 kg/ha and the control (i.e. no N and no P) gave the lowest grain yield (1601 kg/ha). Unlike that of the agronomic yield, the economic analysis of the combined result of the experiment with two years and two locations revealed that the profitable mean net return of 22208.63 Birr/ha was obtained for the plot that received 69 kg N/ha and 23 kg P2O5/ha which is 11185.12 Birr more than the net returns obtained from the control (with no urea plus no DAP) which is Birr 11023.51 birr. Therefore, from the economically profitable fertilizer rate use point of view, rice farmers in Tselemti district and similar areas should use the most economically feasible fertilizer rate with highest value of marginal rate of return i.e. 69 kg N/ha with 23 kg P2O5/ha.
Keywords: Agronomic Yield; Economic Yield; Fertilizers; Marginal Rate of Return; Rice; Tigray
Introduction
Rice (Oriza sativa L. ) remains the most important crop grown in the world because of its political, economic, and social significance [1]. Rice agronomy plays a great role in increasing and sustaining rice production and productivity [2]. Soil nutrient application rates, schedule of nitrogen fertilizer application, seed rate, planting methods and rice-based cropping systems are among the major agronomic practices which limit rice productivity and production [3]. Soil nutrient management has a great role in rice production, nitrogen being the most important nutrient for rice.
Rice was introduced to Ethiopia in the 1970s and has been cultivated in small pockets of the country [4]. In spite of its uses as food and feed and adaptable to sub-merged soils, rice was not well known by majority of Ethiopian farmers due mainly to lack of information [5]. But currently, Ethiopia is fast emerging as one of the big rice-producing countries in sub-Saharan Africa [6,7]. Rice has a great potential to food security in Ethiopia due to its better productivity. According to the National Rice Research and Development Strategy of Ethiopia [6], the trend in the number of rice producing farmers, area allocated and production showed high increase especially since 2006. Area rose from 6,000 ha in 2005 to nearly 222,000 ha in 2010 and paddy production from 15,460 tons to 887,400 tons, at the same time, the number of rice farmers increased from 18,000 to more than 565,000 [6]; and out of the total national production of rice in 2009, 43.9% is produced in the Amhara regional state, 3.4% in Tigray region, 6.5% in Benshangul-Gumz, 8.3% in Oromia, and 8.5% in Gambella, 10.7% in Somalia, 18.7% Southern region. Rice is one of the strategic cereal crops of Ethiopia in alleviating poverty and insuring food security and got the nick name “Crop of the Millennium” [7]. In the near past, rice production system in Ethiopia has focused mainly on the introduction of improved varieties (mainly, the NERICA (new rice for Africa) varieties) from a range of different sources. However, as a new rice growing country, it is also important to know how rice reacts to the physical environment, farming system and to the socioeconomic livelihoods [7].
The impact of increased fertilizer use on crop production has been large [8,9]. The addition of any amount of fertilizer is interesting to farmers if and only if it is profitable through the enhancement of either yield or quality [10]. However, maximum profits are rare at maximum yields because the last increment of fertilizer to produce a little more yield may cost more than the yield increase is worth. Therefore, fertilization needs to be rationally used and economically profitable because unwise application of fertilizers negatively affects the soil fertility, future crop productivity and farmers' economy [11]. Rice has got wider adoption by Ethiopian farmers due mainly to social, economic, and environmental perspectives [5]. However, the production and productivity of the crop under farmers’ field conditions is low (about 2600 kg/ha on the average) compared to its yield levels under farmers’ conditions in other parts of the world [12]. Apparently, low soil fertility and inadequate nutrient management are among the major factors determining its yield level.
Since Tselemti wereda is rice basket of the region, detailed information on how rice reacts to fertilization and identifying the pros and cons of the rice production system is important. Besides, Maitsebri Agricultural Research Center (MyARC) was established in this district and is conducting rice research as a regional rice research coordinating center, the information contained in this study could also partially fill the gap in rice production and the questions of future productivity of the crop regarding its fertilizer needs and economic aspects of farmers in general and the poor farmers in particular. Moreover, no research has been done in this area of interest regarding the economically feasible rate of N and P fertilizers in rice production in Tigray. Therefore, this research was conducted to study the effects of different rates of N and P fertilizer on yield and yield components of rice and to determine the economically profitable rate of N and P fertilizers in rice production.
Despite its relatively recent history of cultivation, rice in Tigray is considered to be one of the strategic crops of the region in alleviating poverty mainly due to its better yield and versatile uses. However, application of fertilizer to mitigate problems of nutrient limited yields in Tigray has been based on conventional blanket recommendations. Furthermore, farmers are arguing that the price of the inorganic fertilizers is getting up. Therefore, it is important to evaluate the effects of different rates of N and P fertilizers on yield of rice and check the profitable rates.
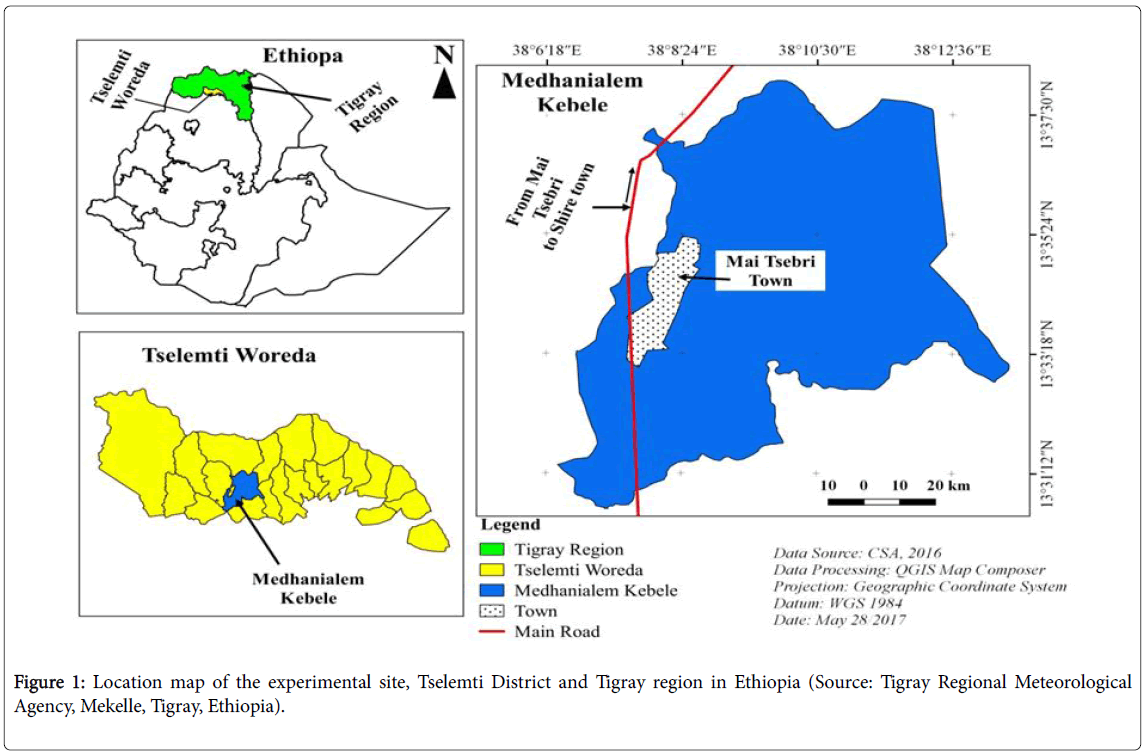
Figure 1: Location map of the experimental site, Tselemti District and Tigray region in Ethiopia (Source: Tigray Regional Meteorological Agency, Mekelle, Tigray, Ethiopia).
Materials and Methods
Description of the study area
Tigray, located in the northern tip of Ethiopia is bordered with Afar region in the East, Sudan in the West, Eritrea in the North and Amhara region in the South. It extends from 12013' to 14054' North latitude and from 36027' to 40 018' East longitudes. The study district is found in north western zone of Tigray and is 400 km west of Mekelle and 190 km north of Gonder. The field experiment was conducted at two locations: one at the research station of Maitsebri Agricultural Research Center which lies at 13005’ North Latitude and 38008’ East Longitude and has an altitude of 1350 masl and the other at Boroke village which has an altitude of 1111 masl Figure 1. The mean annual temperature ranges from a minimum of 18.3°C (November-January) to an average annual maximum of 30.9°C (February-May). It has an average (10 years) annual rainfall of 1106.16 mm. Rainfall starts in June and ends in September. Regarding the soil of the study site it is deep heavy black soil that cracks (shrink) when dry and swells when moistened.
Soil sampling and analysis
Pre-planting soil samples were randomly collected from twenty spots diagonally from a depth of 0-30 cm. The samples were composited, bagged, labeled and about 1 kg of the sample were given to Soil Laboratory for determination of selected physico-chemical properties of the soil. The texture of the soil was determined using Bouyoucos hydrometer method [13] and pH at 1:2.5 soils to water ratio was determined using a glass electrode attached to pH digital meter [14]. Soil organic carbon was determined using Walkley and Black [15] wet digestion method and total N were determined using Kjeldhal method as described by Jackson [16]. For determination of available P, the Olsen et al. [17] method was used and the cation exchange capacity (CEC) was measured using 1M-neutral ammonium acetate [16].
Experimental treatments, design and procedures
The fertilizer treatments considered in the study consisted of five levels of N (0, 23, 46, 69 and 138 kg N/ha) and four levels of P (0, 23, 46 and 69 kg P2O5/ha). The source of N was urea whose chemical formula is CO(NH2)2; and the source of P was TSP (Triple Superphosphate) and its chemical formula is Ca(H2PO4)2. The experiment was conducted using a 5 × 4 factorial experiment laid out in a randomized complete block design in three replications and a total of 20 treatments. The field was oxen plowed three times before laying the experimental plots on the field. A 2 m × 3 m (6 m2) plot size was used as an experimental unit. The blocks were separated by 1.5 m whereas the plots within a block were separated by 1 m. The rice variety called Maitsebri-1 (released by the center in 2014) was used as a testing material. Planting was made by hand drilling the seeds at a seed rate of 70 kg/ha and row spacing of 20 cm. Nitrogen was applied in three equal splits, i.e. the first one-third as basal at planting; the second one-third top dressed at maximum tillering and the final one-third top dressed at the panicle initiation. Unlike N, the total dose of P was applied basal as Triple Super Phosphate (TSP, 20% P) at planting. All data collected from the net plot size were subjected to analysis of variance (ANOVA) following a procedure appropriate to RCBD [18] using GenStat statistical software; GenStat, 2009 [19].
Yield and agronomic data collection and analysis
Days to heading (DH) was done by counting the number of days from the time of sowing to 50% heading whereas days to maturity (DM) was done by counting the number of days from the time of sowing to 85% physiological maturity. Plant height (PH) was measured using a meter from the soil level to the tip of the top spike on the panicle on 10 random plants at physiological maturity. Biomass yield was determined after harvesting the plots close to the ground level by hand using sickles and weighing them using a sensitive balance. Grain yield was determined after threshing the plants harvested from the net (1.6 m by 2.6 m) plots to avoid border effects after air drying at the field. Thousand seed weight was determined by counting 1000 seeds from the grain yield of each plot and weighing using a sensitive balance in gram basis. Analysis of variance was carried out for the yield and yield components studied following statistical procedures appropriate for the experimental design using GenStat computer software (GenStat 16th version). Whenever treatment effects were significant, the means were separated using Duncan’s Multiple Range Test (DMRT) procedures. Second year data for the Boroke experiment was not included because there was high erosion over the experiment due to excessive rainfall.
Results and Discussion
Physical and chemical characteristics of soil
Soil texture, pH, total N, cation exchange capacity, organic carbon, and exchangeable cations were determined for the composite soil samples collected from the experimental field at 0-30 cm depth before sowing of rice and also after harvesting of rice. Analytical results of the composite surface soil before sowing of rice indicated that the soil was clay in texture with 10% sand, 23% silt and 67% clay. The pH of the soil was pH 6.3 (Table 1) which is slightly acidic and highly suitable for rice production, as rice can grow well over a relatively wide pH range of 5 to 7.5, although the best soil is with slightly acidic pH of 5.5 to 6.6 [12]. Tekalign et al. [20] classified soil N availability of <0.05% as very low, 0.05-0.12% as poor, 0.12-0.25% as moderate and >0.25% as high. The Netherlands commissioned study by Ministry of Agriculture and Fisheries (1995) also classified soil contents as follows: 1) for total N (%) >0.300, 0.226-0.300, 0.126-0.225, 0.050-0.125 and <0.050 as very high, high, medium, low and very low, respectively, 2) for OC contents (%) >3.50, 2.51-3.5, 1.26-2.50, 0.60-1.25 and <0.60 as very high, high, medium, low and very low, respectively. Accordingly, taking into consideration the respective limits set by the Netherlands commissioned by the Ministry of Agriculture (1995) and Tekalign et al. [20], the total N, organic carbon and C:N ratio of the soil in the study area is low.
| Soil characteristics | Values | Rank | Reference |
|---|---|---|---|
| pH (1:2.5 H2O) | 6.3 | Slightly acidic | [20] |
| Total N (%) | 0.094 | Low | [20] |
| OC (%) | 0.983 | Low | [20] |
| C: N Ratio | 10.15 | Low | [20] |
| Available P | 3.8 | Very low | [17] |
| CEC (cmol/kg) | 65.2 | High | [21] |
| Na (cmol/kg) | 123 | High | [21] |
| Mg (cmol/kg) | 11.5 | High | [21] |
| K (cmol/kg) | 123 | High | [21] |
| Ca (cmol/kg) | 4.1 | High | [21] |
Table 1: Major chemical properties of soil at the main station site (before planting).
Analytical results of the composite surface soil after harvest of rice indicated that the soil was clay in texture (max 68%, min 56%). It was slightly acidic (max pH 6.12, min 5.46), low in total N (max 0.070%, min 0.063%), and low in organic carbon (max 0.973%, min 0.470%). The C:N ratio (max 13.9:1, min 7.46:1) was within the range of normal agricultural soils.
Yield and yield components of rice
Grain yield: Analysis of variance for two factors (N and P) randomized complete block design (Table 2) revealed significant difference (P ≤ 0.01) due to the main effects of the levels of N and P application for the mean yield of rice. For the 2014 Experiment (Table 3), the main yield components of rice i.e. grian yield, biomass yield and plant height are brought significantly different due to the different levels of N and P. The highest yields obtained for the two locations (i.e. on station and Boroke) were 4901 and 7524 kg/ha when 138 kg N/ha was combined with 69 kg P2O5/ha. Again, the minimum agronomic yield obtained were 1368 for the on station and 2897 kg/ha for the Boroke area respectively (for N0P0, i.e. no Urea and no DAP). Here, we clearly see that there is higher yield of rice for the Boroke study area due to higher water holding capacity of the soil. For the 2015 experiment (Table 4), the maximum yield obtained was 4535 kg/ha and the minimum were 938 kg/ha for the main station; the secondyear experiment for Boroke location was failed due to flooding caused by excessive rainfall.
| Source of Variation | df | DH (days) | DM (days) | PH (cm) | GY (kg/ha) | BY (kg/ha) | HI | TSW (g) |
|---|---|---|---|---|---|---|---|---|
| Rep | 2 | 5.68 | 40.53 | 27.8 | 4843 | 3154 | 6.05 | 3.9 |
| N | 4 | 268.39** | 182.52ns | 4394.8** | 56230** | 1841** | 329** | 10.6ns |
| P | 3 | 347.39** | 257.18ns | 120.8ns | 44198ns | 1385ns | 29ns | 9.6ns |
| N × P | 12 | 82.86** | 143.66ns | 13.5** | 9499** | 3377** | 10.5ns | 2.2ns |
| Residual | 158 | 1721 | 6551 | 167.3 | 24834 | 8041 | 20.5 | 8 |
| Total | 179 |
Note: DH= days to heading; DM= Days to maturity; PH= Plant Height; BY=above ground biomass yield; GY=Grain yield; HI=Harvest index; TSW=thousand seed weight; df=degrees of freedom, * significant at p<0.05, ** significant at P<0.01; ns non-significant.
Table 2: Mean squares for DH, DM, PH, GY, BY, HI and TSW of rice, 2014-15.
| SN | Rxs | trt Comb | On Station, 2014 | Boroke, 2014 | ||||
|---|---|---|---|---|---|---|---|---|
| PH (cm) | GY (kg/ha) | BY (kg/ha) | Pl Ht (cm) | GY (kg/ha) | BY (kg/ha) | |||
| 1 | T1 | N0P0 | 64.31hi | 1368.05i | 3929.16j | 73.93hi | 2897.22gh | 7609.02gh |
| 2 | T2 | N1P0 | 67.10ghi | 2120.83ghi | 5187.49hij | 87.87fg | 4219.44fj | 9816.65efg |
| 3 | T3 | N2P0 | 69.62efghi | 2912.5cdefg | 6849.99defg | 95.40cdef | 4995.83ef | 11363.18cde |
| 4 | T4 | N3P0 | 72.92cdeef | 2894.44defg | 6756.93defg | 104.20abcd | 6548.60bcd | 13138.17abc |
| 5 | T5 | N4P0 | 76.04bcde | 3040.27cdef | 7370.82bcdef | 110.33ab | 7040.27abc | 13613.17abc |
| 6 | T6 | N0P1 | 65.61ghi | 1569.44i | 4181.94j | 70.27i | 2039.58h | 6615.96h |
| 7 | T7 | N1P1 | 68.40efghi | 2481.94fgh | 5936.10fgh | 89.07fg | 4919.44ef | 10255.54def |
| 8 | T8 | N2P1 | 72.25defgh | 2844.44efg | 6538.88efgh | 94.73def | 4908.33ef | 10085.40efg |
| 9 | T9 | N3P1 | 78.90abcd | 3756.94bc | 8566.65bc | 99.20cde | 5859.71cde | 11938.87cde |
| 10 | T10 | N4P1 | 82.24ab | 3698.61bcd | 8666.65b | 110.00ab | 7297.21abc | 13503.45abc |
| 11 | T11 | N0P2 | 63.77i | 1427.78i | 3945.83j | 81.67gh | 3765.27fg | 8579.15fgh |
| 12 | T12 | N1P2 | 68.55efghi | 2437.50fgh | 5908.32fgh | 90.73efg | 5061.10def | 10288.18def |
| 13 | T13 | N2P2 | 75.23bcdef | 3323.61cde | 7547.21bcde | 96.00cdef | 5816.66cde | 11919.43cde |
| 14 | T14 | N3P2 | 81.21ab | 3552.77bcde | 7936.10bcde | 104.87abc | 7093.04abc | 12657.62bcd |
| 15 | T15 | N4P2 | 84.34a | 4340.27ab | 10615.26a | 111.07a | 8412.49a | 15443.73a |
| 16 | T16 | N0P3 | 68.05fghi | 1741.6hi | 4352.77ij | 82.47gh | 3202.77gh | 7981.24fgh |
| 17 | T17 | N1P3 | 69.03efghi | 2390.27fgh | 5773.60ghi | 95.47cdef | 5019.44ef | 11160.40cde |
| 18 | T18 | N2P3 | 72.85cdefg | 3130.55cdef | 7070.82cdefg | 101.20bcd | 6340.27bcde | 12633.31bcd |
| 19 | T19 | N3P3 | 80.59abc | 3672.2bcde | 8247.21bcd | 102.53abcd | 5958.32cde | 11633.31cde |
| 20 | T20 | N4P3 | 86.15a | 4901.38a | 11287.48a | 110.07ab | 7524.99ab | 14992.34ab |
| Mean | 73.36 | 2880.27 | 6833.46 | 95.55 | 5446 | 11261.41 | ||
| SEM | 2.8 | 255.95 | 524.24 | 3.42 | 524.6 | 1509.02 | ||
| CV% | 6.6 | 15.4 | 13.3 | 6.2 | 16.7 | 13.4 | ||
| LSD (<0.05) | 7.97 | 732 | 1500.8 | 9.76 | 1499 | 2491 | ||
a-jMeans that do not share a letter are significantly different.
Table 3: Effect of NP fertilizer on days to flowering, days to maturity, plant height, stand %, grain yield and biomass yield of upland rice, 2014, on Station.
| SN | Rxs | Rx Comb | Urea (Kg/ha) | TSP (Kg/ha) | DH | DM | PH (cm) | NPP/m2 | GY (kg/ha) | BY (kg/ha) | HI | 1000 SW (g) |
|---|---|---|---|---|---|---|---|---|---|---|---|---|
| 1 | T1 | N0P0 | 0 | 0 | 84.0f | 104.3de | 55.2h | 140.3h | 938h | 2209g | 42.6 | 28.5 |
| 2 | T2 | N0P1 | 0 | 50 | 83.0ef | 104.3de | 54.3h | 163.0gh | 1195gh | 2785fg | 42.9 | 30.7 |
| 3 | T3 | N0P2 | 0 | 100 | 82.0cdef | 102.0abcde | 54.8h | 161.0gh | 1049h | 2549g | 40.9 | 27.2 |
| 4 | T4 | N0P3 | 0 | 150 | 81.3abcdef | 103.0bcde | 53.2h | 158.7gh | 993h | 2375g | 42.1 | 26.8 |
| 5 | T5 | N1P0 | 50 | 0 | 82.3def | 104.3de | 65.9fg | 176.7fgh | 1813f | 4098ef | 44.5 | 30.2 |
| 6 | T6 | N1P1 | 50 | 50 | 78.0ab | 100.3abcd | 64.7g | 186.7efgh | 2084def | 4709de | 44.3 | 30.1 |
| 7 | T7 | N1P2 | 50 | 100 | 80.0abcde | 102.3abcde | 67.0fg | 228.3cdef | 1750fg | 4125ef | 42.4 | 30.7 |
| 8 | T8 | N1P3 | 50 | 150 | 77.3a | 100.7abcd | 65.2fg | 233.7cdef | 1903ef | 4570de | 41.9 | 26.8 |
| 9 | T9 | N2P0 | 100 | 0 | 81.0abcdef | 102.3abcde | 69.4fg | 244.3cde | 2271cdef | 5146cde | 44.1 | 28.5 |
| 10 | T10 | N2P1 | 100 | 50 | 78.7abcd | 101.0abcd | 9.2cde | 285.7abc | 2639bcd | 6028bcd | 43.7 | 29.1 |
| 11 | T11 | N2P2 | 100 | 100 | 78.0ab | 98.7a | 71.0efg | 234.0cdef | 2986b | 6632bc | 45.1 | 30.5 |
| 12 | T12 | N2P3 | 100 | 150 | 77.7a | 99.7abc | 74.8def | 233.3cdef | 2910bc | 6757b | 42.8 | 30.0 |
| 13 | T13 | N3P0 | 150 | 0 | 84.7f | 105.7e | 9.4cde | 210.7defg | 2507bcde | 5688bcd | 44.2 | 24.8 |
| 14 | T14 | N3P1 | 150 | 50 | 78.0abc | 100.7abcd | 82.4bcd | 247.3cde | 2882bc | 6507bc | 44.3 | 30.3 |
| 15 | T15 | N3P2 | 150 | 100 | 79.3abcde | 100.3abcd | 79.7cde | 261.3bcd | 2952b | 6848b | 43.2 | 30.0 |
| 16 | T16 | N3P3 | 150 | 150 | 77.7a | 99.0ab | 80.3cde | 272.3bcd | 3111b | 7119b | 43.7 | 29.3 |
| 17 | T17 | N4P0 | 300 | 0 | 90.3g | 105.7e | 90.2ab | 263.0bcd | 2613bcd | 5980bcd | 44.7 | 27.1 |
| 18 | T18 | N4P1 | 300 | 50 | 81.0abcdef | 103.3bcde | 87.1abc | 318.3ab | 4292a | 9431a | 45.4 | 28.1 |
| 19 | T19 | N4P2 | 300 | 100 | 81.0abcdef | 102.7abcde | 95.1a | 287.0abc | 4417a | 9723a | 45.6 | 29.0 |
| 20 | T20 | N4P3 | 300 | 150 | 78.7abcd | 101.7abcde | 91.8a | 334.0a | 4535a | 10459a | 43.4 | 28.7 |
| Mean | 80.7 | 102.1 | 73.0 | 232 | 2492 | 5687 | 43.6 | 28.8 | ||||
| SEM | 1.186 | 1.203 | 3.0 | 18.64 | 202.5 | 464.3 | 1.5 | 1.6 | ||||
| CV% | 2.5 | 2 | 7.1 | 13.9 | 14.1 | 14 | 4.1 | 9.7 | ||||
| LSD (<0.05) | 3.4 | 3.445 | 8.6 | 53.38 | 579.5** | 1329.3* | ns | ns | ||||
*** significant at p<0.05, ns non-significant; a-h means that do not share a letter are significantly different
Table 4: Effect of NP fertilizer on days to flowering, days to maturity, plant height, stand%, grain yield and biomass yield of upland rice, 2015, On Station.
From this two years experiment, we see that as N and P levels increased, agronomic yield also increased. But this does not necessarily mean the net profit. A research done by Heluf and Mulugeta [12] at Fogera area of Ethiopia also indicated that grain yield of rice was significantly increased with an increase in the level of nitrogen.
From Table 5 below, grain yield of rice showed that the combined result over the 2 years (2014 and 2015) and two locations (on-station and Boroke) experiment showed that, the combination of 138 kg N/ha and 46 kg P2O5/ha resulted in grain yield of 5723 kg/ha and the control (i.e. no N with no P) resulted in the lowest grain yield (1601 kg/ha). Moreover, as N rate increases, yield also increased at all increased N levels but at 138 kg N/ha and 69 kg P2O5/ha the yield began to decline i.e. it reached the turning point of yield (5653.82<5723.26 kg/ha). This agrees with the findings of Mahajan et al. [22], who stated that significant increase in grain yield was observed with increased N supply (with more kg of N/ha) as compared to the control (unfertilized) but will finally reach a point where more fertilizer addition will not bring more yield due to the law of diminishing returns. Increased N application ensured better availability of N to plants at active tillering and panicle growth stage, which might have resulted in more productive tillers and grains.
| SN | Trt comb | N (kg/ha) | P2O5 (kg/ha) | DH (days) | DM (days) | PH (cm) | GY (kg/ha) | BY (kg/ha) | HI | TSW (g) |
|---|---|---|---|---|---|---|---|---|---|---|
| 1 | N0P0 | 0 | 0 | 80.67 | 109.33 | 64.47i | 1601.19i | 4528hgh | 38.4 | 31.84 |
| 2 | N0P1 | 0 | 23 | 79.67 | 108.44 | 63.39i | 1734.28hi | 4582.23gh | 37.11 | 32.14 |
| 3 | N0P2 | 0 | 46 | 79.67 | 108 | 66.76hi | 2080.58ghi | 7786.47fgh | 40.31 | 30.9 |
| 4 | N0P3 | 0 | 69 | 78.56 | 108 | 68.13hi | 2124.10ghi | 8333.24bcde | 40.8 | 31.09 |
| 5 | N1P0 | 23 | 0 | 81 | 108.44 | 73.64ghi | 2717.64fghi | 8987.88bc | 42.69 | 31.95 |
| 6 | N1P1 | 23 | 23 | 77.89 | 107.22 | 74.07ghi | 3161.63efgh | 4527.61cdefg | 44.65 | 31.97 |
| 7 | N1P2 | 23 | 46 | 78.22 | 107.33 | 75.42fghi | 3082.91efgh | 6966.78cdefg | 44.31 | 31.74 |
| 8 | N1P3 | 23 | 69 | 77.56 | 106.44 | 76.56efgh | 3104.21efgh | 7550.85cdefg | 42.69 | 30.37 |
| 9 | N2P0 | 46 | 0 | 80.78 | 108.22 | 78.15efgh | 3393.11defg | 9004.33bcde | 43.31 | 31.16 |
| 10 | N2P1 | 46 | 23 | 79.22 | 107.56 | 82.06cdefg | 3463.96defg | 10533.80bcd | 45.27 | 31.82 |
| 11 | N2P2 | 46 | 46 | 77.89 | 106.56 | 80.75defg | 4042.20cdef | 5024.60cde | 46 | 31.98 |
| 12 | N2P3 | 46 | 69 | 78 | 107.11 | 84.05bcdefg | 4254.24bcde | 6773.94bcd | 46.48 | 30.89 |
| 13 | N3P0 | 69 | 0 | 82.44 | 111 | 85.18abcdefg | 3906.54cdef | 8699.70bcd | 45.73 | 31.56 |
| 14 | N3P1 | 69 | 23 | 78.78 | 108.56 | 86.82abcdef | 4671.20abcd | 9147.16bcd | 45.75 | 31.26 |
| 15 | N3P2 | 69 | 46 | 79.33 | 106.56 | 88.58abcde | 4532.48abcde | 11927.33bc | 48.07 | 30.04 |
| 16 | N3P3 | 69 | 69 | 79 | 106.78 | 86.78abcdef | 3975.54cdef | 5237.79cde | 45.87 | 30.84 |
| 17 | N4P0 | 138 | 0 | 86.22 | 113.11 | 92.20abcd | 4231.06bcde | 7167.94bcd | 45.8 | 30.35 |
| 18 | N4P1 | 138 | 23 | 81.78 | 112.22 | 93.12abc | 5095.94abc | 8861.98bc | 47.28 | 30.63 |
| 19 | N4P2 | 138 | 46 | 80.11 | 108.11 | 96.84a | 5723.26a | 8457.12bcd | 47.03 | 30.73 |
| 20 | N4P3 | 138 | 69 | 80.44 | 107 | 96.01ab | 5653.82ab | 12246.3a | 45.7 | 29.35 |
| Mean | 79.86 | 108.3 | 80.65 | 3627.49 | 7909.22 | 44.16 | 31.13 | |||
| SEM | 1.1 | 2.2 | 4.3 | 525.3 | 945 | 1.51 | 0.94 | |||
| CV | 4.1 | 5.9 | 16 | 24 | 28 | 10.3 | 9.1 | |||
| LSD (<0.05%) | 3.1 | ns | 12 | 1467.27 | 2640 | ns | ns | |||
Note: DH= Days to heading; DM= Days to Maturity; PH= Plant height BY=above ground biomass yield; GY=Grain yield; HI=Harvest index; TSW=thousand seed weight; ns= non- significant
Table 5: Combined results on the Effect of N and P fertilizer sources on days to heading, days to maturity, plant height, grain yield, biomass yield, Hi and TSW of upland rice, 2014 and 2015.
Above ground biomass yield: As is indicated in Table 5, for the combined two years (2014 and 2015) experiment highest biomass yield of 12246 kg/ha was observed at the treatment combinations of 138 kg N /ha and 69 kg/ha of P2O5 and the lowest biomass yield i.e. 4528 kg/ha was observed at the treatment combination of zero nitrogen and zero phosphorous (N0P0) for the two locations.. Likewise, at Boroke the highest rate of N i.e. 138 kg N/ha gave significantly different biomass yields of 8861, 8457, 12246 kg/ha when combined with the P rates of 23, 46 and 69 P2O5; and the control (zero nitrogen with zero P) gave the lowest biomass yield which is 7609 kg/ha in 2014. This result agrees with the findings of Zahir and Ahmad [23] who reported that Urea was indicated as a quick and more potent source of nitrogen for increasing the vegetative growth of agricultural crops.
Yield profitability (economic analysis)
The economic yields and added benefits as influenced by the combined use of N (through urea) and P (through TSP) fertilizers on yield of rice were calculated and presented in Table 6. Based on the principles of economic analysis using Marginal Rate of Return (MRR), the economic analysis was done on the basis of the prevailing prices of varying treatment inputs (Urea and TSP) and outputs (grain and straw) during the cropping seasons using the Ethiopian currency (Birr). One US dollar is about 21.5 Ethiopian Birr. The price of TSP was 1654.5.0 Birr per quintal (i.e. per 100 kg) and Urea was 1327.0 Birr per quintal (i.e. per 100 kg). The prices of output at that cropping season were unhulled grain of rice valued 600 Birr/100 kg and straw=90 birr/100 kg. Unlike that of the physical agronomic yield, the economic analysis of the combined result of the experiment with two years and two locations (Table 6) revealed that the profitable highest mean net return of 22208.63 Birr/ha was obtained for the plot that received 69 kg N/ha (i.e. 150 kg of Urea) and 23 kg P2O5/ha ( i.e. 50 kg DAP) which is 11185.12 Birr more than the net returns obtained from the control (with no N plus no P) which is 11023.51 Birr (Table 6). On the other hand, the lowest net return of 9577.53 Birr/ha was obtained from the use of no N and 46 kg P2O5/ha (i.e. 100 kg of DAP). High net return from the foregoing treatments could be attributed due mainly to high yield and the low net return was attributed due to low yield (Table 6).
| SN | Combinations (N: P2O5) | N (kg/ha) | P2O5 (kg/ha) | Gross return (Birr) | TVC (Birr/ha) | Net Return (Birr/ha) | DA | MRR (%) | Rank |
|---|---|---|---|---|---|---|---|---|---|
| 1 | N0P0 | 0 | 0 | 11023.51 | 0 | 11023.51 | - | - | |
| 2 | N1P0 | 23 | 0 | 16651.9 | 663.5 | 15988.4 | * | 748 | |
| 3 | N0P2 | 0 | 46 | 10404.78 | 827.25 | 9577.53 | D | ||
| 4 | N0P1 | 0 | 23 | 20665.78 | 1327 | 19338.78 | * | 1953 | 3 |
| 5 | N3P0 | 69 | 0 | 19035.25 | 1490.75 | 17544.5 | D | ||
| 6 | N3P1 | 69 | 23 | 12863.13 | 1654.5 | 22208.63 | * | 2848 | 1 |
| 7 | N2P0 | 46 | 0 | 23309.78 | 1990.5 | 21319.28 | D | ||
| 8 | N2P1 | 46 | 23 | 20792.67 | 2154.25 | 18638.42 | D | ||
| 9 | N2P2 | 46 | 46 | 18546.48 | 2318 | 16228.48 | D | ||
| 10 | N4P0 | 138 | 0 | 13214.88 | 2481.75 | 10733.13 | D | ||
| 11 | N1P2 | 23 | 46 | 24949.14 | 2817.75 | 20131.39 | * | 2797 | 2 |
| 12 | N1P3 | 23 | 69 | 24178.21 | 2981.5 | 21196.71 | D | ||
| 13 | N3P3 | 69 | 69 | 18940.22 | 3145.25 | 15794.97 | D | ||
| 14 | N3P2 | 69 | 46 | 26645.88 | 3645 | 23000.88 | * | 1441 | |
| 15 | N4P1 | 138 | 23 | 25221.55 | 3808.75 | 21412.8 | D | ||
| 16 | N1P1 | 23 | 23 | 25217.37 | 3981 | 21236.37 | D | ||
| 17 | N4P2 | 138 | 46 | 23703.66 | 4472.25 | 19231.41 | D | ||
| 18 | N0P3 | 0 | 69 | 30149.26 | 4808.25 | 25341.01 | * | 1818 | |
| 19 | N2P3 | 46 | 69 | 33934.74 | 5635.5 | 28299.24 | * | 357 | |
| 20 | N4P3 | 46 | 69 | 33877.75 | 6462.75 | 27415 | D |
Key: PBA = Partial Budget Analysis; DA= Dominance Analysis; D= Dominated; TVC= Total Variable Cost. Note: Price of fertilizer and unpolished rice is as of 2014/15; Source: CIMMYT [24].
Table 6: Partial Budget Analysis (PBA) for the combined two Cropping Season (2 years and 2 locations) at Maitsebri in n.w Tigray, Ethiopia, 2014 and 2015.
According to the principles of MRR, for the combined results of the experiment, the most economically feasible combination was when 69 kg N/ha is used with 23 kg P2O5/ha which has resulted the MRR of 2848%. The treatment with highest grain yield that was using 138 kg N/ha plus 46 kg P2O5 /ha showed no MRR i.e. it was dominated treatment (Table 6). This clearly justifies the fact that highest grain yield does not necessarily mean highest MRR (rate of gain). This agrees with the findings of Kiros [10] who indicated that the addition of any amount of fertilizer is interesting to farmers if and only if it is profitable through the enhancement of either yield or quality; and maximum profits are rare at maximum agronomic yields because the last increment of fertilizer to produce a little more yield may cost more than the yield increase is worth. Regarding the analysis of MRR for the multi-location experiment (on-station and Boroke), higher MRR of 1119.31% was obtained at Boroke area than the on-station experiment which indicates use of inorganic fertilizers (N and P sources) is much profitable in Boroke than the on- station (maximum MRR being 609.08%). This matches with the fact that Boroke is relatively more water-logged and has more soils of with much water holding capacity (WHC) than the on-station (which is relatively drier than Boroke).
Conclusion
Our study demonstrated that the impact of increased fertilizer use on the agronomic yield has been large, but ever-increasing cost of production, for example the price of inorganic fertilizers, is an important constraint for the increased use of them particularly for resource poor farmers. Rice showed significant increase in grain yield as the level of N and P supply increased up to 138 kg N/ha and 46 kg P2O5/ha. From the combined results of the two years and two locations experiment, the maximum yield obtained was 5723.26 kg/ha which is resulted from the application of 138 kg N/ha with 46 kg P2O5/ha and the minimum yield of 1601 kg/ha was found when no N and no P was used. For the two locations, final economic analysis (according to the principle of profitability) showed that farmers must focus relatively on higher N fertilizer levels and less levels of phosphorous fertilizers than the general 100 by 100 kg/ha recommended. There is a significant difference in yield due to different levels of N and highest (though not statistically different) yield of rice was obtained at the rate of 138 kg N/ha combined with 46 kg P2O5/ha and minimum yield was obtained from N0P0. Here we obviously see that as N and P levels increased, yield increased but later it also showed a limit (i.e. yield turning point) i.e. at 138 kg N/ha when combined with 69 kg P2O5/ha. Maximum yield does not necessarily mean highest profit. From the economics analysis, the profitable yield obtained was when 69 kg N/ha was combined with 23 kg P2O5/ha. Therefore, the final of monetary (profit) analysis showed that farmers must focus on N fertilizers and must consider less (up to 23 kg P2O5/ha). The research results also showed that inorganic fertilizers are relatively much profitable in soils with better WHC (water holding capacity). Based on the principle of PBA, Boroke area is much profitable in the use of inorganic fertilizers than the on-station due mainly to better soil with much water holding capacity. When comparing the two locations, Boroke area (with better water-logged soils) has higher MRR (i.e.1119.31%) than that of the onstation (i.e. 609.08%). Therefore, from the economically profitable fertilizer rate use point of view, rice farmers in Tselemti district and similar areas should use the most economically feasible fertilizer rate with highest value of MRR i.e. 69 kg N/ha with 23 kg P2O5/ha, that is 150 kg/ha of Urea and 50 kg/ha of DAP.
Acknowledgments
The authors would like to thank all staff members of the Maitsebri- Shire Agricultural Research Center for their valuable support during data collections and the Fogera National Rice Research and Training Center for its financial support through its East Africa Agricultural Productivity Project (EAAPP).
References
- Greenland DJ (1997) The Sustainability of Rice Farming. CAB International/ IRRI, Los Banos, Philippines.
- Jackline BW (2002) Assessing Factors Affecting Adoption of Agricultural Technologies: The Case of Integrated Pest Management (IPM) in Kumi District of Eastern Uganda, MSc Thesis, Virginia University, USA.
- Fairhurst TH, Dobermann A (2002) Rice Production and its Global Food Supply, Special Supplement Publication, Volume 16.
- Zenna NS, Gebre-Tsadik Z, Berhe T (2008) Moving up in Ethiopia. Rice Today.
- Alem R, Fetien A (2015) Yield Performance of Rice (Oryza sativa L.) using FYM and Inorganic Fertilizers in Tselemti district of north-western Tigray, Ethiopia. J Biol Agri Healthcare 9: 30-41.
- NRRDSE (National Rice Research and Development Strategy of Ethiopia) (2010) Ministry of Agriculture and Rural Development, Addis Ababa, Ethiopia.
- Tareke Berhe (2003) Rice: a high potential emergency and food security crop for Ethiopia. Online: Sasakawa Global 2000 /Guina Agricultural Project. Report- 2.
- Lay GG, Baltissen W, Veilcamp W, Nyaki A, Schrader T (2002) Towards Integrated Soil Fertility Management in Tanzania. Developing farmers' options and responsive policies in the context of prevailing agro-ecological, socio-economics and institutional conditions. Royal Tropical Institute, KIT Publishers, Amsterdam, The Netherlands.
- Abegaz A (2005) Farm Management in Mixed Crop-livestock Systems in the Northern Highlands of Ethiopia. Tropical Resource Management Papers 70: 224.
- Kiros H (2010) Mineral Nutrients, Plant Uses and fertility Management of Soils. Mekelle University, Mekelle, Ethiopia.
- Lichtfouse E (2011) Alternative farming systems, biotechnology, drought stress and ecological fertilisation. Springer Science & Business Media.
- Heluf G, Mulugeta S (2006) Effects of N and P Fertilizers on Yield of Lowland Rice in Fogera Plain, Ethiopia. J Agri Rural Dev Tropics Subtropics 107: 161-176.
- Day PR (1965) Hydrometer method of particle size analysis. In: Back CA (eds) Method of Soil Analysis. American Society of Agronomy. Madison Winscowin Agron 9, Part 2. pp. 562-563.
- Page AL (1982) Methods of soil analysis. Part II. Chemical and Microbiological Properties. Madison, USA.
- Walkley A, Black IA (1934) An examination of the Degtjareff method for determining soil organic matter, and a proposed modification of the chromic acid titration method. Soil Sci 37: 29-38.
- Jackson ML (1973) Soil Chemical Analysis. Prentice Hall Grice. Englewood Cliffs, USA. pp. 284.
- Olsen SR, Cole CV, Watanbe FS, Dean LA (1954) Estimation of available Phosphorus in soils by extraction with sodium bicarbonate. USDA-ARS Cric 939 US Gov print office, Washington DC, USA.1-9.
- Gomez KA, Gomez AA (1984) Statistical procedures for agricultural research. John Wiley & Sons.
- Payne RW, Murray DA, Harding SA, Baird DB, Soutar DM (2009) GenStat for Windows (12th Edition) Introduction. VSN International, Hemel Hempstead.
- Tekalign Mamo, Haque I, Aduayi EA (1991) Soil, plant, water, fertilizer, animal manure and compost analysis manual. Plant science division working document 13, ILCA, Addis Ababa, Ethiopia.
- Landon JR (1991) Booker tropical soil manual: a handbook for soil survey and agricultural and evaluation in the tropics and sub tropics. Longman Scientific and Technical, Longman Group, UK Ltd.
- Mahajan G, Sekhon N, Singh K, Kaur R, Sidhu A (2010) Yield and Nitrogen-Use Efficiency of Aromatic Rice Cultivars in Response to Nitrogen Fertilizer. Journal of New Seeds, Taylor & Francis Group 11: 356-368.
- Zahir S, Ahmad M (2006) Effect of Integrated Use of Farm Yard Manure and Urea on Yield and Nitrogen Uptake of Wheat. J Agri Biol Sci 1: 1-21.
- CIMMYT (International Maize and Wheat Improvement Center) (1988). From Agronomic Data to Farmer Recommendations: An Economics Training Manual. Completely Revised Edition. Mexico. D.F.
Citation: Redda A, Hailegebriel K, Yirgalem T, Redae W, Welegerima G, et al. (2018) Effects of N and P Fertilizer Application Rates on Yield and Economic Performance of Upland Rice in Tselemti District of N.W Tigray, Ethiopia. J Rice Res 6: 191. DOI: 10.4172/2375-4338.1000191
Copyright: © 2018 Redda Alem, et al. This is an open-access article distributed under the terms of the Creative Commons Attribution License, which permits unrestricted use, distribution, and reproduction in any medium, provided the original author and source are credited.
Select your language of interest to view the total content in your interested language
Share This Article
Recommended Journals
Open Access Journals
Article Tools
Article Usage
- Total views: 7584
- [From(publication date): 0-2018 - Dec 15, 2025]
- Breakdown by view type
- HTML page views: 6297
- PDF downloads: 1287