Etiological Study of Thyroid Disorders in the Foot Hill Settlements of Pir Panjal Range
Received: 09-Jul-2015 / Accepted Date: 24-Dec-2015 / Published Date: 29-Dec-2015 DOI: 10.4172/2161-1165.1000211
Abstract
The present research work is an attempt to find out the concentration of Iodine (I) in soil and water phases of the natural environment and its relationship with the human health in the foot hill settlements of Pir Panjal Range in Anantnag district of Kashmir valley. Also, socio-economic determinants of health were taken into due account. Firstly, the area was divided into altitudinal zones and soils classes. Then, the soil and water samples were taken from each soil type in each altitudinal zone and were analyzed by Atomic Absorption Spectrophotometer. The socio-economic character of the area was analyzed through surveying the area by using structured household schedules. In this area, people rely mostly on locally cultivated food items because of their economic condition. The study highlights that about 19.5%, 42.9% and 37.6% households in the study area have low (Rs. <5,000 month-1), medium (Rs.5,000-10,000 month-1) and high (Rs. >10,000 month-1) income status respectively. The study reveals that iodine content in all the soil (0.970-1.230 mg kg-1) and water (1.6-4.2 µg L-1) samples in all the altitudinal zones is less than the average values in the world soils (2.8 mg kg-1) and fresh waters (8.7 μg L-1). About 17.6% of the population in sample villages suffers from Iodine Deficiency Disorders (IDDs). These IDDs can be ascribed to the scarcity of iodine in soils and drinking waters (and hence diet), and lifestyle. Attempts have been made to suggest certain remedial measures to minimize the magnitude of IDD sufferers in the study area.
Keywords: Iodine; Thyroid disorders; Foot hills; Cooking methods
164044Introduction
Trace elements are the elements present in the earth’s crust in concentrations less than 0.1% (<1000 mg kg-1) or those elements that are ordinarily present in plant or animal including human beings tissues in concentrations less than 0.01% (<100 mg kg-1) of the organism’s dry weight [1]. Trace elements are necessary for life in small amounts. They are components of haemoglobin, DNA, RNA, and various enzymes [2]. Trace metals play an important role in the synthesis of both proteins and nucleic acids.
There is a standard requirement of each trace element for human health [3]. All essential trace elements either in excess states or in deficit states are known to create serious health problems particularly in the areas where these are regionally deficit [4] or surplus. The concentration of trace elements in soil, water or food items is mainly determined by the geological conditions of the area [5,6].
The human body does not make its own iodine and is dependent on dietary sources and thus making it an essential part of our diet. The healthy adult human body contains 15-20 mgs of iodine, of which about 70-80% is in the thyroid gland. The normal intake and requirement of iodine is 100-150 µg d-1 [7,8].
5
It is an essential element that is critical for the normal growth and development, and wellbeing of all humans. Iodine deficiency is associated with reduced thyroid hormone synthesis, leading to increased thyroid stimulating hormone levels, which stimulates thyroid over growth and goiter [9]. The distribution of iodine is uneven in the biosphere. Its deficiency does not cause a mere enlargement of thyroid gland (endemic goiter), it can cause a variety of disorders called iodine deficiency disorders (IDDs) or thyroid disorders consisting of hypothyroidism, endemic cretinism, still-births, mental retardation, defects in vision, hearing and speech, and neuromuscular weakness.
These disorders are mainly found in those people who live away from coastal areas, in mountainous areas, previously glaciated areas and the like. Even people living in coastal areas and on islands suffer from IDDs because sea salt does not contain iodine content as much as required by the people and due to their unsuitable habits [10].
W.H.O. estimated that about 20% to 60% of the world's population is iodine deficient [11] with most of the burden in developing countries. Mayer while working out the goiter incidence in Kashmir Valley during 2004-2005 found that Anantnag district (a part of foot hills) has the highest incidence of goiter and he suggested that nature of bedrock and soils is responsible for the variable goiter incidence in the valley [12].
According to a recent research conducted on school children of Kulgam district which is a part of the foot hills of Pir Panjal range, it was found that 18.9% suffer from Total Goiter Rate (TGR); 21.2% boys and 16.7% girls [13].
Since, the incidence/prevalence of thyroid disorders is a significant health problem covering an appreciable section of the society in the foot hills of Pir Panjal range, the present study was attempted to investigate the possible causes and factors both of the geochemical and socio-economic origins in the area.
Study Area
The area under present study is a part of the Kashmir region located roughly between the elevations of 1,800 meters to 3,000 meters above the mean sea level (m AMSL).
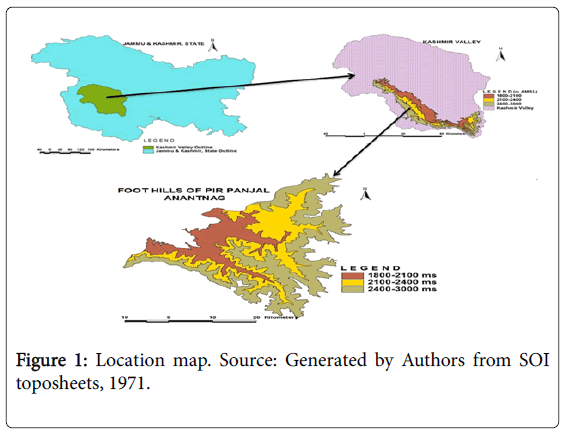
The area lies between 330 23´ 08” N to 330 65´ 90” N latitudes and 740 55 750 10’ 05’¢ to 750 35¢ 20’’ E longitudes, covering an area of about 547.04 km2 (Figure 1) with a population of about 1, 88,055 [14].
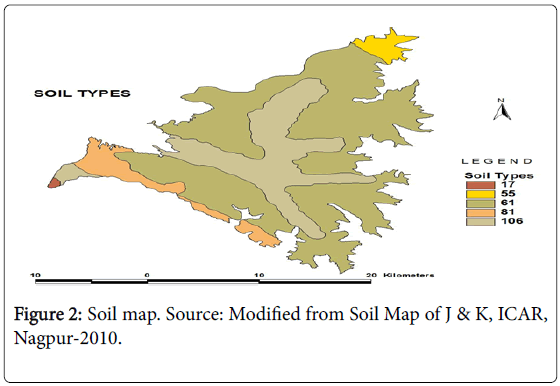
The soils of the concerned area vary in origin from alluvial to lacustrine and glacial (Figure 2 and Table 1).
| Code | Description | Soil Type |
|---|---|---|
| 17 | Dominantly rock outcrops; associated with shallow, loamy, calcareous soils on steep to very steep slopes with loamy surface, strong stoniness and severe erosion | Lithic Cryorthents |
| 55 | Deep, well drained coarse-loamy soils on gentle slopes with loamy surface, moderate erosion and slight gravelliness; associated with deep, well drained, coarse loamy, calcareous soils with loamy surface, moderate erosion and slight gravelliness. | Typic Cryofluvents |
| 61 | Medium deep, well drained, loamy-skeletal soils on moderate slopes with loamy surface, severe erosion and strong stoniness; associated with medium deep, well drained, fine-loamy soils with loamy surface, moderate erosion and moderate stonniness. | Typic Udorthents/Dystric Eutrochrepts |
| 81 | Deep, moderately well drained, fine soils on very gentle slopes with loamy surface; associated with deep, well drained, fine-loamy soils with loamy surface. | Typic Hapludalfs/Dystric Eutrochrepts |
| 106 | Medium deep, well drained, fine loamy soils on moderate slopes with loamy surface and moderate erosion; associated with shallow, excessively drained, loamy soils with loamy surface, moderate erosion and strong stonniness. | Dystric Eutrochrepts/Lithic Udorthents |
Table 1: Soil Types with Codes and Description. Source: Modified from Soil Map of J&K, ICAR, Nagpur-2010
Data Base and Methodology
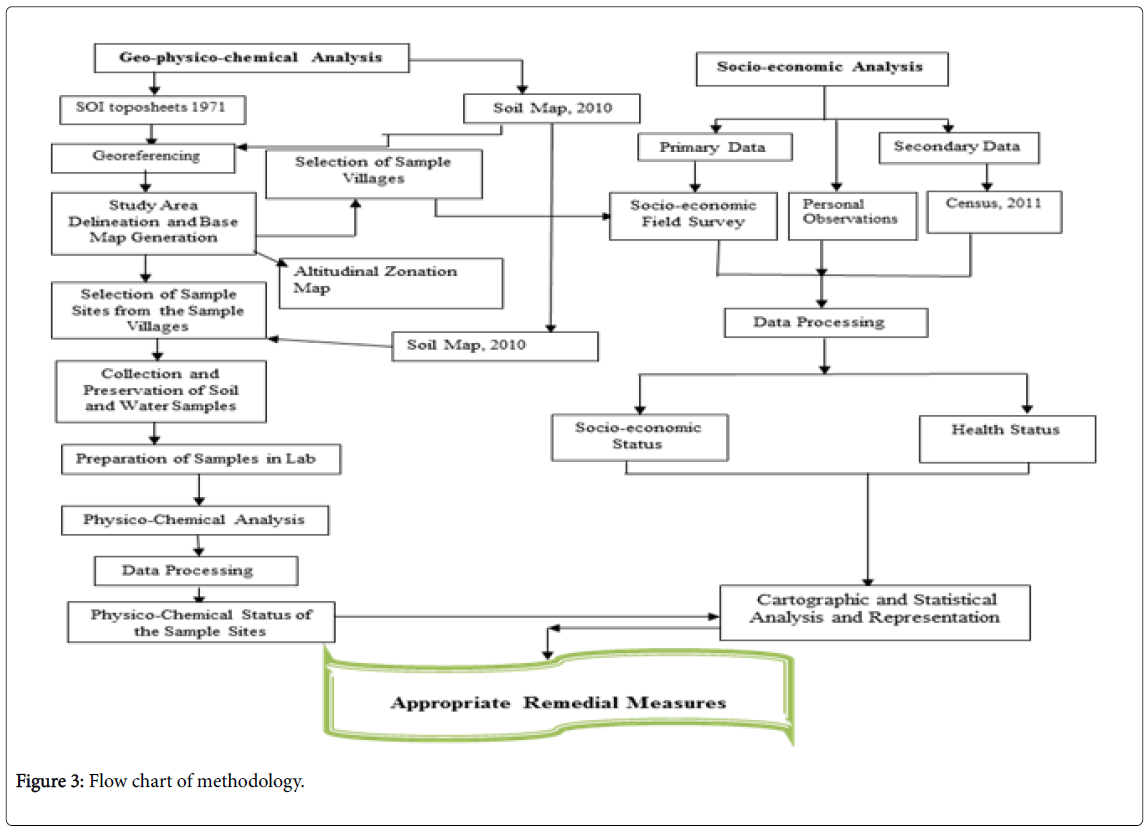
A comprehensive methodology has been adopted to carry out the present study. Figure 3 shows the general data base and methodological scheme divided into many related steps in order to accomplish the objectives of the present work.
GIS Techniques
The study area was delineated from Survey of India (SOI) toposheets of 1:50,000 scale of 1971 with numbers as 43 O/2, 43 O/3, 43 O/6 and 43 O/7 with the help of Arc View 3.2a software. The base contour was taken as 1,800th m AMSL and top one as 3,000th m AMSL [15]. These two contours were connected on the lateral sides by taking the watershed limits through digitization.
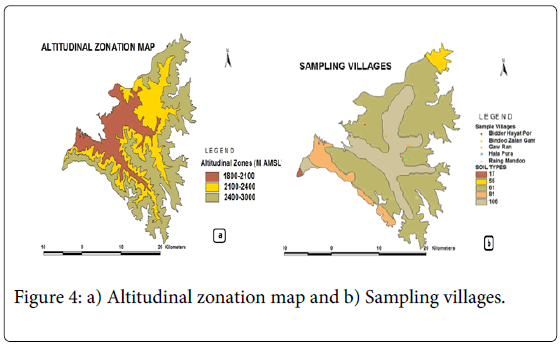
By digitizing 2,400th m contour, the area under study was divided into two altitudinal zones, namely, Lower Foot Hills (LFHs) and Upper Foot Hills (UFHs) varying in altitude from 1,800th-2,400th m and 2,400th-3,000th m respectively. The LFHs are characterized by good permanent human occupancy while as the UFHs experience mostly seasonal human inhabitations. By digitizing 2,100th m contour, the LFHs were further sub-divided into two sub-zones namely, LFHs-1 and LFHs-2 varying in elevation from 1,800th-2,100th m and 2,100th-2,400th m (Figure 4a) for comparative analysis.
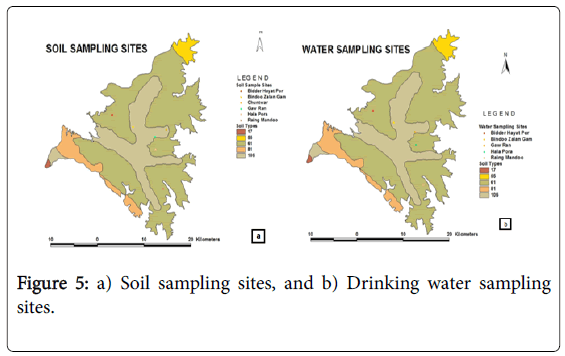
Stratified random sampling technique was used for the selection of sample sites (sample villages, soil and water sample sites) and sample households as shown in Tables 2 and 3 and Figures 4b, 5a and 5b.
| Macro Regions (Altitudinal Zones in m AMSL) | Micro Regions (Sub-altitudinal Zones in m AMSL) | Sample Villages | Total No. of Households in the Sample Villages | Number of Households Surveyed | Percentage of Surveyed Households to total Households | Soil Type (Codes) | Number of Samples Taken | Main Water Source | No. of Samples Taken |
|---|---|---|---|---|---|---|---|---|---|
| Lower Foot Hills (LFHs)-1,800-2,400 | LFHs-1 (1,800-2,100) |
Bidder Hayat Pora | 77 | 08 | >10 | 61 | 01 | TSg | 01 |
| Bindoo Zalan Gam | 519 | 52 | >10 | 106 | 01 | TSm | 01 | ||
| LFHs-2 (2,100-2,400) |
Hala Pora | 292 | 29 | <10 | 61 | 01 | TSm | 01 | |
| Gaw Ran | 252 | 25 | <10 | 106 | 01 | TSg | 01 | ||
| Upper Foot Hills (UFHs)-2,400-3,000 | UFHs (2,400-3,000) |
Raing Mandoo | 143 | 14 | <10 | 61 | 01 | Sg | 01 |
| Chuntwar | 00 | 00 | 00 | 106 | 01 | 00 | 00 | ||
| Total | 1,283 | 128 | 10 | 06 | 05 |
Table 2: Sample Frame. Source: Generated by the authors.
| Macro Regions (Altitudinal Zones in meters AMSL) | Micro Regions (Sub-altitudinal Zones in meters AMSL) | Sample Villages/Sites | Sample Village/Site (Codes) | Geo-Coordinates (Lat./Long.) |
|---|---|---|---|---|
| Lower Foot Hills (LFHs)-1,800-2,400 | LFHs-1 1,800-2,100 | Bidder Hayat Pora | SS1-ANG | 33036’23” N & 750 17’54”E |
| Bindoo Zalan Gam | SS2-ANG | 330 34’45” N & 750 18’17”E | ||
| LFHs-2 2,100-2,400 | Hala Pora | SS3-ANG | 330 30’40” N & 75021’07”E | |
| Gaw Ran | SS4-ANG | 33035’24” N & 75021’26”E | ||
| Upper Foot Hills (UFHs)-2,400-3,000 | UFHs 2,400-3,000 | Raing Mandoo | SS5-ANG | 330 26’38” N & 750 22’24”E |
| Chuntwar | SS6-ANG | 33034’15” N & 750 24’08”E |
Table 3: Sample villages and sample sites with codes and geo-coordinates. Source: SOI toposheets, 1971.
Field Work
The soil samples were collected in clean unused polythene bags and were labeled properly. A clean spade was used to take the soil samples. In order to reduce variability, a composite sample was obtained from each sample site. A composite sample comprised of five sub-samples taken from each sample site in 10 m × 10 m grid format. Four sub-samples were taken from four corners of the square and one from the center. Soil samples were taken from depths of 0-20, 0-40 and 0-60 cm in relation to different major land uses i.e., agricultural, horticultural and forest respectively [16,17]. Water samples were collected in clean unused plastic bottles from the selected sample sites and were labeled properly and reached to the lab within 24 hours. Both types of samples were analyzed in Research Centre for Residue and Quality Analysis Lab, SKUAST, Shalimar. The socio-economic survey was done through the structured schedules to give the socio-economic picture of the area and to assess the dependence of people on local food items, income status, methods of cooking, households using iodized salt and boiled drinking water and percentage of households purchasing food from the market. The data regarding the prevalence of IDDs was collected from the prescriptions given by the registered practitioners.
Lab Work
The soil samples were air-dried, crushed with a wooden roller, passed through a 10 mesh (<2 mm) sieve, and then ground in an agate mortar. The recovered <63 μm particles were separated for chemical analysis. The samples were analyzed under Atomic Absorption Spectrophotometer (AAS-4141, Electronic Corporation Limited, India). A total concentration of I was determined after 4-acid digestion (HF, HClO4, HNO3 and HCl) by AAS. The samples were analyzed for iodine, pH and organic matter (OM).
Results and Discussions
Concentration of Iodine in the Soil and Drinking Water sources
The study showed that the soils and drinking water sources of the foot hills of Pir Panjal range in Anantnag district are deficient in iodine content in all the altitudinal zones (Tables 4-6) and have iodine content less than the world averages.
| Macro Regions | Micro Regions | Sample Sites | Soil Type | Iodine Conc. (mg kg-1) | pH | Organic Matter (OM in %) |
|---|---|---|---|---|---|---|
| Lower foot hills | LFHs-1 (1,800-2,100 m AMSL) | SS1-ANG | 61 | 0.98 | 6.42 | 2.15 |
| SS2-ANG | 106 | 1 | 6.51 | 3.76 | ||
| LFHs-2 (2,100-2,400 m AMSL) | SS3-ANG | 61 | 1.23 | 6.28 | 3.76 | |
| SS4-ANG | 106 | 0.97 | 5.88 | 3.42 | ||
| Mean | 1.05 | 6.27 | 3.27 | |||
| Upper foot hills | UFHs (2,400-3,000 m AMSL) | SS5-ANG | 61 | 1.05 | 6.42 | 4.9 |
| SS6-ANG | 106 | 1 | 6.56 | 1.34 | ||
| Mean | 1.03 | 6.49 | 3.12 | |||
| Mean | 1.04 | 6.35 | 3.22 | |||
| Standard Deviation | 0.0893 mg kg-1 | |||||
| Coefficient of SD | 0.0859 | |||||
| Coefficient of Variation | 8.60% | |||||
Table 4: Iodine Content, pH and Organic Matter of Soil types. Source: Based on soil sample analysis done by the authors, 2013.
| Macro Regions | Micro Regions | Sample Sites | Water Source | Iodine Conc. (µg L-1) | pH |
|---|---|---|---|---|---|
| LOWER FOOT HILLS | LFHs-1 (1,800-2,100 m AMSL) | SS1-ANG | TSg | 1.6 | 7.53 |
| SS2-ANG | TSm | 2.5 | 7.85 | ||
| LFHs-2 (2,100-2,400 m AMSL) | SS3-ANG | TSm | 3.9 | 7.87 | |
| SS4-ANG | TSg | 4.2 | 7.54 | ||
| Mean | 3.05 | 7.7 | |||
| UPPER FOOT HILLS | UFHs (2,400-3,000 m AMSL) | SS5-ANG | Sg | 4.1 | 7.75 |
| Mean | 4.1 | 7.75 | |||
| Mean | 3.26 | 7.71 | |||
| Standard Deviation | 1.6600 µg L-1 | ||||
| Coefficient of SD | 0.5092 | ||||
| Coefficient of Variation | 50.92% | ||||
Table 5: Iodine Content and pH of Water sources. Source: Based on water sample analysis done by the authors, 2013. Note: TSg: Tap fed by a spring, TSm: Tap fed by a stream, Sg: Spring.
| Macro Region | Micro Region | Sample Villages | Number of Persons Surveyed -100% | Age Groups | Sex | Number of Persons Suffering From IDDs (% cases to total) | |
|---|---|---|---|---|---|---|---|
| Person Suffering from IDD (Thyroid) | Person Suffering from no IDD | ||||||
| LFH | LFHs-1 | SS1-ANG | 6 | Children (1-14) | M | 1 (16.6) | 5 (83.4) |
| 4 | F | 1 (25) | 3 (75) | ||||
| 8 | Adults (15-50) | M | 2 (25) | 6 (75) | |||
| 8 | F | 2(25) | 6 (75) | ||||
| 1 | Olds (>50) | M | 0 (0) | 1 (100) | |||
| 1 | F | 0(0) | 1(100) | ||||
| Total | 28 | 6(21.4) | 22 (79.6) | ||||
| SS2-ANG | 36 | Children (1-14) | M | 7(19.4) | 29 (80.6) | ||
| 40 | F | 8(20.0) | 32 (80.0) | ||||
| 52 | Adults (15-50) | M | 7(13.5) | 45 (86.5) | |||
| 52 | F | 9(17.3) | 43 (82.7) | ||||
| 27 | Olds (>50) | M | 3(13.1) | 20 (86.9) | |||
| 23 | F | 5(18.5) | 22 (81.5) | ||||
| Total | 230 | 39(16.9) | 191(83.1) | ||||
| Total | 258 | 45(17.4) | 213(82.6) | ||||
| LFHs-2 | SS3-ANG | 14 | Children (1-14) | M | 3(21.4) | 11 (78.6) | |
| 9 | F | 1(11.1) | 8(88.9) | ||||
| 29 | Adults (15-50) | M | 5(17.2) | 24(81.8) | |||
| 28 | F | 5(17.8) | 23(82.2) | ||||
| 15 | Olds (>50) | M | 2 (13.4) | 13(85.6) | |||
| 15 | F | 2 (13.4) | 13 (85.6) | ||||
| Total | 110 | 18 (16.4) | 92 (83.6) | ||||
| SS4-ANG | 16 | Children | M | 3 (18.7) | 13 (81.3) | ||
| 12 | (1-14) | F | 1 (8.4) | 11 (91.6) | |||
| 25 | Adults | M | 4 (16.0) | 21 (84.0) | |||
| 24 | (15-50) | F | 5 (20.8) | 19(79.2) | |||
| 7 | Olds (>50) | M | 1 (14.3) | 6 (85.7) | |||
| 7 | F | 1 (14.3) | 6 (85.7) | ||||
| Total | 91 | 15 (16.5) | 76(83.5) | ||||
| Total | 201 | 33 (16.4) | 168(83.6) | ||||
| Total | 459 | 78 (17.0) | 381(83.0) | ||||
| UFHs | UFHs | SS5-ANG | 14 | Children (1-14) | M | 3 (21.4) | 11(78.6) |
| 11 | F | 2 (18.2) | 9(81.8) | ||||
| 14 | Adults (15-50) | M | 4 (28.6) | 10 (71.4) | |||
| 14 | F | 2 (14.3) | 12 (85.7) | ||||
| 5 | Olds (>50) | M | 2 (40) | 3 (60.0) | |||
| 5 | F | 1 (20) | 4 (80.0) | ||||
| Total | 63 | - | 14 (22.2) | 49 (77.8) | |||
| Grand Total | 522 | - | 92 (17.6) | 430 (82.4) | |||
Table 6: Prevalence of IDDs in different altitudinal zones (by age and sex) Source: Sample survey, 2013
| Macro Region | Micro Region | Sample Villages | Number of Households Surveyed -100% | Households Drinking Boiled Water (%) | Households Using Iodized Salt (%) | Dependence on Local food items (%) | Food Purchased from Market (%) | Methods of cooking foods (%) | ||
|---|---|---|---|---|---|---|---|---|---|---|
| <50% | >50% | Deep1 | Light2 | |||||||
| LFHs | LFHs-1 | SS1-ANG | 8 | 6(75) | 6(75.0) | 37.5 | 62.5 | 37.8 | 8(100) | 0(0) |
| SS2-ANG | 52 | 35(67.3) | 40(76.9) | 0 | 100 | 23.85 | 50(96.2) | 2(3.8) | ||
| Total | 60 | 41(68.3) | 46(76.7) | 18.75 | 81.25 | 30.83 | 58(96.7) | 2(3.3) | ||
| LFHs-2 | SS3-ANG | 29 | 14(48.3) | 19(65.5) | 3.45 | 96.55 | 30.17 | 25(86.2) | 4(13.8) | |
| SS4-ANG | 25 | 10(40) | 21(84.0) | 32 | 68 | 43 | 20(80.0) | 5(20.0) | ||
| Total | 54 | 24(44.4) | 40(74.1) | 17.73 | 82.27 | 36.58 | 45(83.4) | 9(16.6) | ||
| Total | 114 | 65(57.02) | 86(75.4) | 18.24 | 81.76 | 33.71 | 103(90.4) | 11(9.6) | ||
| UFHs | UFHs | SS5-ANG | 14 | 0(00) | 6(42.8) | 7.14 | 92.85 | 32.5 | 12(85.7) | 2(14.3) |
| Grand Total | 128 | 65(50.7) | 92(71.8) | 12.69 | 87.31 | 33.11 | 107(93.8) | 13(6.2) | ||
Table 7: Showing Households Drinking Boiled Water, Households Using Iodized Salt, Dependence of People on Locally Cultivated Food Items and Methods of Cooking. Source: Sample Survey, 2013. Note: Deep1=Long period Boiling/Braising/Blanching/Frying, Light2=Short period Boiling/Braising/Blanching/Frying.
| Macro Region | Micro Region | Sample Villages | Number of Households Surveyed -100% | Average Family Size (numbers) | Income Levels of Households Surveyed (Rs.%) | ||
|---|---|---|---|---|---|---|---|
| Low (<5,000) | Medium (5,000-10,000) | High (>10,000) | |||||
| LFHs | LFHs-1 | SS1-ANG | 8 | 6 | 2 (25.0) | 2 (25.0) | 4 (50.0) |
| SS2-ANG | 52 | 7 | 8 (15.4) | 24 (46.1) | 20 (38.5) | ||
| Total | 60 | 6.5 | 10 (16.7) | 26 (43.3) | 24 (46.0) | ||
| LFHs-2 | SS3-ANG | 29 | 7 | 6 (20.7) | 10 (34.4) | 13 (44.9) | |
| SS4-ANG | 25 | 6.5 | 5 (20.0) | 10 (40.0) | 10 (40.0) | ||
| Total | 54 | 6.75 | 11 (20.4) | 20 (37.0) | 23 (42.6) | ||
| Total | 114 | 6.63 | 21 (18.4) | 46 (40.4) | 47 (41.2) | ||
| UFHs | UFHs | SS5-ANG | 14 | 7.3 | 4 (28.6) | 9 (64.3) | 1 (7.10) |
| Grand Total | 128 | 6.96 | 25 (19.5) | 55 (42.9) | 48 (37.6) | ||
Table 8: Income Levels of Households Surveyed (Rs. %). Source: Sample Survey, 2013.
From Table 4, it is obvious that the soils are iodine deficient at all the elevation levels in the study area. The organic matter and pH influence the concentration of I in the soils. In soil type-61, iodine content first increases with altitude because of increase in OM in the soil and then slightly decreases with altitude due to increasing slope and coarser texture of soil. OM binds up iodine ions in the soil but the increasing slope and coarser texture cause iodine ions flow and translocate easily during rainfalls. In soil type-106, iodine content first decreases with altitude because of increase in the acidity of the soil and then increases with altitude. The acidic pH in soil catalyzes the loss of iodine ions in soil through leaching.
Likewise, Table 5 shows the concentration of iodine in drinking water sources in the area. Iodine content in drinking water sources first increases with altitude and then decreases. It shows affinity to the surrounding soils and their physico-chemical character.
Prevalence of Iodine deficiency diseases
The study revealed that about 17.6% people suffer from different IDDs in all the age-sex groups (Table 6). These people have greater (66.89%) dependence on locally cultivated food items because of their disadvantaged economic condition. More than 62.4% households comprising low and medium income status households fall below poverty line as per international standards of income-based poverty lines (Rs. 2371.5 month-1 person-1). They also have inadequate income as per the local economic scenario is concerned. It is evident from the Table 6 that in the sample village of UFH region, about 30.2% people suffer from IDDs as compared to 24.0% of LFH region. This variation can be attributed to the greater dependence of people on locally cultivated iodine deficit food items, and less use of iodized salt in UFHs than the people in LFHs (Table 7). In the sample village in UFHs, about 92.9% households fall in low and medium income groups (Table 8) which forces them to rely on whatever food items they cultivate locally. About 92.85% households have >50% dependence on local iodine deficit foods and 42.8% people used iodized salt in UFHs as compared to the LFHs in which about 81.76% households in the sample villages have >50% reliance on local foods and 75.4% people use iodized salt (Table 7).
The prevalence of IDDs in LFHs shows a decline from LFHs-1 to LFHs-2. About 17.4% people suffer from IDDs in LFHs-1 as compared to 16.4% in LFHs-2 (Table 6). This variation seems to be outcome of the differential lifestyles especially the food cooking methods. In LFHs-1, about 96.7% households surveyed are accustomed to inappropriate cooking methods such as long period boiling, braising, blanching and frying as compared to LFHs-2 in which the value is 83.4% (Table 7).
The prevalence of IDDs in the sample villages in the sub-zones decreases with altitude with respect to changing iodine, pH and OM content in the respective soil types and socio-economic conditions with the exception of SS5-ANG. In the LFHs-1, SS1-ANG (soil type-61) records 21.4% and SS2-ANG (soil type-106) records 16.9% of patients and in LFHs-2, SS3-ANG (soil type-61) records 16.4% and SS4-ANG (soil type-106) records 16.5% of patients and in UFH sub-zone, SS5-ANG (soil type-61) experiences 22.2% of patients to its total surveyed population. The increase in the percentage of patients suffering from IDDs in SS5-ANG is due to high (4.90%) OM in soil (Table 4). Though the concentration of iodine at SS5-ANG is relatively greater than some of the other sites, it has the disadvantage of having high OM. The OM decreases the bioavailability of iodine for the plants/crops resulting in iodine deficient foods. It may also be attributed to the greater dependence of the people on local foods (Table 7). Difference in the percentage prevalence of IDDs with respect to age and sex groups can be attributed to the relative differences in the life styles.
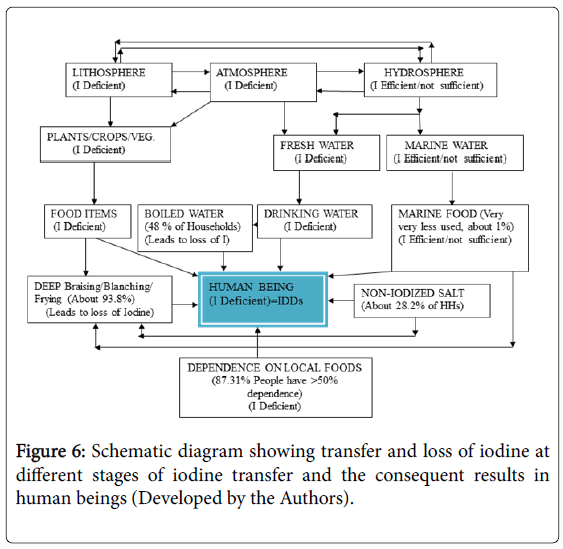
A diagrammatic model (Figure 6) has been developed related to the present study that shows cyclic movement of the iodine in the different phases of environment, the pathways how iodine reaches to the human body, its losses at different stages of movement at the dual hands of nature and humankind and the consequent results i.e., IDDs. The diagram also highlights the role of natural pools of iodine transfer and the life style of the people of the area under study in contributing the causation of the different IDDs. The lithospheric and atmospheric pools of iodine cycle are iodine deficient while as the hydrospheric pool is efficient in iodine content but not sufficient to save human beings from IDDs. So, the food derived from the soil is deficient in iodine. An individual human being derives only about 0.5 µg d-1 of iodine from inhalation [18]. The marine food is rich in iodine but unfortunately people make less use of marine foods perhaps because of their low income status and high price of the food. The problem of iodine deficiency and loss from the whatsoever food and water is used is further coupled by the unsuitable and unhealthy cooking methods and other lifestyles.
Conclusions
In all the altitudinal zones, the iodine content in the soil (0.970-1.230 mg kg-1) and fresh (drinking) water (1.6-4.2 µg L-1) sample sites is less than the world level averages in soils (2.8 mg kg-1) and drinking water (8.7 µg L-1) sources. The iodine content in soils showed a close association with OM and pH. Iodine in soils has direct relationship with OM and inverse relationship with pH. Iodine content in water samples showed a relationship with iodine content in surrounding soils. Leaching and run-off play an important role in the transfer of iodine from surroundings soils to water bodies. About 17.6% people surveyed suffer from thyroid disorders. There is decrease in the prevalence of IDDs from LFHs to UFHs and from LFHs-1 to UFHs-2 because of the lifestyle of people. At sample village level, there is also a decrease in the percentage prevalence of IDDs with altitude in respective soil types except SS5-ANG of UFH region. This is due to high (4.90%) OM in soil at SS5-ANG and dependence on vegetarian food.
Suggestions
Certain simple and low cost suggestions to minimize the magnitude of IDD sufferers in the area under study are needed for the area is rural in character. The people of the area should make 100% use of iodized salt by the whole population. Special care should be taken of pregnant and nursing mothers after consulting a registered medical practitioner. They should avoid long period boiling, braising, blanching and frying of foods to avoid the loss of nutrients especially iodine. Iodine should be added to drinking water and the irrigational water through fertigation to increase the content of iodine in the natural systems of soil and water. More and more sea foods, eggs, dairy products, watercresses, iodized salt, grains, and fruits should be used. The people should also avoid drinking of boiled water in coliform risk free areas.
Acknowledgment
The authors are highly thankful and indebted to University Grants Commission for providing financial assistance in terms of Junior Research Fellowship to Mr. Rafiq Ahmad Hajam, Ph.D research scholar, department of Geography and Regional Development, University of Kashmir.
References
- Adriano DC (2001) Trace Elements in Terrestrial Environments: Biogeochemistry, Bioavailability and Risks of Metals. (2ndedn), Springer-Verlaug, New York, 175 Fifth Avenue, USA, pp. 1-24.
- Akhtar R (1991) Environment and Health: Themes in Medical Geography. APH New Delhi, pp. 297-313.
- World Health Organization (1996) Trace Elements in Human Nutrition and Health. WHO, Geneva, pp. 62-138.
- Akhtar R (1991) Environment and Health, Themes in Medical Geography. Ashish Publishing House, New Delhi, pp. 1-37.
- Keller E (1999) Environmental Geology. Merrill Prentice Hall Upper Saddle River, New Jersey, pp. 314-316.
- Pyle GF (1979) Applied Medical Geography. V.H. Winston and sons, Washington D.C, p. 88.
- Masoodi S. (2012) Goitre or Iodine Deficiency Disorder – There is More Than Meets the Eye. JMS 15: 1-3.
- Selinus O, Alloway B, centeno JA, Finkleman RB, Fuge R, et al. (2005) Essentials of Medical Geology, Impacts of the Natural Environment on Public Health. Environ Health Perspect 113: A780.
- Kasper DL, Braunwald E, Fauci, AS, Hauser SL, Jameson JL, et al. (2008) Harrison’s Principles of Internal Medicine. New York, McGraw Hill, pp. 2104-2127.
- United Nations Children’s Fund (2002) Iodine Deficiency Disorders and Universal Salt Iodization: South Asia Priorities. UNICEF Regional Office for South Asia, Kathmandu-5815, Nepal, pp. 4-5.
- Izhar N, Geography and Health-A Study in Medical Geography. Nataraj Publishers, New Delhi, pp. 89-101.
- Khan MS, Mahjabeen R, Masoodi MA, Kauser J, Shahnaz N (2014) Prevalence of goiter among primary school children of Kulgam district, Jammu and Kashmir,India. AMJI 3: 18-21.
- Raza M, Ahmad A, Mohammad A (1978) The Valley of Kashmir: A Geographical Interpretation-The Land. Vikas Publication House, New Delhi, pp. 1-117.
- Brady NC (1991) Nature and Properties of Soils. Macmillan Publishing Company, New York, p. 247.
- Carter MR, Gregorich EG (1997) Soil Sampling and Methods of Analysis. Canadian Society of Soil Science, pp. 3-14.
- Nordic Project Group (1995) Risk Evaluation of Essential Trace Elements–Essential versus Toxic Levels of Intake, Nordic Council of Ministers, Nord, p. 18.
Citation: Hajam RA, Rather GM, Kanth TA (2015) Etiological Study of Thyroid Disorders in the Foot Hill Settlements of Pir Panjal Range. Epidemiology (sunnyvale) 5:211. DOI: 10.4172/2161-1165.1000211
Copyright: © 2015 Hajam RA, et al. This is an open-access article distributed under the terms of the Creative Commons Attribution License, which permits unrestricted use, distribution and reproduction in any medium, provided the original author and source are credited.
Select your language of interest to view the total content in your interested language
Share This Article
Recommended Journals
Open Access Journals
Article Tools
Article Usage
- Total views: 11318
- [From(publication date): 12-2015 - Jun 15, 2025]
- Breakdown by view type
- HTML page views: 10409
- PDF downloads: 909

