Evaluation of Agronomic Traits and Inorganic Nutritional Composition of Rice Seed from IRSSTN Genotypes in Iraq
Received: 18-Aug-2017 / Accepted Date: 05-Feb-2018 / Published Date: 12-Feb-2018 DOI: 10.4172/2375-4338.1000189
Abstract
The study aimed to determine the agronomic traits of two rice modules (IRSSTN 1 for a coastal salinity-wet season, and IRSSTN 2 for an inland salinity-coastal salinity-dry season) to select promising genotypes that have highest grain yields, early maturity, and stable under Al-mishkhab, Iraq environmental conditions by using inorganic and organic nutrition. The results showed that genotype IR72049-B-R-22-3-1-1 performed the best agronomic traits with late flowering (>130 days), shorter plant height, the highest ratio of seeds/panicle and grain yield compared to control, while genotype IR70023-4B-R-12-3-1 gave the highest panicle length and the highest number of panicle/m2. Significant differences were found at macronutrient (N, P, K, Na, Mg, and Ca) and micronutrient (Zn, Mn, Fe, and Cu). ‘IRSSTN module 1’ genotypes showed superiority in P, Mg, and Cu and IRSSTN module 2 genotypes had superiority in N, Ca, and Cu. The simple correlation analysis shows that 6 genotypes of 2 sets of IRSSTN genotypes improved the nutritional quality of whole grain may be having a stable medium. It can be recommended to improve the new cultivars at a research station and producing good seed quality.
Keywords: AMRRS; Microelements; Macroelements; Rice modules; IRSSTN modules
Introduction
While rice breeding for salt tolerance, screening tolerant plants in the field conditions play an important role [1] and is difficult because of soil salinity dynamics. Soil salinity is dyanamic in two ways; first level of salt varies horizontally and vertically both; and the second changes in soil profile with time [2]. Rice grains are less in essential nutrient elements, 50% of those nutrients available are found in the bran layer consisting of pericarp, seed coat, nucleus and aleurone layer and 10% in the embryo. Rice grains are consumed in the form of milled (polished) rice, and the milling process removes both bran and embryo leaving only about 28% of grain element content in the polished (white) rice [3]. Several studies have reported the variations in quality of the rice grain, especially when rice has been grown in traditional areas [4]. Salinity is a determinant factor during fertilization [5], maturity [6,7] and flowering [8]. Salinity is a current threat to food security, where irrigation is an essential input to agricultural production. More than 50% of rice soils in Iraq are now affected by salinity, so use of salt tolerant varieties are considered to be the most economic and effective way of increasing crop production on saline lands [9]. The rice plant is one of the most suitable crops for saline soils, moderately sensitive to salinity, particularly during the early seedling, flowering and reproductive stages [10,11]. In the last years the global warming phenomenon coming out by high temperature [12], drought [13], salinity [14] and water scarcity [15,16] and this affect field crops especially rice and this effect changed organic and inorganic composition leading to low quality and quantity of grains. Seedling test described a stress of that originally devised in collaboration with the International Rice Research Institute (IRRI), to understand this cellular function, a total of 92 genotypes obtained from IRRI (31st IRSSTN-SS1 and 31st IRSSTN-SS2) were subjected to field experiment of salinity stress (50 mM NaCl, Ece = 6 dS m-1). A field experiment was conducted to study the extent of genetic diversity in rice for nutrient composition. Rice is most susceptible to salinity stress, the threshold or slope of rice (Oryza sativa ) is Ece=3.0 dS m-1. It appears that increasing the rice production by expansion of planting areas is not an ideal solution. Despite of competing for urbanization, available lands for rice plantation is scarce due to abiotic stresses such saline-prone areas. Therefore, manipulation of cellular mechanisms in rice plants to promote salinity adaptation is the key to effectively improve the rice production. A possible and promising solution to this problem is the genetic improvement of rice cultivars that are tolerant to salinity. Plants possess various strategy defense mechanisms against salinity stress [3,17], specifically, the cell membrane is the first machinery that plays a critical role in the resistance of plant cells to environmental stresses. A field experiment was conducted to study the extent of genetic diversity in rice for growth parameters and yield contributing traits and quality of grains under Al-mishkhab, Iraq environmental condition. For understanding this cellular function, a total of 92 genotypes obtained from IRRI (31 IRSSTN-SS1 and 31 IRSSTN-SS2) was subjected to field experiment of salinity stress (50 mM NaCl, Ece = 6 dS m-1). A field experiment was conducted to study the extent of genetic diversity in rice for growth parameters and yield contributing traits. The objectives of this study were to determine the variability of two set of IRSSTN rice in quality grain under Almishkhab, Iraq environmental condition.
Materials and Methods
Plant materials
Two sets of International Rice Soil Stress Tolerance Nurseries (IRSSTN) were transferred to Iraq by cooperation with IRRI and evaluated at Al-Mishkhab Rice Research Station (AMRRS) during 2013, with the control cultivar called Jasmine (The Jasmine features are: high yield, aromatic, medium of growth duration, and resistant for lodging).
Two modules of IRSSTN; "IRSSTN module 1" for a coastal salinitywet season and "IRSSTN module 2" for an inland salinity-coastal salinity-dry season were obtained from the International Rice Research Institute, (IRRI), Los Banosh, Philippine. It consisted of 70 different genotypes of elite rice (Oryza sativa L. ) entries including local check. The detailed description of the genotypes along with yield performance, 1000 seed weight is given in Tables 1 and 2 and these genotypes were used for diversity analysis in the present investigation. IRSSTN Module 1 consisted of 35 test entry which are height (110-130 cm) and medium height with late-maturity (˃130 days). This module was evaluated under coastal–saline soil conditions. IRSSTN Module 2 is composed of 35 test entry that are semi-dwarf to medium-height (˂110 cm) with early to medium maturity (˂125 days). This module was screened under an inland-saline soil conditions.
| S No | Designation | Macro element (mg kg-1) | Micro element (mg kg-1) | ||||||||
|---|---|---|---|---|---|---|---|---|---|---|---|
| N (%) | P | K | Mg | Na | Ca | Zn | Cu | Fe | Mn | ||
| 1 | IR77664-B-25-1-2-1-3-12-3-AJY1 | 1.63 ± 0.11 | 210.43 ± 212.6 | 23 ± 2.5 | 613.1 ± 65.1 | 537.3 ± 57.1 | 147.16 ± 16.4 | 5.086 ± 0.6 | 38.47 ± 4.1 | 33.76 ± 3.5 | 15.51 ± 1.9 |
| 2 | IR71866-3R-1-2-1 | 1.27 ± 0.09 | 187.34 ± 189.2 | 18 ± 2.1 | 1225 ± 128.14 | 512.1 ± 55.2 | 179.1 ± 21.1 | 4.315 ± 5.1 | 9.427 ± 1.2 | 592.9 ± 61.1 | 21.39 ± 2.4 |
| 3 | IR71829-3R-82-1-1 | 1.43 ± 0.101 | 187.68 ± 189.6 | 22 ± 2.5 | 633.3 ± 66.1 | 473.7 ± 51.2 | 136.4 ± 15.1 | 4.393 ± 0.5 | 26.01 ± 2.9 | 48.74 ± 5.1 | 29.61 ± 3.1 |
| 4 | IR77674-3B-8-2-2-14-2-AJY4 | 1.75 ± 0.124 | 230.27 ± 232.6 | 18 ± 2.1 | 882.2 ± 90.1 | 526.4 ± 57.1 | 141.4 ± 16.1 | 4.8124 ± 0.5 | 37.98 ± 4.1 | 49.36 ± 5.4 | 26.9 ± 3.1 |
| 5 | IR71895-3R-9-3-1 | 1.71 ± 0.12 | 140.61 ± 142.0 | 20 ± 2.4 | 1223 ± 131.1 | 534.9 ± 57.1 | 186.7 ± 21.1 | 5.099 ± 0.58 | 11.32 ± 1.4 | 363 ± 39.1 | 24.9 ± 2.6 |
| 6 | IR65833-4B-17-1-3 | 1.3 ± 0.09 | 238.54 ± 241.0 | 17 ± 2.1 | 787.2 ± 8.1 | 401.4 ± 47.3 | 296.3 ± 31.2 | 2.399 ± 0.3 | 23.84 ± 2.7 | 92.88 ± 9.7 | 17.05 ± 1.9 |
| 7 | IR77664-B-25-1-2-1-3-12-5-AJY1 | 1.31 ± 0.09 | 216.10 ± 218.3 | 34 ± 0.4 | 823.3 ± 8.7 | 572.3 ± 60.1 | 142.7 ± 14.6 | 2.63 ± 0.3 | 10.6 ± 1.2 | 93.83 ± 9.7 | 30.55 ± 3.5 |
| 8 | IR63731-1-3-3-2 | 1.13 ± 0.08 | 167.36 ± 169.1 | 19 ± 2.4 | 799.7 ± 81.4 | 452.2 ± 49.1 | 112.6 ± 11.5 | 2.214 ± 0.25 | 4.691 ± 0.5 | 91.7 ± 0.12 | 14.74 ± 1.7 |
| 9 | IR71999-3R-3-2-2B-1-1 | 1.45 ± 0.102 | 245.03 ± 247.5 | 20 ± 2.4 | 697.9 ± 7.3 | 570.3 ± 6.1 | 225.6 ± 2.4 | 4.228 ± 0.5 | 1.361 ± 0.17 | 87.39 ± 0.9 | 37.16 ± 3.9 |
| 10 | IR50184-3B-18-2B-1 | 1.75 ± 0.124 | 200.65 ± 202.7 | 14 ± 1.7 | 842.3 ± 8.7 | 636.8 ± 6.7 | 102.8 ± 10.6 | 1.459 ± 0.18 | 6.892 ± 0.7 | 40.66 ± 4.3 | 25.84 ± 2.7 |
| 11 | IR61919-3B-24-3 | 1.31 ± 0.09 | 195.57 ± 197.6 | 21 ± 2.4 | 645.8 ± 67.1 | 439.8 ± 46.4 | 91.57 ± 95.2 | 3.906 ± 0.4 | 10.86 ± 1.3 | 103.3 ± 11.2 | 11.91 ± 0.14 |
| 12 | IR72048-B-R-16-2-3-3 | 1.27 ± 0.09 | 2196.11 ± 221.8 | 31 ± 3.5 | 883 ± 91.1 | 665 ± 70.1 | 345.8 ± 37.1 | 5.787 ± 0.6 | 9.389 ± 0.11 | 113.6 ± 15.1 | 15.51 ± 1.9 |
| 13 | IR76346-B-B-10-1-1-1 | 1.23 ± 0.08 | 186.36 ± 188.3 | 25 ± 2.9 | 745.6 ± 77.59 | 484.4 ± 51.65 | 101.3 ± 15.3 | 6.027 ± 0.7 | 16.33 ± 1.8 | 129.8 ± 13.4 | 12.81 ± 1.5 |
| 14 | IR70023-4B-R-12-3-1 | 1.57 ± 0.111 | 128.26 ± 129.6 | 16 ± 1.9 | 741.8 ± 79.59 | 366.9 ± 40.15 | 65.68 ± 7.89 | 5.599 ± 0.6 | 10.47 ± 1.9 | 128.6 ± 15.1 | 18.3 ± 2.1 |
| 15 | IR07T114 | 1.36 ± 0.09 | 184.26 ± 186.1 | 42 ± 4.8 | 714.5 ± 77.12 | 399.5 ± 44.12 | 79.39 ± 8.41 | 5.872 ± 0.6 | 14.96 ± 1.7 | 163.6 ± 1.9 | 38.22 ± 4.1 |
| 16 | IR76393-2B-7-1-1-3-1 | 1.53 ± 0.108 | 227.65 ± 230.0 | 16 ± 1.9 | 859.3 ± 91.2 | 581.3 ± 60.1 | 136.6 ± 15.4 | 8.497 ± 0.9 | 10.48 ± 1.5 | 400.3 ± 44.3 | 32.83 ± 3.5 |
| 17 | IR75395-2B-B-19-2-1-2 | 1.6 ± 0.113 | 274.93 ± 277.7 | 20 ± 2.3 | 990.4 ± 101.3 | 694.5 ± 72.36 | 74.06 ± 8.1 | 4.572 ± 0.5 | 46.17 ± 4.9 | 262.8 ± 28.4 | 21.58 ± 2.5 |
| 18 | IR73055-8-1-1-3-1 | 1.95 ± 0.138 | 222.53 ± 224.8 | 27 ± 6.1 | 1032 ± 106.5 | 422.4 ± 47.65 | 82.48 ± 8.4 | 4.654 ± 4.9 | 31.81 ± 6.6 | 50.13 ± 5.4 | 34.97 ± 3.8 |
| 19 | IR71907-3R-2-1-1 | 1.45 ± 0.102 | 191.49 ± 193.4 | 17 ± 1.9 | 759.3 ± 80.14 | 500.3 ± 55.47 | 106.9 ± 14.2 | 4.078 ± 0.5 | 14.56 ± 1.7 | 76.98 ± 7.9 | 10.86 ± 1.6 |
| 20 | IR68652-3B-20-3 | 1.63 ± 0.115 | 184.83 ± 186.7 | 18 ± 2.1 | 803.6 ± 86.48 | 417.2 ± 48.69 | 199.4 ± 24.1 | 3.408 ± 0.4 | 15.63 ± 1.9 | 96.27 ± 10.1 | 16.62 ± 1.9 |
| 21 | IR77664-B-25-1-2-1-3-12-4-AJY1 | 1.32 ± 0.54 | 238.41 ± 241.1 | 34.2 ± 0.5 | 1904 ± 221.1 | 460.61 ± 54.1 | 210.4 ± 312.4 | 4.2 ± 0.53 | 16.4 ± 1.9 | 50.78 ± 6.4 | 15.4 ± 2.4 |
| 22 | IR51499-2B-29-2B-1-1 | 1.61 ± 0.7 | 156.27 ± 201.3 | 17 ± 1.9 | 771 ± 81.2 | 173.6 ± 18.2 | 214.8 ± 25.1 | 5.136 ± 0.7 | 16.72 ± 1.9 | 25.26 ± 3.2 | 13.03 ± 1.7 |
| 23 | IR71907-3R-2-1-2 | 1.62 ± 0.7 | 231.13 ± 250.1 | 29 ± 3.4 | 826.2 ± 86.3 | 146.8 ± 16.1 | 158.2 ± 19.1 | 6.525 ± 0.9 | 22.54 ± 2.7 | 72.23 ± 7.8 | 14.11 ± 1.6 |
| 24 | IR78806-B-B-16-1-2-2-AJY1 | 1.54 ± 0.8 | 199.95 ± 204.5 | 21 ± 2.4 | 885.5 ± 91.2 | 714.2 ± 91.2 | 202 ± 24.1 | 3.238 ± 0.41 | 8.454 ± 0.9 | 153.8 ± 17.1 | 12.25 ± 1.4 |
| 25 | IR72579-B-2R-3-1-1 | 1.4 ± 0.7 | 164.21 ± 178.2 | 19 ± 2.4 | 1034 ± 111.2 | 591.8 ± 62.0 | 173 ± 2.1 | 5.369 ± 0.57 | 8.539 ± 0.9 | 57.05 ± 6.1 | 12.73 ± 1.7 |
| 26 | IR77674-3B-8-2-2-14-2-AJY1 | 1.12 ± 0.5 | 171.09 ± 190.1 | 24 ± 2.6 | 773.8 ± 85.2 | 155.4 ± 17.2 | 120.9 ± 15.1 | 2.435 ± 0.27 | 1.309 ± 2.1 | 59.31 ± 6.7 | 13.65 ± 1.5 |
| 27 | IR72580-B-24-3-3-3-2 | 1.46 ± 0.71 | 161.24 ± 180.1 | 18 ± 2.1 | 806 ± 89.1 | 573.6 ± 68.2 | 102 ± 14.1 | 3.273 ± 0.38 | 14.13 ± 2.4 | 81.65 ± 8.7 | 12.47 ± 1.5 |
| 28 | IR72049-B-R-22-3-1-1 | 1.9 ± 0.84 | 138.22 ± 150.5 | 29 ± 3.4 | 681.2 ± 71.1 | 146.8 ± 15.1 | 84.44 ± 8.9 | 2.613 ± 0.3 | 31.89 ± 4.8 | 174 ± 19.1 | 12.26 ± 1.4 |
| * | Local Rice Anber | 1.32 ± 0.54 | 238.41 ± 241.1 | 34.2 ± 0.5 | 1904 ± 221.1 | 460.61 ± 54.1 | 210.4 ± 312.4 | 4.2 ± 0.53 | 16.4 ± 1.9 | 50.78 ± 6.4 | 15.4 ± 2.4 |
Table 1: Mean values with Standard error for macro and micronutrient contents of rice (IRSSTN-1).
| S No | Designation | Macro element (mg kg-1) | Micro element (mg kg-1) | ||||||||
|---|---|---|---|---|---|---|---|---|---|---|---|
| N (%) | P | K | Mg | Na | Ca | Zn | Cu | Fe | Mn | ||
| 1 | IR 7409 5AC45 | 1.92 ± 0.21 | 544.06 ± 58.1 | 28 ± 3.4 | 902.8 ± 95.1 | 172.7 ± 19.4 | 534.6 ± 58.4 | 5.569 ± 0.71 | 15.63 ± 1.9 | 78.21 ± 8.4 | 13.69 ± 1.7 |
| 2 | IR 77 644B93321152AJY4 | 1.42 ± 0.19 | 102.45 ± 14.1 | 29 ± 3.4 | 1043 ± 109.4 | 75.89 ± 8.4 | 517.3 ± 57.1 | 3.906 ± 0.41 | 11.13 ± 1.4 | 140.8 ± 17.1 | 9.372 ± 0.11 |
| 3 | IR 77 674B20121364AJY1 | 1.76 ± 0.21 | 199.14 ± 21.2 | 25 ± 2.9 | 1095 ± 110.3 | 260.7 ± 29.1 | 628.6 ± 66.5 | 6.54 ± 0.71 | 12.24 ± 14.1 | 77.37 ± 8.1 | 17.02 ± 2.1 |
| 4 | IR 594 187B213 | 1.75 ± 0.21 | 488.58 ± 51.2 | 25 ± 3.1 | 931.6 ± 95.4 | 118.6 ± 13.6 | 622.3 ± 66.1 | 4.161 ± 0.51 | 10.62 ± 1.3 | 106.1 ± 13.1 | 17.63 ± 1.9 |
| 5 | IR 681 442B2233 | 1.67 ± 0.20 | 864.54 ± 88.4 | 25 ± 2.94 | 795.3 ± 82.1 | 200.3 ± 22.5 | 747.6 ± 79.2 | 1.991 ± 0.24 | 13.73 ± 1.7 | 75.2 ± 8.1 | 17.44 ± 1.91 |
| 6 | IR 77 6743B822144AJY1 | 1.82 ± 0.21 | 701.91 ± 73.1 | 24 ± 2.7 | 980.6 ± 100.3 | 271.6 ± 29.1 | 480.7 ± 54.1 | 2.189 ± 0.6 | 11.53 ± 1.4 | 64.73 ± 6.7 | 3.935 ± 0.7 |
| 7 | IR 725 93B13331 | 1.64 ± 0.19 | 129.16 ± 15.2 | 21 ± 2.4 | 748.8 ± 77.1 | 146.5 ± 19.2 | 415.9 ± 47.1 | 5.197 ± 0.71 | 14.01 ± 1.6 | 91.08 ± 10.5 | 5.461 ± 0.71 |
| 8 | IR 725 93B18222 | 1.79 ± 0.9 | 123.76 ± 15.1 | 67 ± 7.4 | 915.9 ± 98.1 | 103.3 ± 13.2 | 345.1 ± 38 | 5.834 ± 0.61 | 13.93 ± 1.5 | 75.9 ± 8.1 | 23.28 ± 2.4 |
| 9 | IR 77 6743B822134AJY2 | 1.43 ± 0.17 | 371.89 ± 41.1 | 97 ± 10.1 | 805.1 ± 86.2 | 106.1 ± 16.2 | 444.1 ± 49.1 | 1.477 ± 0.18 | 10.1 ± 0.14 | 49.98 ± 5.7 | 26.43 ± 3.1 |
| 10 | IR 720 46BR8312 | 1.55 ± 0.24 | 176.4 ± 2.4 | 29 ± 3.7 | 910.8 ± 95.1 | 214.7 ± 24.1 | 517.9 ± 57.2 | 4.116 ± 0.57 | 15.62 ± 1.8 | 104.3 ± 14.2 | 7.658 ± 0.8 |
| 11 | IR 725 79B2R132 | 1.74 ± 0.2 | 371.06 ± 3.9 | 17 ± 1.9 | 853.9 ± 90.1 | 176.1 ± 19.1 | 543.5 ± 57.1 | 4.301 ± 0.5 | 13.61 ± 1.7 | 125.8 ± 13.7 | 22.76 ± 2.4 |
| 12 | IR 10T 109 | 1.57 ± 0.24 | 477.18 ± 50.1 | 31 ± 3.5 | 830.9 ± 85.1 | 163.5 ± 18.2 | 407.3 ± 43.1 | 4.56 ± 0.54 | 12.91 ± 1.5 | 82.03 ± 8.7 | 19.5 ± 2.3 |
| 13 | IR 10T10 8 | 1.79 ± 0.84 | 195.35 ± 20.3 | 25 ± 3.1 | 768.6 ± 70.2 | 112.6 ± 13.4 | 507.8 ± 55.2 | 4.551 ± 0.48 | 10.73 ± 1.3 | 30.74 ± 3.3 | 20.43 ± 2.3 |
| 14 | IR 10T 101 | 1.92 ± 0.21 | 133.77 ± 13.7 | 32 ± 3.7 | 744.8 ± 75.4 | 155 ± 15.9 | 614.8 ± 0.65 | 5.026 ± 0.53 | 9.073 ± 0.5 | 104.3 ± 10.7 | 4.093 ± 0.45 |
| 15 | IR 10T 110 | 1.75 ± 2.1 | 561.68 ± 6.1 | 23 ± 0.27 | 763.9 ± 79.1 | 128.6 ± 15.1 | 663 ± 1.2 | 2.677 ± 0.31 | 11.82 ± 1.4 | 60.42 ± 0.63 | 9.1 ± 0.12 |
| 16 | IR 10T10 3 | 1.73 ± 0.9 | 481.35 ± 5.3 | 27 ± 3.1 | 853.8 ± 9.2 | 87.06 ± 9.1 | 612 ± 6.7 | 3.839 ± 4.3 | 14.19 ± 1.7 | 52.32 ± 5.5 | 24.11 ± 2.7 |
| 17 | IR 10T 102 | 1.55 ± 0.19 | 401.06 ± 45.4 | 31 ± 0.4 | 817.2 ± 84.3 | 151.2 ± 19.1 | 441.7 ± 48.1 | 4.151 ± 0.47 | 12.99 ± 1.7 | 24.42 ± 2.7 | 22.43 ± 2.7 |
| 18 | IR 29 | 1.61 ± 0.9 | 289.28 ± 31.1 | 29 ± 3.4 | 929.7 ± 95.1 | 170.2 ± 19.4 | 448.3 ± 50.7 | 4.427 ± 0.51 | 15.2 ± 1.7 | 89.47 ± 9.4 | 21.97 ± 2.4 |
| 19 | A 691 | 1.69 ± 0.9 | 230.61 ± 25.1 | 24 ± 2.7 | 737.3 ± 76.1 | 99.41 ± 10.1 | 384.7 ± 40.1 | 3.915 ± 0.41 | 11.13 ± 1.4 | 164.5 ± 17.3 | 6.65 ± 0.71 |
| * | Local Rice Anber | 1.32 ± 0.54 | 2384.11 ± 241.1 | 34.2 ± 0.47 | 1904 ± 221.1 | 210.4 ± 312.4 | 460.61 ± 54.1 | 4.2 ± 0.53 | 15.4 ± 2.4 | 50.78 ± 6.4 | 16.4 ± 1.9 |
Table 2: Mean values with Standard error for macro and micronutrient contents of rice (IRSSTN-2).
Sixty genotypes of rice (two models) were evaluated under field condition during the period from March to December of 2013, at the experimental farm of the Al-Mishkhab Rice Research Station (AMRRS). The soil texture of the application areas was silty clay loam to clay loam with pH of 7.9 and EC of 6 dS m-1 (field soil analysis). Randomized Complete Block Design (RCBD) was used with three replications. Twenty six days old seedlings were transplanted in 2 m2 plot with inter-row and intra-row spacing of 20 × 15 cm. All recommended practices were followed to maintain uniformity in plant population and to ensure good crop growth.
Five representative plants for each treatment in each replication were randomly selected to record days to panicle initiation, plant height (measured height from the base of the plant to the top of the latest spikelet on the panicle, excluding awn), panicle length (measured from the base of the lowest spikelet to the tip of the latest spikelet on the panicle, excluding awn), number of tillers per hill (counted total number of tillers at the maturity stage), number of reproductive tillers per hill (counted number of tillers with panicles), traits related to growth duration, such as days to 50% flowering, and yield per plot were computed on plot basis. For calculation of days to panicle initiation five main (primary) tillers from five randomly selected hills of each plot for each replication were collected at maximum tillering stage.
The collected tiller was exposed and the growing zone of first node was examined carefully under stereomicroscope and the length of the newly developed panicle was measured using a millimeter graph paper. Then the stage of panicle development was determined by the guidelines described in manual for hybrid rice seed production [18].
The nutrient parameters measured during period study, and nutritive value in terms of minerals of K, Ca, Mg, Na, Zn, Mn, Cu, and Fe. One grams of tissues form each replicates were dried in an oven for 24 h at 105° C (weighed and re-weighed until a constant weight was reached). The samples were allowed to cool at room temperature before the final weight was taken. The contents of the mineral elements for K, Ca, Na, Mg, Mn, Zn, Cu and Fe were determined using the standard method (aqua regain digestion method) and analyzed by Atomic Absorption Spectroscopy (AAS), method of described by Page [19]. Data were analyzed using GraphPad Prism (version 7) sofware (GraphPad Sofware, USA) [20].
Results and Discussion
Plant Height (cm)
IRSSTN Module 1 consisted of 19 test entry which are height (110-130 cm), so there were significant differences in this trait thus obtained are shown in Figure 1A for plant height measured parameter. The highest plant height on the IRSSTN-SS1 plots was 104.6 cm, while the lowest plant height on the IRSSTN-SS1 plots had a 69.6 cm as average replicate. ISSTN-SS1 establishment is already being started culturing in a number of countries contributed with IRRI such as DPR Korea, Egypt, Republic of Korea, Thailand and India (Cuttack, DRR, Danti, Gangavati, Gosaba) [21]. The all locations gave highest in plant height was 147 cm, while the lowest plant height was 77 cm [22]. IRSSTN-SS2 is composed of 28 test entry those are semi-dwarf to medium-height (˂110 cm). Figure 1B for plant height on the IRSSTNSS2 plots measured, the highest plant height was 122 cm as average, while the lowest plant height was 84 cm, however, all locations at IRRI gave the highest plant height (133 cm), while the lowest plant height was 63 cm [23]. This difference may be attributed to good growth conditions in these countries that led to vigorous root growth in all directions compared with Iraq condition. The result is identical to Negrão et al. [22].
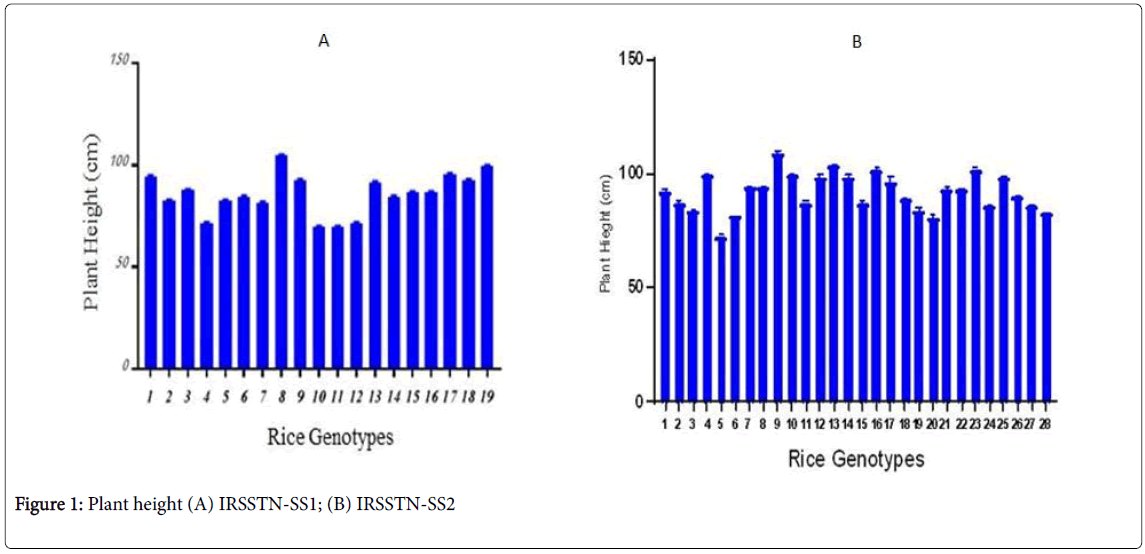
Figure 1: Plant height (A) IRSSTN-SS1; (B) IRSSTN-SS2
Days to 50% flowering
Considering this parameter affecting crop yield, the FDW average in IRSSTN-SS2 was lower (84 day) compared with the highest (122 day). The first IRRI locations gave highest in FDW was 133 days, while the lowest in FDW was 88 days (Figure 2). IRSSTN-SS1 plots, the highest FDW was 104 days as the average, while lowest FDW was 85 days, however, all locations at IRRI gave highest in plant height was 113 day, while the lowest highest in plant height was 88 days [24]. This result may be attributed to more shading between plants and less nutrient uptake due to greater competition among IRRI plants which grow closer together. The result agreed with Pandit et al. [1] and Gregorio et al. [25].
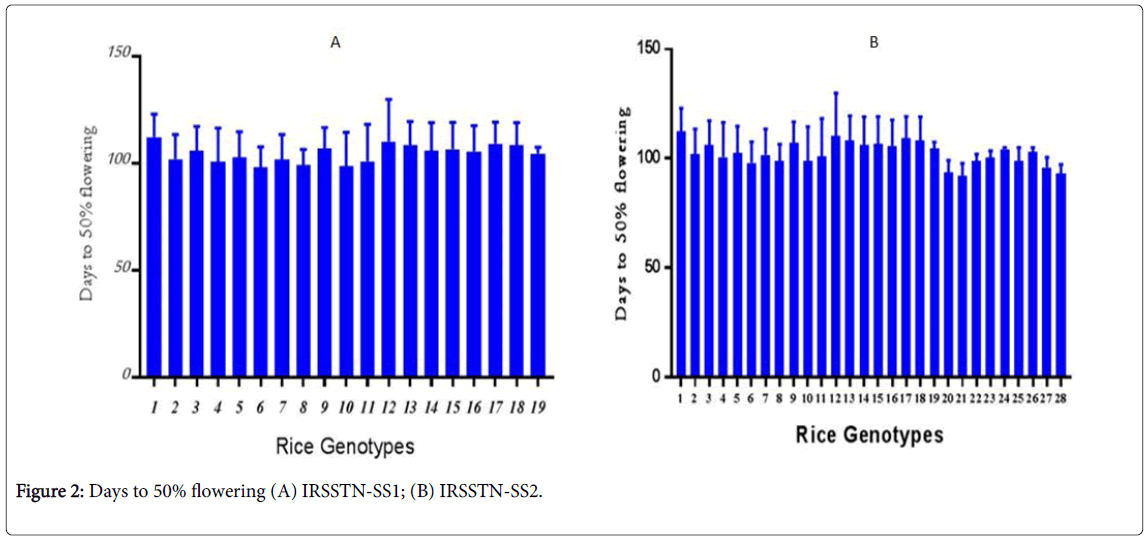
Figure 2: Days to 50% flowering (A) IRSSTN-SS1; (B) IRSSTN-SS2.
Days to maturity
IRSSTN Module 1 is late-maturity (˃130 days). Days to maturity (DM) with AMMRS were greater, with132 day on average, while with IRRI methods. There was 121day, giving AMRRS more than 10 days. The IRSSTN Module 2 is early to medium maturity (˂125 days). AMRRS location gave highest in DM was 137; while the IRRI gave highest in DM was 128 days. This result may be attributed to the nutrient and light availability for plant management (Figure 3). The result identical with Reza et al. [26] suggesting breeding for salinity tolerance using Bangladeshi rice landraces and understand genetic diversity has been limited by the complex and polygenic nature of salt tolerance in rice genotypes [27].
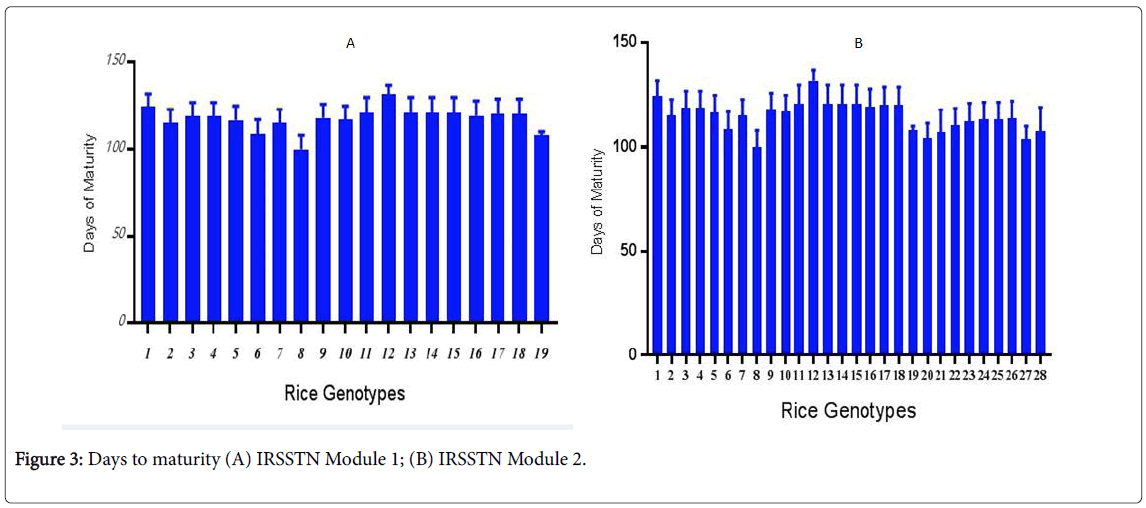
Figure 3: Days to maturity (A) IRSSTN Module 1; (B) IRSSTN Module 2.
Grain yield
Grain Yield According to this summary measure of crop performance, IRSSTN Module 1 was significantly more successful than IRSSTN Module 2. IRSSTN-SS1 gave an average yield of 2.7 t ha-1 compared with 2.5 t ha-1 from IRSSTN-SS2 rice production in AMRRS station (Figure 4). The IRRI location gave the highest in grain yield was 2.0 t ha-1 for IRSSTN-SS2, while the IRSSTN-SS2 rice production in the IRRI gave the highest in grain yield 2.1 t ha-1 (R). This increment of 50% resulted from a combination of factors, including higher grain number per panicle and a lower sterility ratio due to good growing conditions and wide spacing between plants that affects the nutrients and sunlight available to plants. Similar results have been reported from other studies [23,24].
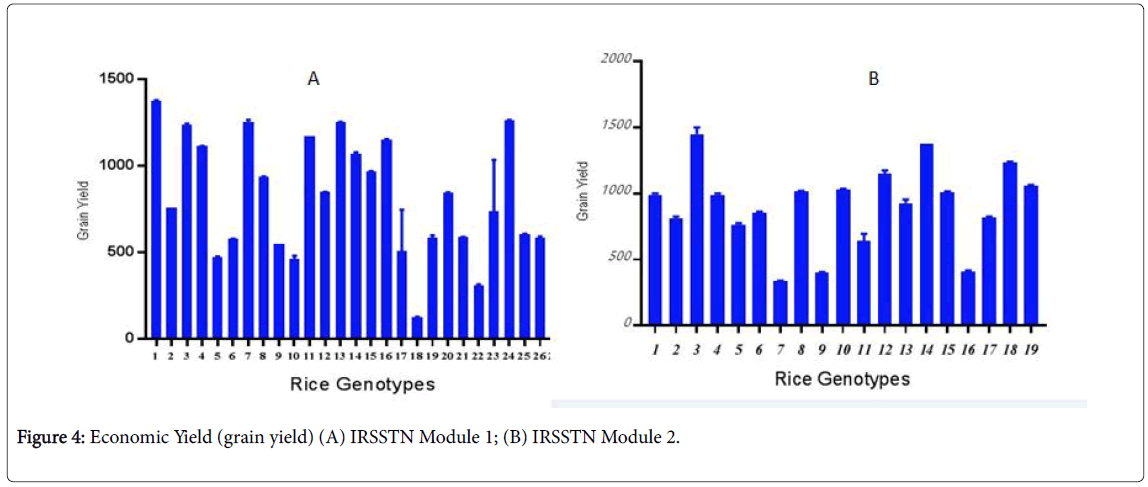
Figure 4: Economic Yield (grain yield) (A) IRSSTN Module 1; (B) IRSSTN Module 2.
Multivariate test statistics (MANOVA)
The MANOVA analysis of the above 3 clusters against the 12 measured variables revealed a significant Wilks’ Lambda statistics (p˂0.0001) Therefore, these three rice groups classified according to the resulted data are truly different from each other and they naturally exist clusters. Thus tested vegetative traits can be utilized effectively to group the IRRI rice accessions.
All IRSSTN-SS1 and 2 rice accessions were grouped into 3 clusters at 0.5 minimum distance between clusters (Figure 5). Numbers of rice accessions in these 3 clusters were 4, 2 and 10 in the first, second and the third clusters, respectively. When consider the grouping behavior of rice accessions, a clear differentiation of rice accessions into three clusters was observed with few exceptions. Thus, cluster I and II represented the rice accessions for traditional varieties and cluster III represented the rice accessions of nutrient intake values (NIVs). Rice accessions, discoveries as far as fluctuation among conventional and recently enhanced rice assortments developed in Sri Lanka with a couple of special cases [28]. This fluctuation was generally noticeable among the customary assortment containing rice increases than NIVs containing promotions. Further, display examine came about a one bunch for NIVs.
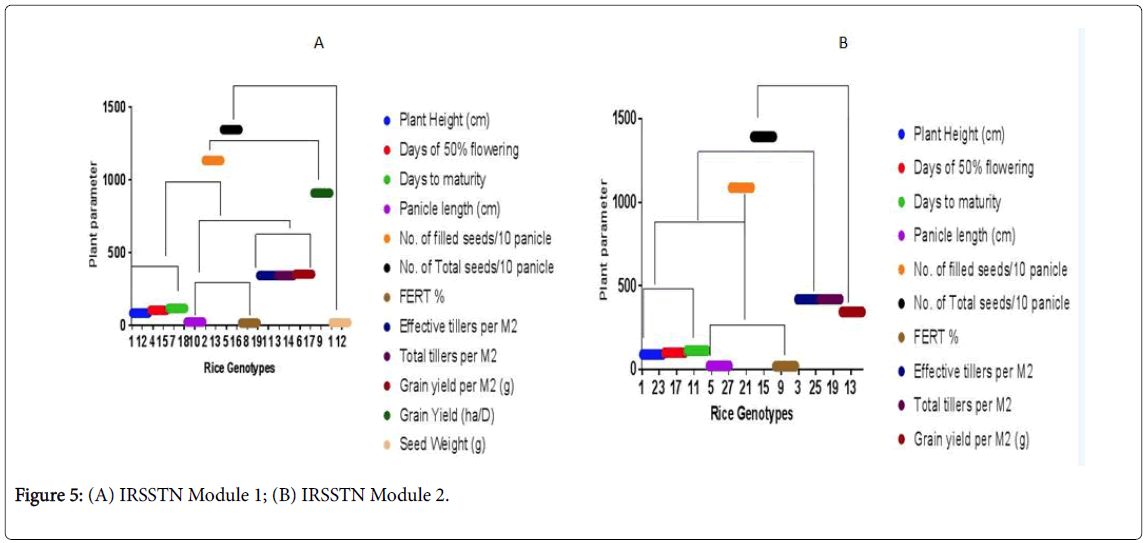
Figure 5: (A) IRSSTN Module 1; (B) IRSSTN Module 2.
Inorganic composition
Macronutrient: Rice genetic differences and Iraqi condition in seed mineral concentrations have been detected and the results showed in Tables 1 and 2. Na, Mg and Ca in the rice seed is lower than that in other parts of the plant, because the mobility of the elements. However, N and P concentrations have been reverse behavior. But K is distributed more uniformly throughout mature plants than N, P, Ca, Mg, and Na [29]. In our study, the content of N, P, K, Ca, Mg and Na varied slightly among IRSSTN Module 1 genotypes. That is, the N content ranged from 1.08 to 1.85 mg kg-1 and only one genotype (IR77664-B-25-1-2-1-3-12-4-AJY1) presented 1.85 mg kg-1 and the rest of the genotypes were closer to 1.5 mg kg-1. P content in IRSSTN Module 1 genotypes ranged from 1.28 to 2.75 g kg-1 however, more than 75% from IRSSTN Module 1 genotypes were closer to 1.5 g kg-1. Potassium content varied between 14 to 42 mg kg-1 was IR50184-3B-18-2B-1 and IR07T114 genotypes respectively, Ca content were between 336.9 to 701.4 mg kg-1 and Mg content were between 613.1 and 1223 mg kg-1. Na content varied between 65.6 to 345.8 mg kg-1 (Table 1). Table 2 showed that IRSSTN Module 2 genotype indicated that the mean of N content was 1.68 mg kg-1 with a range from 1.42 to 1.92 mg kg-1, the P and Ca content varied from 37.06 to 2300 mg kg-1 of P and from 17 to 97 mg kg-1 of Ca. The mean of Na and Mg content was 864.6 mg kg-1 and 153.3 mg kg-1 respectively, varied from 75.89 to 271.6 mg Kg-1 for Na and Mg content was ranged from 737.3 to 1095 mg kg-1.
Lack of mobility of some macro element from vegetative tissue to fruiting structures was effected in accumulation metals in genotypes [29,30].
Micronutrients: In all countries, the rice grains are the primary and cheapest source of trace elements however; their intake does not satisfy the mineral requirements of the population in these countries, so in the developing countries have been developing new genotypes regimented with vitamins such as Colden rice regiment with vitamin A.
The analysis of our data indicated that the IRSSTN genotypes rice significant differences between them for all micronutrients evaluated (Tables 1 and 2). IRSSTN Module 1 genotype indicated that the trace element was positively accumulation with the Cu, Fe, Mn and Zn content. The mean of the Cu, Fe, Mn and Zn content was 16.8, 131.9, 20.2 and 4.3 mg kg-1 respectively. The Cu content varied from 1.3 to 38.4 mg kg-1 and the Fe between 25.26 to 592.9 mg kg-1 and the Mn from 10.86 to 38.2; Zn from 1.45 to 8.49 (Table 1).
In the IRSSTN Module 2 genotypes the mean of Cu content was 4.1 mg kg-1 and varied from 9.0 to 15.6 mg kg-1. The mean of the Fe, Mn and Zn content was 82.4, 15.4 and 4.13 mg kg-1 respectively. Fe was ranged from 24.42 and 140.8 mg kg-1. On other hand, the Mn content varied from 3.9 to 24.1 mg kg-1. The Zn content ranged from 1.47 to 6.54 mg kg-1 (Table 2).
Plant breeding and other strategy to increase the quality of plant seed in arid condition could be the use of adequate methods to increase the nutritive value through the enhancement of the bioavailability of the micronutrients [31] and the reduction of the antinutritional substances present in the seed [11,32,33].
Correlation analysis
The Pearson correlation analysis on the mean of IRSSTN Module 1 genotypes, the N content was negatively correlated with the content of Mg, Na, Ca, Cu, Fe and Zn in the seed and only Mn have positively correlated with the N. The P content was positively correlated with the Mg, Na, Mn, Fe content and highly correlated with Zn. K, Mn and Fe content was insignificant negatively or positively correlated with the macro, micronutrient content. The Mg content was highly positively correlated with the Fe content and insignificant correlated with other elements. The Na content was negatively correlated with the Mn. The Ca content was positively correlated with Zn content. Cu content positively correlated with the Fe and Zn (Table 3 and Figure 6).
| N | P | K | Mg | Na | Ca | Cu | Mn | Fe | Zn | |
|---|---|---|---|---|---|---|---|---|---|---|
| N | 1 | |||||||||
| P | -0.239* | 1 | ||||||||
| K | -0.075 | 0.123 | 1 | |||||||
| Mg | -0.272* | 0.318* | 0.179 | 1 | ||||||
| Na | -0.229* | 0.330* | 0.164 | 0.178 | 1 | |||||
| Ca | -0.250* | -0.038 | 0.039 | -0.187 | -0.099 | 1 | ||||
| Cu | -0.270* | 0.17 | -0.009 | 0.113 | 0.027 | 0.15 | 1 | |||
| Mn | 0.356* | 0.211* | 0.178 | -0.046 | -0.202* | 0.054 | 0.124 | 1 | ||
| Fe | -0.361* | 0.299* | 0.144 | 0.599** | 0.002 | -0.054 | 0.295* | -0.109 | 1 | |
| Zn | -0.234* | 0.439** | -0.068 | 0.13 | -0.092 | 0.234* | 0.208 | 0.052 | 0.177 | 1 |
Table 3: Pearson´s correlation coefficients between macro and micronutrients of IRSSTN-1 rice seed (N = 28). * P ≤ 0.05 ** P ≤ 0.01.
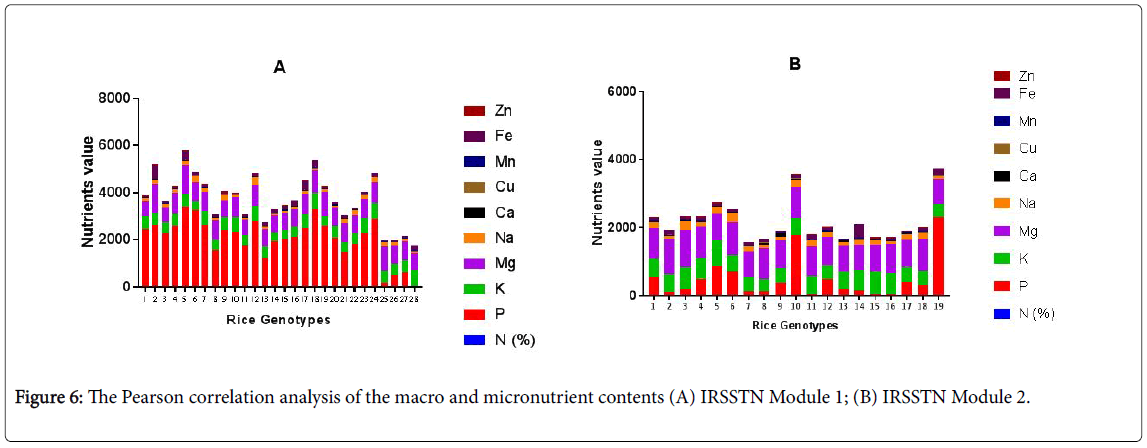
Figure 6: The Pearson correlation analysis of the macro and micronutrient contents (A) IRSSTN Module 1; (B) IRSSTN Module 2.
The mean of 28 IRSSTN Module 2 genotypes correlation showed in Table 4, the N content was correlated positively with K, Na, Cu and Fe and negatively relationship with Ca, Mn of the rice seed. P content has highly negatively correlated with Mn. K content was negatively with Ca and Cu content. Mg content has been positively corrected with Na and Cu content. Negatively correction was detected Na content with Ca and Mn content also has positively corrected with Zn content. Ca highly positively corrected Mn content also negatively corrected with Cu and Zn content. Cu content positively corrected with Fe and Zn content. Mn content has highly negatively corrected with Fe content. Our study was similar results with Ogbodo et al., Wickramasinghe et al., Gelin et al., Pfeiffer and McClafferty [10,19,34,35] in bean seed to increase the micronutrient density on the staple crops for improving the nutritional status and health of poor populations in both the rural and urban areas.
| N | P | K | Mg | Na | Ca | Zn | Cu | Fe | Mn | |
|---|---|---|---|---|---|---|---|---|---|---|
| N | 1 | |||||||||
| P | -0.129 | 1 | ||||||||
| K | 0.295* | -0.184 | 1 | |||||||
| Mg | -0.082 | -0.146 | 0.068 | 1 | ||||||
| Na | 0.252* | 0.147 | 0.230* | 0.376* | 1 | |||||
| Ca | -0.337* | -0.102 | -0.370* | -0.042 | -0.308* | 1 | ||||
| Cu | 0.371* | -0.19 | -0.209* | 0.268* | 0.053 | -0.243* | 1 | |||
| Mn | -0.223* | -0.369** | -0.084 | 0.061 | -0.256* | 0.435** | 0 | 1 | ||
| Fe | 0.301* | 0.069 | 0.145 | -0.187 | -0.041 | -0.116 | 0.209* | 1 | -0.500** | |
| Zn | -0.031 | 0.095 | -0.108 | 0.172 | 0.258* | -0.203* | 1 | 0.263* | -0.407** | 0.189 |
Table 4: Pearson´s correlation coefficients between macro and micronutrients of IRSSTN-2 rice seed (N = 19). * P ≤ 0.05 ** P ≤ 0.01.
Conclusion
Rice vegetative traits can be used effectively in order to capture a considerable morphological variability associated with rice germplasm. The rice samples analyzed presented a wide variability for the macro and micro nutrients evaluated. IRSSTN genotypes of rice has a good level of N, P, Mn, Fe and Zn and did not show significant differences with the IRSSTN model 1 and 2 genotypes under Al-mishkhab, Iraq environmental conditions. N contents was positively correlated with proteins, P, K, Cu, Zn, and Mn contents and negatively correlated with Na, Ca, Mg contents that may be good results and can be promised rice we can culture in Iraqi salinity condition.
References
- Pandit A, Rai V, Bal S, Sinha S, Kumar V, et al. (2010) Combining QTL mapping and transcriptome profiling of bulked RILs for identification of functional polymorphism for salt tolerance genes in rice (Oryza sativa L.). Mol Genet Genomics 284: 121-136.
- Hameed KA, Jaber FA, Hadi AY, Elewi JAH, Uphoff N (2011) Application of System of Rice Intensification (SRI) methods on productivity of Jasmine rice variety in southern Iraq. Jordan J Agri Sci 7: 474-481.
- Aziz A, Siti-fairuz M, Abdullah MZ, Ma NL, Miak M (2015) Fatty acid Profile of Salinity Alinity Tolerant Rice Genotypes Grown on Saline Soil. Malays Appl Biol 44: 119-124.
- Hoque A, Begum SN, Robin AHK, Hassan L (2015) Partitioning of Rice (Oryza sativa L.) Genotypes Based on Morphometric Diversity. AJEA 7: 242-250.
- Sakina A, Ahmed I, Shahzad A, Iqbal M, Asif M (2015) Genetic Variation for Salinity Tolerance in Pakistani Rice (Oryza sativa L.) Germplasm. J Agron Crop Sci 202: 25-36.
- Kumar A, Singh SK, Sharma A, Bhati PK, Dhurai SY (2014) Genetic Divergence for Quantitative Traits in Rice Germplasm. Res J Agric Sci 5: 249-253.
- Kumar V, Singh A, Mithra SA, Krishnamurthy SL, Parida SK, et al. (2015) Genome-wide association mapping of salinity tolerance in rice (Oryza sativa). DNA Res 22:133-145.
- Kshirsagar SS, Rabha M, Samal KC, Bastia DN, Rout GR (2014) Identification of variety diagnostic molecular markerof high-yielding rice varieties. Proc Natl Acad Sci India, Sect B Biol Sci 84: 389-396.
- Munns R, Tester M (2008) Mechanisms of salinity tolerance. Ann Rev Plant Biol 59: 651-681.
- Ogbodo EN (2011) Effect of Crop Residue on Soil Chemical Properties and Rice Yield on an Ultisol at Abakaliki, Southeastern Nigeria. World J Agric Sci 7: 13-18.
- Kosova K, Prašil IT, Vitamvas P (2013) Protein contribution to plant salinity response and tolerance acquisition. Int J Mol Sci 14: 6757-6789.
- Latif M, Rahman M, Kabir M, Ali M, Islam M, et al. (2011) Genetic diversity analyzed by quantitative traits among rice (Oryza sativa L.) genotypes resistant to blast disease. Afr J Microbiol Res 5: 4383-4391.
- Choudhary G, Ranjitkumar N, Surapaneni M, Deborah DA, Vipparla A, et al. (2013) Molecular genetic diversity of major Indian rice cultivars over decadal periods. PLoS ONE 8: e66197.
- Meti N, Samal KC, Bastia DN, Rout GR (2013) Genetic diversity analysis in aromatic rice genotypes using microsatellite based on simple sequence repeat markers. Afr J Biotechnol 12: 4238-4250.
- Awio T, Bua B, Karungi J (2015) Assessing the effects of water management regimes and rice residue on growth and yield of rice in Uganda. African J Exp Agic 7: 141-149.
- Atiyah AH, El-Kaaby Ekhlas AJ, Mouhamad RS, Mohammad RH, AlAnny JA (2017) In Vitro Influence of drought on some physiological parameters in callus induced from seeds of four rice cultivars (Oryza sativa L.). Int J Multidisciplinary and Current Res 5: 1000-1003.
- Mansour MMF (2013) Plasma membrane permeability as an indicator of salt tolerance in plants. Biologia Plantarum 57: 1-10.
- Wickramasinghe HAM, Noda T (2008) Physicochemical properties of starches from Sri Lankan rice varieties. Food Sci Technol Res 14: 49-54.
- Page AL, Miller RH, Kenney DR (1982) Method of Soil Analysis, 2nd (ed) Agron. 9, Publisher, Madiason, Wisconsin.
- Gamage HK, Tetu SG, Chong RW, Ashton J, Packer NH, et al. (2017) Cereal products derived from wheat, sorghum, rice and oats alter the infant gut microbiota in vitro. Scientific Reports 7: 14312.
- Suriyagoda LDB, Thilakarathne RMMS, Nissanka SP, Samitha S (2011) Morphological variation in selected rice (Oryza sativa L.) germplasm of Sri Lanka. J Natn Sci Foundation Sri Lanka 39: 129-137.
- Negrão S, Almadanim MC, Pires IS, Abreu IA, Maroco J, et al. (2013) New allelic variants found in key rice salt-tolerance genes: an association study. Plant Biotechnol J 11: 87-100.
- Thomson MJ, Ocampo M, Egdane J, Rahman MA, Sajise AG, et al. (2010) Characterizing the saltol quantitative trait locus for salinity tolerance in rice. Rice 3: 148-160.
- Kumar K, Kumar M, Kim SR, Ryu H, Cho YG (2013) Insights into genomics of salt stress response in rice. Rice 6: 27.
- Gregorio GB, Senadhira D, Mendoza RD (1997) Screening rice for salinity tolerance. IRRI Discussion Paper Series no. 22. Manila, Philippines: International Rice Research Institute. 1-30.
- Emon RM, Islam MM, Halder J, Fan Y (2015) Genetic diversity and association mapping for salinity tolerance in Bangladeshi rice landraces. The Crop Journal 3: 440-444.
- Xie JH, Zapata-Arias FJ, Shen M, Afza R (2000) Salinity tolerant performance and genetic diversity of four rice varieties. Euphytica 116: 105–110.
- Wijayawardhana HC, Herath HM, Weerasinghe PA, Herath HM (2015) Morphological variation in selected Sri Lankan rice (Oryza sativa L.) accessions in relation to the vegetative parameters. Tropical Agri Res 26: 380-389.
- Moraghan JT, Grafton KF (1997) Accumulation of Ca in bean cultivars differing in seed size. J Sci Food Agric 74: 251-256.
- Guzmán-Maldonado SH, MartÃnez O, Acosta JA, Guevara-Lara F, Paredes-López O (2003) Putative quantitative trait loci for physical and chemical components of common bean. Crop Sci 43: 1029-1035.
- Hotz C, Gibson R (2007) Traditional foodprocessing and preparation practices to enhance the bioavailability of micronutrients in plant-based diets. J Nutr 137: 1097-1100.
- Ghandilyan A, Vreugdenhil D, Aarts MGM (2006) Progress in the genetic understanding of plant iron and zinc nutrition. Physiol Plant 126: 407-417.
- Islam MM, Begum SN, Emon RM, Halder J, Manidas AC (2012) Carbon isotope discrimination in rice under salt affected conditions in Bangladesh, in: IAEA-TECDOC-1617, Greater Agronomic Water Use Efficiency in Wheat and Rice Using Carbon Isotope Discrimination, International Atomic Energy Agency, Vienna 7-23.
- Gelin JR, Forster S, Grafton SK, McClean PE, Rojas-Cifuentes GA (2007) Analysis of seed zinc and other minerals in a recombinant inbred population of navy bean (Phaseolus vulgaris L.). Crop Sci 47: 1361-1366.
- Pfeiffer WH, McClafferty B (2007) HarvestPlus: Breeding crops for better nutrition. Crop Sci 47: S-88-S-105.
Citation: Mouhamad RS, Jaafar ZM, El –Kaaby EAJ, Iqbal M, Arif N (2018) Evaluation of Agronomic Traits and Inorganic Nutritional Composition of Rice Seed from IRSSTN Genotypes in Iraq. J Rice Res 6:189. DOI: 10.4172/2375-4338.1000189
Copyright: © 2018 Mouhamad RS, et al. This is an open-access article distributed under the terms of the Creative Commons Attribution License, which permits unrestricted use, distribution, and reproduction in any medium, provided the original author and source are credited.
Select your language of interest to view the total content in your interested language
Share This Article
Recommended Journals
Open Access Journals
Article Tools
Article Usage
- Total views: 7259
- [From(publication date): 0-2018 - Dec 09, 2025]
- Breakdown by view type
- HTML page views: 5714
- PDF downloads: 1545