Evaluation of Land Cover Changes at the Coast of Sindh through Successive Landsat Imageries
Received: 23-Oct-2015 / Accepted Date: 11-Dec-2015 / Published Date: 14-Dec-2015 DOI: 10.4172/2157-7617.1000325
Abstract
Satellite remote sensing is the most readily available and updated data source for detection, quantification, and mapping of Land-use/Land Cover (LULC) patterns and changes because of its repetitive data acquisition, digital format suitable for computer processing, and accurate geo-referencing procedures. The objective of the study is to analyze the land cover changes and to examine the Land Surface Temperature (LST) with other climatic effects on the Sindh coastal region. Satellite images of Landsat-7 ETM+, Landsat-5 TM and Landsat-8 OLI/TIRS were used in the study, acquired on March 08, 2000, November 20, 2009 and April 08, 2014 respectively. The land cover classes selected for the study are vegetation, mudflat, built-up/vacant land, shallow water and deep water. Maximum likelihood supervised classification and LST techniques were used in the study. The results of the classification mainly consist of land cover classes for 2000, 2009 and 2014, respectively. The land cover in the study area is under the serious threat of climate change. The major cause of ecological, environmental and land use degradation of Indus delta is reduction in fresh water flow, sea water intrusion and natural disasters. Sindh coastline is widely exposed to the disasters like heavy rains, floods, frequent storms and cyclones. This coast faces cyclones approximately every year. Eastern part of Sindh Province is at high risk of tropical cyclones. It is a huge threat to the land covers, biodiversity and human population.
Keywords: Coastal climate change; GIS; Land surface temperature; Maximum likelihood supervised classification; Natural disaster; Remote sensing; Sea water intrusion
10489Introduction
Satellite remote sensing is a useful technique to observe environmental changes, which are introduced as a result of manmade activities and physical phenomenon. It has become a helpful cost effective tool for outstanding judgment and understanding landuse/ land cover changes, sea level rise, especially in surveillance of environmental protection, river delta, bio-diversity and sustainable development of seashore. Remote sensing system provides a wide range of acquisition of spatial data for the assessment of coastal regions to Geographical Information system (GIS); that ability to the identification of the coastline monitoring [1-4]. In recent years, satellite remote sensing data has been used in automatic or semiautomatic coastline identification [5] without going to survey. LST is a successful way of processing to dividing lantern heat fluxes and such as surface radiant temperature as an expression of changing surface soil water content and vegetation cover [6].
Many land uses are disturbed in Sindh coast, due to seawater intrusion, reduction of fresh water. The estimate shows that 150 MAF water available from the Indus catchment [7]. The quantity of sweet water flow has been reduced about 35 MAF over a period of last 60 years. The slow discharge of water rate in Indus River is continued from last six decades. Many barrages and dams have been constructed on the river. Agriculture land rejoiced, forest area has declined, wildlife, vegetation and fishes are in dangerous condition [8], exposed mudflats, localize erosion, high turbidity in the tidal creeks. Coastal areas are very valuable in view of human beings and more dynamics for land use due to urbanization and industrialization [9]. Coastline change due to erosion and deposition is an important phenomenon for management of a coastal zone. Rapid and considerable impacts of vulnerable hazards need to be mitigated through new technologies and techniques. Over the last two decades, it is used to determine the coastline transformation by visual interpretation [10,11]. Coastline change images are usually quite accurate; mainly depends upon the image quality and enhancement methods. Those are used during the processing which increases the chance of better analyses for mapping by Boak and Turner [10]. A Survey conducted by the government of Sindh indicated that in Thatta and Badin district over 486,000 hectares land were eroded by the sea intrusion [8].
Study Area
Study area for this research is Sindh coastline. Specifically, from Sandspit to Kajhar Creek, which is stretched over 370 km among 1100 km of the Pakistan coast in the north of Arabian Sea (Figure 1). Selected area of study is having geographical coordinates “24°50'19.16"N, 66°49'20.89"E” to “23°45'41.40"N, 67°56'19.99"E”. Sindh coastal are extend on Karachi, Thatta and Badin district. This area is famous for its rich productivity and geomorphologic features. It has deltaic plain, sandy beaches, lagoons and rocky hill structures. Although, it is most climatic vulnerable coastal zone of Pakistan. Especially, in terms of cyclones, tsunami, sea levels rise. Subduction of Indian plate causes uplifting of the coastal surface of Sindh about 1-2 mm/year.
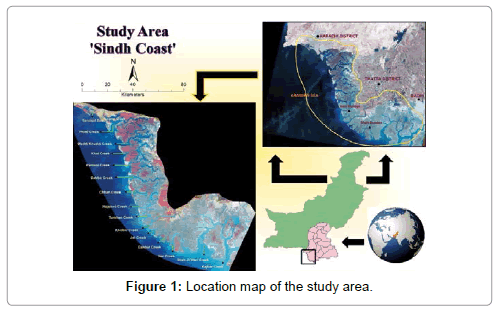
Figure 1: Location map of the study area.
Objective
• To analyze the land cover changes at the Sindh coast through medium resolution satellite data.
• To examine the LST and the effect of climate change on the coastal region of Sindh.
Methodology
Data acquisition
Two main sources of data collection are used. Most important source is primary data source; i.e. Satellite data, which is the main content of the study. Secondary source of data is collected from governmental, non-governmental organizations and published materials. The methodological framework of the study shown in Figure 2.
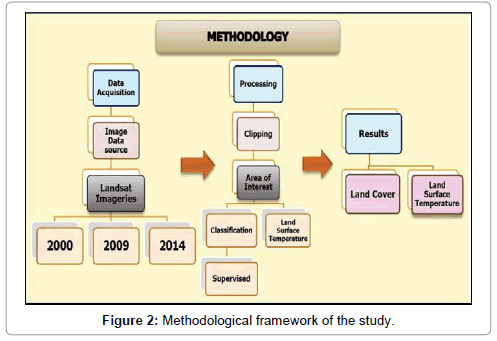
Figure 2: Methodological framework of the study.
Satellite data: The satellite data was downloaded from official earth explorer USGS distribution website (earthexplorer.usgs.gov) for baseline study. One patch from the Worldwide Reference System (WRS-2) of path 152 and row 043 (Table 1) as shown in Figure 3.
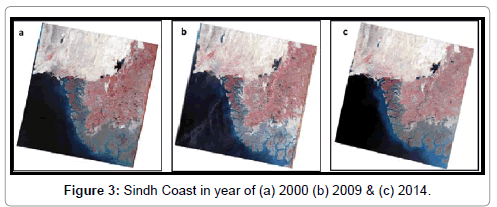
Figure 3: Sindh Coast in year of (a) 2000 (b) 2009 & (c) 2014.
| Sr. No. | Date of Acquisition | Satellite | Sensors | Bands | Resolution (m) |
|---|---|---|---|---|---|
| 1. | 08-04-2014 | LANDSAT-8 | OLI / TIRS | 11 | 30 |
| 2. | 20-11-2009 | LANDSAT-5 | TM | 7 | 30 |
| 3. | 08-03-2000 | LANDSAT-7 | ETM+ | 7 | 30 |
Table 1: Details of Landsat data collected.
Published data: The published research work from different relevant articles is used to get the guidance for this study.
Processing
Software: After collection of data, RS and GIS softwares are used for the analysis and further processing. These softwares are ERDAS Imagine 2013 and ArcGIS 10.1.
RS and GIS techniques: Two analyses were performed to obtain the results, later than enhancement and extraction of area of interest from the image. One is supervised classification and other is LST.
Supervised classification: Supervised classification is defined informally as the process of using samples of known identity to classify pixels of unknown identity [12]. Samples of known identity are pixels located within training areas [12,13]. Once the training regions are selected, image procedureing software is used to find out the statistical parameters for each information class. The image is then classified by examining the reflectance for each pixel and making a decision about which of the information class it resembles the most. There are numerous potential sources of error connected with supervised classification [12]. First, the analyst-defined classes may not match the natural classes that exist within the data, and therefore may not be distinct or well defined. Secondly, these classes are based on informational class and spectral properties of the image. Classes may not be representative of conditions encountered throughout the image so the analyst can have problem in matching potential classes as defined on maps and aerial photographs [13]. Supervised classification of acquired images was carried out with the help of ERDAS Imagine 2013.
Accuracy assesment: It shows how well the classification is performed. One of the widely used ways to determine classification accuracy is the class confusion matrix, sometimes also referred to as contingency matrix or error matrix. In order to properly generate an error matrix, one must consider the following factors [14]:
• Ground truth data collection
• Classification scheme
• Sampling scheme
• Spatial autocorrelation
• Sample size and sample unit
Land surface temperature: LST is the main aspect measuring factor determining energy exchange and surface radiation [15]. LST is a numerical or other measurable factors in the in the physical processes of energy of surface and equality of water at local through global scales [16-20]. In the recent year, thermal environment has been concentrated including greenhouse effect and global warming; it refers to the air temperature and the LST [20]. There are a diversity of reasons for the urban/rural temperature variance: (a) changes in the physical characteristics of the surface (albedo, thermal capacity, heat conductivity), owing to the replacement of vegetation by asphalt and concrete; (b) the decrease of surface moisture accessible for evapotranspiration; (c) changes in the radiative fluxes and in the near surface flow, resulting from the complicated geometry of streets and tall buildings; and (d) anthropogenic heat emissions [21]. The Digital Number (DN) of thermal infrared band is converted in to radiance using the equation supplied by the Landsat user’s hand book [22].

Where,
LMAX=the spectral radiance that is scaled to QCALMAX in W/ (m2 * sr * μm)
LMIN=the spectral radiance that is scaled to QCALMIN in W/ (m2 * sr * μm)
QCALMIN=the lowest quantized calibrated pixel value (corresponding to LMIN) in DN=1,
QCALMAX=the maximum quantized calibrated pixel value (corresponding to LMIN) in DN=255 (TM/ETM+),
QCAL=DN
The above spectral radiance values from the TM/ETM+/OLI/TIRS thermal band were transformed to brightness temperature according to (2). Brightness temperature, NDVI, and emissivity were first calculated from TM and ETM+ images, which were then used to compute LST.
TB=K2/Log {(K1/Radiance) +1)} (2)
Where,
TB=the effective at-satellite brightness temperature in Kelvin;
K1=666.09 (watts/ (meter2 × ster × μm))
K2=1282.71 (Kelvin) are calibration constants; and
The final LST is estimated by the following equation (3):
LST=TB/{1+ (λ*BT/ρ*logε)} (3)
TB=Brightness Temperature
λ=Wavelength of emitted radiance (11.5 μm)
ρ= h × c/σ =1.438 × 10⁻² mK (σ=Boltzmann constant=1.38 × 10- 23 J/K,
h=Planck’s constant=6.626 × 10⁻³⁴ Js, c=velocity of light=2.998 × 10⁸ m/s)
ε=Land surface emissivity
Data Representations
The final data analysis is shown in form of layouts, bar graphs and pie graphs.
Results and Discussion
Land cover changes using supervised classification of 2000, 2009 and 2014
Land cover of the study area divided into five different classes. Most importantly, the variation in between mudflats and vegetation were derived. These were extracted from the classified image of year 2000, 2009 and 2014. The temporal changes in between these classes were identified through graphical values. The total land cover area of 2000 is 908204.1 hectares, which increased after 9 year period and became 908587.5 hectares in 2009 (Figure 4). In the other hand, after a small period of 5 years, a drastic turn down showed the land degradation and 9070904.2 hectares calculated in 2014. The changes in total area were 383.4 hectares in 2000-2009, -683.3 hectares in 2009-2014 and -299.9 hectares in 2000-2014 respectively. As shown in (Figure 5). Figures 6-8 shows that Mudflat covered 34% in 2000; decrease 27% in 2009 and coastal area of Sindh in 2000-2009due to cyclones vulnerability in the region. Like Onil hit the Sindh coast in 2nd October, 2004. While in 2014, mudflats increased 34%. Built-up/Vacant land (including some built up land of DHA, Karachi and vacant land of around mudflats) covered 9% in 2000, increase 13% in 2009 and decrease in 7% in 2014. Change of land-use/landcover in 2000-2009 is 35207.5 hectares during 9 years and change of land-use/landcover in 2009-2014 is -54825.2 hectares, and change of land-use/landcover in 2000-2014 is 1939 hectares. These changes in land are quite noticeable in respected periods. The most important reason triggering sea intrusion is the shortage of fresh water in Indus River, According to survey of board of revenue over the 1,200,000 acres of fertile land lossed due to the sea water intrusion (Figure 9). The Vegetation (including mangroves and mix vegetation) was less in 2000 which is 7% of the total area. It extended up to 9% in 2009 and a greater increase of 15% was noticed in 2014. The results of recent year are unexpected due to flood years of 2010, 2011, 2012, 2013, 2014 and 2015 which increased the fertility of soil in the area. These phenomena changed the whole scenario of the Thatta coastal belt. These significant changes in vegetation also remarkable due to the influence of awareness parameters among the local people.Several hundred plants of Rhizophora mucronata mangroves were planted during the day-long operation on the thatta coast land, where 451,176 mangrove saplings were planted on July 15,2009 credit by Forest Department shown Figure 10a, tomatoes cultivated shown in Figure 10b, way of settlements in Figure 10c and occupation of people in thatta coast is fishing shown in Figure 10d.
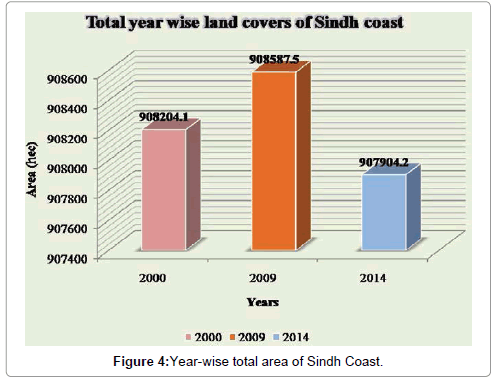
Figure 4: Year-wise total area of Sindh Coast.
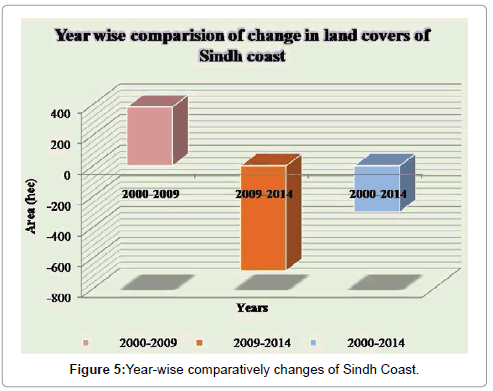
Figure 5: Year-wise comparatively changes of Sindh Coast.
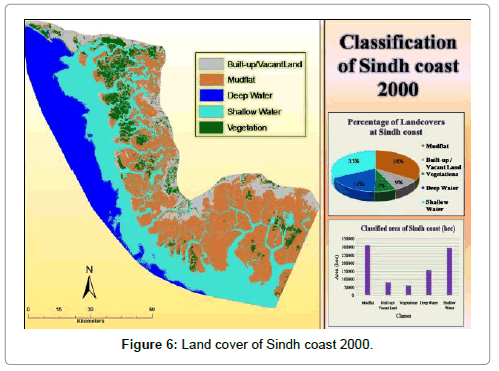
Figure 6: Land cover of Sindh coast 2000.
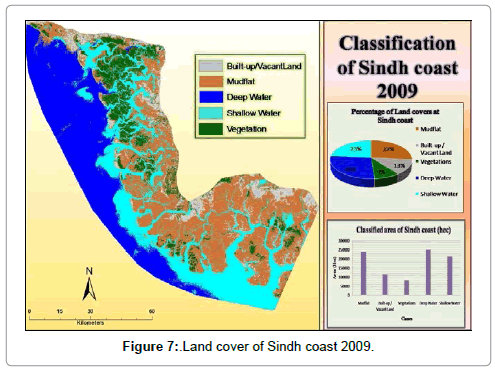
Figure 7: Land cover of Sindh coast 2009.
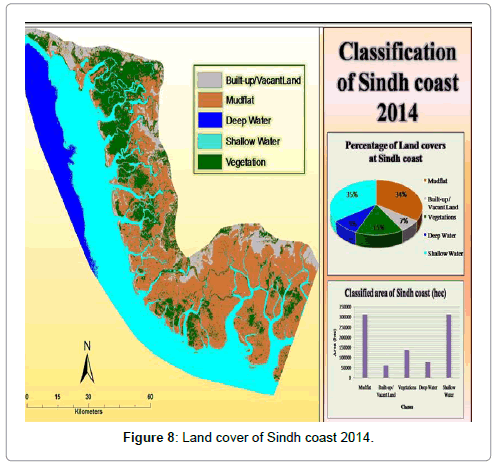
Figure 8: Land cover of Sindh coast 2014.
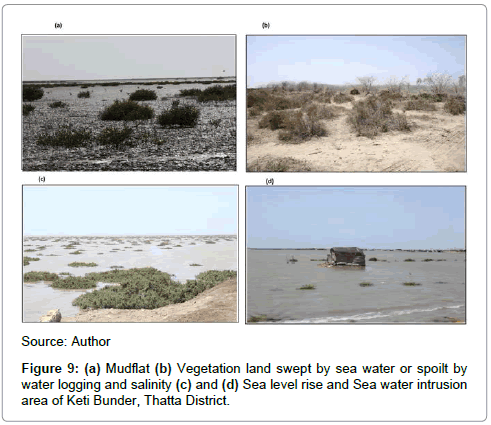
Figure 9: (a) Mudflat (b) Vegetation land swept by sea water or spoilt by water logging and salinity (c) and (d) Sea level rise and Sea water intrusion area of Keti Bunder, Thatta District.
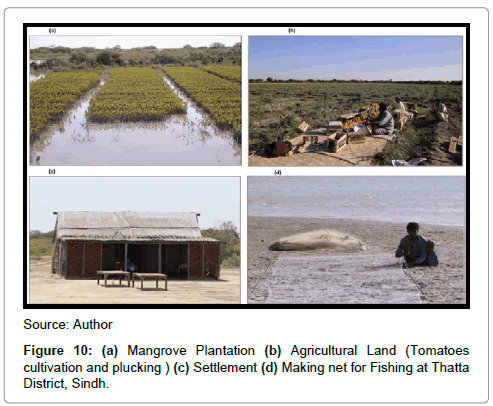
Figure 10: (a) Mangrove Plantation (b) Agricultural Land (Tomatoes cultivation and plucking ) (c) Settlement (d) Making net for Fishing at Thatta District, Sindh.
Overall, the vegetation cover in the study area is under the serious threats of cyclones, floods and seawater intrusion (Figure 9). The overall classification accuracy assessment results showed 88% with Kappa statistics 0.8372, 92% with 0.8973 and 78% with 0.7009 for ETM 2000, TM 2009 and OLI/TIRS respectively.
Land surface temperature of 2000, 2009 and 2014
LST of 2000: Figure 11 and Table 2 are showing the LST ranged from 17.1°C to 46.1°C with a mean of 23.7°C. It was observed that red color in the image highlighted the temperature range from 43°C to 46°C, which was covered very small part. It is not noticiable in the image. The Small area having Temperature range (29°C to 41°C), covering north, north-eastern part, south western part like coast of Khal, Paitiani, Dabbo, Chhan, Hajamro creeks, Bhuda island and DHA area shown in light green, light yellow and yellow color of the image, mostly cover vacant/barren land. Where temperature ranges from 23°C to 29°C and covering mudflats and wet soil. Lowest temperature ranges from 17C to 23°C these were existing in water bodies.
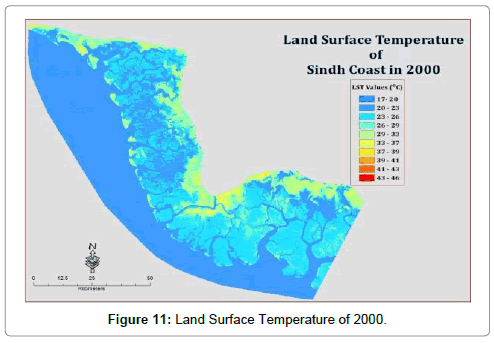
Figure 11: Land Surface Temperature of 2000.
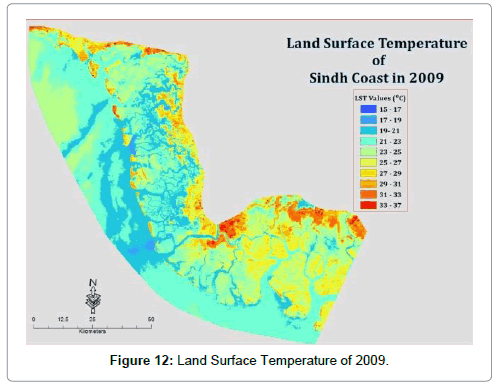
Figure 12: Land Surface Temperature of 2009.
| Sr. No. | Year of LST Images | Minimum Temperature (°C) | Maximum Temperature (°C) | Mean Temperature (°C) |
|---|---|---|---|---|
| 1 | 08-03-2000 | 17.1 | 46.1 | 23.7 |
| 2 | 20-11-2009 | 15.7 | 37.3 | 23.3 |
| 3 | 08-04-2014 | 9.0 | 33.4 | 15.6 |
Table 2: LST values of 2000, 2009 and 2014.
LST of 2009: Figure 12 and Table 2 are describing the LST ranged from 15.7°C to 37.3°C with a mean of 23.3°C. It was observed in the image by red, light orange and orange colors show the temperature range from 29°C to 37C, it was mainly in north, north-eastern part, south western part like coast of Khal, Paitiani, Dabbo, Chhan, Hajamro creeks, Bhuda Island and DHA area, mostly covered with vacant/ barren land. Some of temperature ranges (25°C to 29°C) are covering mudflats, vegetation and wet soil area as shown in yellow and light yellow colors. Lowest temperature ranges from 15°C to 21°C exist in water bodies.
LST of 2014: In Figure 13 and table 2, the LST ranged from 9°C to 33.4°C with a mean of 15.6°C. It was observed in the image that red, light orange and orange colors are showing the temperature range from 25°C to 33°C, it is mainly north and north-eastern part, which mostly covers vacant/barren land. Temperature ranges from 19°C to 25°C, that is covering mudflats, vegetation, wet soil and some vacant area as shown in yellow and light yellow colors. Lowest temperature ranges from 9°C to 17°C are existing in water body.
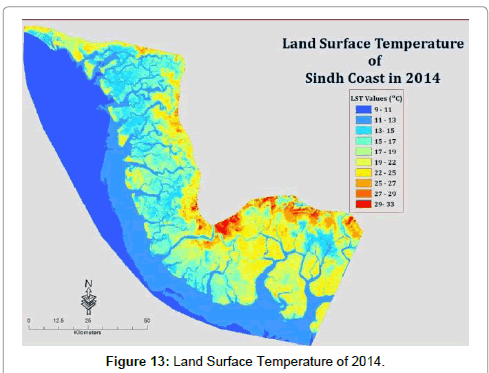
Figure 13: Land Surface Temperature of 2014.
Climatic factors affecting land cover changes
Cyclone: Satellite imageries provide extensive information about extreme weather patterns like Tropical cyclones. These are part of climate of tropical region of Asia, which affect various countries in the region including Pakistan. The intensity and frequency of these cyclones are increased in the end of 19th century. It goes more destructive with the sea level rise, high tides and motions of waves. It even raised the loss of life, infrastructure and erode the land area [23] Figure 14. As became a coastal country of Arabian Sea, Pakistan has had many drastic transformations. These changes are aggregate day by day. It is usually occur due to the negative beach development, tectonic plate movement, climatic patterns, while increased motion of tides and waves due to sea level rise; affects the land mass. Wind movement is also affecting the erosion phenomena which are highly significant in the area. In past, Sindh coastline is widely exposed to disasters like flood, frequent storms, and cyclones. This coast faced cyclones approximately every year. As shown in Figure 15a and 15b [24]. During the last 100 years, major cyclones hit the Sindh coast recorded in May 1902, June 1926, June 1964, November 1993, June 1998, May 1999 (Cyclone- 02A), 2004 (Cyclone Onil), June 2007(Cyclone ‘Gonu’ and ‘Yemyin’), 2010 (PHET), 2011(KIELA) and 2014 (Nelofar). Eastern part of Sindh province is at high risk of tropical cyclones. These cyclones are huge threat to the land covers, biodiversity and human population [25]. It is recorded that the intrusion of sea water is reached approximately 80km in Thatta, Badin and Hyderabad. This overwhelm is act as a disaster for the region. The intensity of up streaming in this particular area is more than 2-4 mm per year because of subsidence [26]. Western part of this coastline is also declared as under threat of erosion Figure 16.
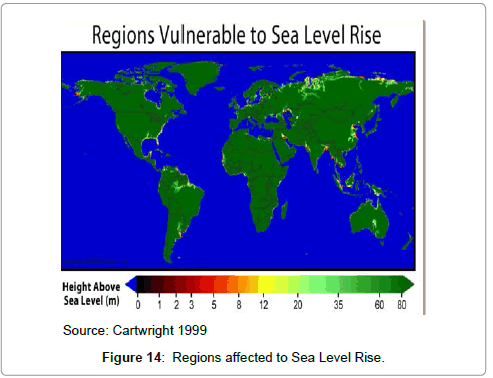
Figure 14: Regions affected to Sea Level Rise.
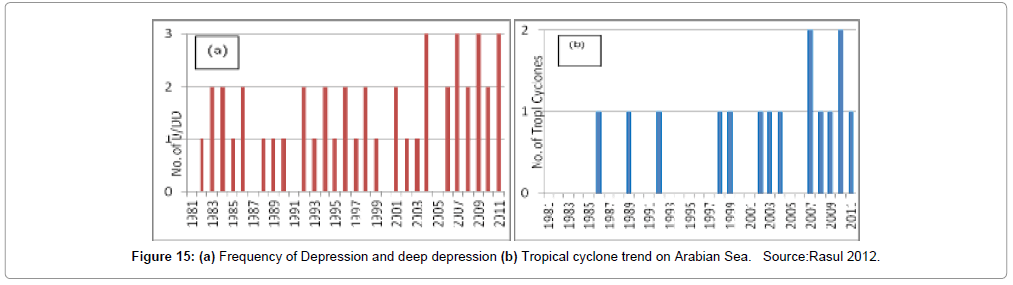
Figure 15: (a) Frequency of Depression and deep depression (b) Tropical cyclone trend on Arabian Sea. Source:Rasul 2012.
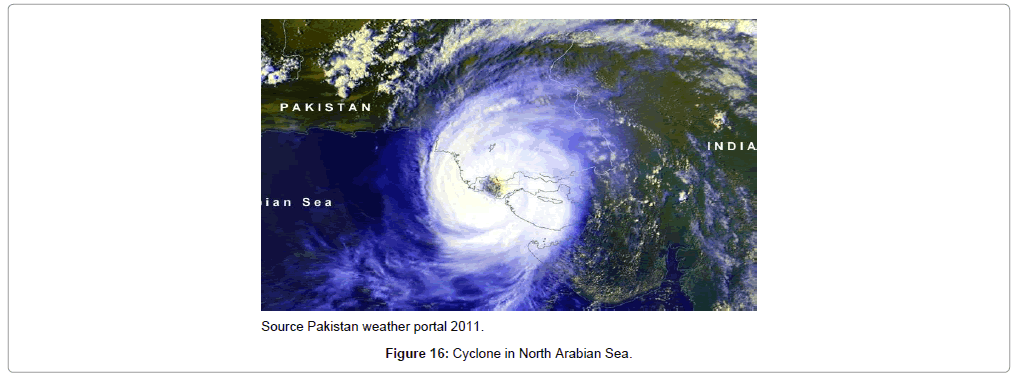
Figure 16: Cyclone in North Arabian Sea.
Flood/Rain: The devastative floods in Pakistan were in year 1956, 1957, 1958, 1973, 1975, 1976, 1979, 1992, 1994, 1995, 2003, 2005, 2007, 2010, 2011, 2012, 2013, 2014 and 2015. A flood is an overflow of an expanse of water that submerges land. District Thatta occasionally experiences the slow and fast kind of riverine flood in monsoon. The Indus river affects eight talukas of the district having length of 80 miles towards left bank and 93 miles towards the right bank. Kotri Barrage is located at the tail of Indus River so the district has an advantage that enough time is always available for preparation as the flood warning is received in advance. Figure 17 shows floods in thatta district (Table 3).
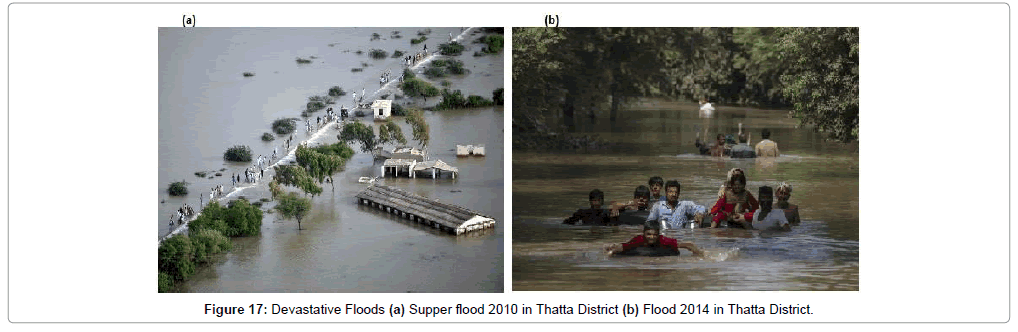
Figure 17: Devastative Floods (a) Supper flood 2010 in Thatta District (b) Flood 2014 in Thatta District.
| Sr. No: | District | Hazard |
|---|---|---|
| 1 | Karachi | Urban flooding |
| 2 | Thatta | Riverine flood, Heavy rainfall, Floods, Cyclone |
| 3 | Badin | LBOD, Heavy rainfall |
Table 3: Sindh coastal districts vulnerable to Monsoon/Flood Hazards.
Conclusion
The Sindh coast is evident of significant disasters, which is describing through major historical events. Remote sensing satellite data identifies the risk and threats to this major productive zone of Pakistan coast. Furthermore, it is clearly indicated towards the land destruction and degradation at the coast of Sindh because of Human and Natural phenomena. It can be interpret and predict with the help of satellite imageries. Therefore, Landsat Imageries are very much helpful to analyse and examine the land cover changes in isolated and remote areas. It provides a vast range of bands for the detection of special patches in the area. Finally, temporal datasets give a good comparison of the historical and present condition in the study area.The Land cover of Sindh coast is continuously changing with respect to time period. Special changes have been noticed in vegetation, mud flats and other land use areas.Though, the sea water intrusion is pointing towards the high erosion rate at the coast. It is also affecting the Morphology of the whole coastline of Sindh. It can be reduced with the help of proper monitoring and mitigation through consecutive new technologies.
Acknowledgement
Authors are grateful to Dr. Saima Shaikh, Department of Geography, and University of Karachi for assistance during the work. The authors would also like to thanks Mr. Tarique Gazdar, Retired Section Officer, Energy Department, Government of Sindh and Mr. Danish Ahmed, Associate photographer, Antiquities Department, GoS for guidance and support.
References
- Chen X, Vierling L, Deering D (2005) A simple and effective radiometric correction method to improve landscape change detection across sensors and across time. Remote Sensing Environ 98: 6379.
- Jensen JR (1996) Introductory Digital Image Processing: A Remote Sensing Perspective. (2nd ed.) Prentice Hall, Upper Saddle River, NJ.
- Lu D, Mausel P, Brondizio E, Moran E (2004) Change detection techniques. Int J Remote Sensing 25: 2365e2407.
- White K, Asma HME (1998) Monitoring changi ng position of coastlines using Thematic Mapper imagery an example from the Nile Delta.
- Guariglia A, Buonamassa A, Losurdo A, Saladino R, Trivigno ML et al. (2006) A multisource approach for coastline mapping and identification of shoreline changes. Annals of Geophysic 49: 295-304.
- Gallo KP, Owen TW (1998a) Assessment of urban heat island: a multisensor perspective for the Dallas-Ft. Worth, USA region. Geocarto Int 13: 35-41.
- IUCN (1991) Effects of the Indus water accord on the Indus delta ecosystem. Korangi, Ecosystem Project, IUCN (International Union for Conservation of Nature) Pakistan p. 22.
- Memon AA (2004) Evaluation of impacts on the lower Indus River basin due to upstream water storage and Diversion. World Water and Environmental Resources Congress, American Society of Civil Engineers, Environmental and Water Resources Institute, Salt Lake City, Utah.
- Santhiya G, Lakshumanan C, Muthukumar S (2010) Mapping of Landuse/Landcover Changes of Chennai Coast and Issues related to Coastal Environment Using Remote Sensing and GIS. Centre for Remote Sensing, Bharathidasan University, Tiruchirappalli, India.
- Boak EH, Turner IL (2005) Shoreline definition and detection: a review. J Coast of Res 21: 688-703.
- Cui BL, Li XY (2011) Coastline change of the Yellow River estuary and its response to the sediment and runoff (1976-2005). Geomorphol 127: 32-40.
- Campbell BJ (2002) Introduction to Remote Sensing. (3rdedn) London: Taylor and Francis.
- SohailA(2012) Mapping Landcover/Landuse and Coastline Change in the Eastern Mekong Delta (Viet Nam) from 1989 to 2002 using Remote Sensing. Master’s of Science Thesis in Geoinformatics, School of Architecture and the Built Environment, Royal Institute of Technology (KTH), Stockholm, Sweden.
- Congalton RG, Ploured L (2002) Quality Assurance and Accuracy Assessment of Information Derived from Remotely Sensed Data. Manual of Geospatial Science and Technology. London: Taylor and Francis.
- Bobrinskaya M (2012) Remote Sensing for Analysis of relationships between Land Cover and Land Surface Temperature in Ten Megacities. Master’s of Science Thesis in Geoinformatics, TRITA-GIT EX 12-008, School of Architecture and the Built Environment, Royal Institute of Technology (KTH), Stockholm, Sweden.
- Anderson MC, Norman JM, Kustas WP, Houborg R, Starks PJ, et al. (2008) A thermal based remote sensing technique for routine mapping of land-surface carbon, water and energy fluxes from field to regional scales. Remote Sensing of Environment 112: 4227-4241.
- Brunsell NA, Gillies RR (2003) Length scale analysis of surface energy fluxes derived from remote sensing. J Hydrometeorol 4: 1212-1219.
- Karnieli A, Agam N, Pinker RT, Anderson M, Imhoff ML, et al. (2010) Use of NDVI and land surface temperature for drought assessment: Merits and limitations. J Climate 23: 618-633.
- Kustas W, Anderson M (2009) Advances in thermal infrared remote sensing for land surface modeling. Agricultural and Forest Meteorol 149: 2071-2081.
- Zhang R, Tian J, Su H, Sun X, Chen S, et al. (2008) Two improvements of an operational two-layer model for terrestrial surface heat flux retrieval. Sensors 8: 6165-6187.
- Dousset B, Gourmelon F (2003) Satellite multi-sensor data analysis of urban surface temperaturesand land cover. ISPRS J Photogramm 58: 43-54.
- National Aeronautics and Space Administration (2004) Landsat Project Science Office: Landsat-7 Science data users hand book. Chapter: 11, Data Products.
- Cartwright DE (1999) Tides: A Scientific History.Cambridge, United Kingdom Cambridge University Press. 292 p.
- Rasul G, Mahmood A, Sadiq A, Khan SI (2012) Vulnerability of the Indus Delta to Climate Change in Pakistan. Pakistan J Meteorol 8.
- Farooqi A, Khan AAH, Hazrat M (2005) Climate change perspective in Pakistan. Pakistan J Meteorol 2: 11-21.
- Khan B, Muhammad JI, Khan MA (2011) Flood risk assessment of River Indus of Pakistan. Arab J Geosci 4: 115-122.
Citation: Rehman Z, Khanum F, Kazmi SJH (2016) Evaluation of Land Cover Changes at the Coast of Sindh through Successive Landsat Imageries. 7: 325. DOI: 10.4172/2157-7617.1000325
Copyright: © 2016 Rehman Zu, et al. This is an open-access article distributed under the terms of the Creative Commons Attribution License, which permits unrestricted use, distribution, and reproduction in any medium, provided the original author and source are credited.
Select your language of interest to view the total content in your interested language
Share This Article
Recommended Journals
Open Access Journals
Article Tools
Article Usage
- Total views: 15512
- [From(publication date): 1-2016 - Jun 28, 2025]
- Breakdown by view type
- HTML page views: 14285
- PDF downloads: 1227