Evolution of Soil Extractable Nitrogen as Affected by Winter Flooding and Straw Burning in Southern Spain Rice Systems
Received: 30-Jun-2017 / Accepted Date: 04-Aug-2017 / Published Date: 08-Aug-2017 DOI: 10.4172/2375-4338.1000185
Abstract
This study tested the effects of straw burning and winter flooding on soil nitrogen (N) dynamics in Southern Spain rice (Oryza sativa L.) systems during two consecutive seasons. Experiments were established in Isla Menor shire, in the Guadalquivir Marshes, with main plot treatments being winter flooding (F) or non-flooding (NF); and two straw management practices (burning before puddling or incorporating the whole harvest remains) as subplot treatments. Fertilizer was applied to the plots at the recommended levels for each site, but within each plot a zero nitrogen microplot was established. Total straw inputs before winter flooding averaged 11,235 kg ha-1 for the non-burn treatments and 3,976 kg ha-1 for the burn treatment (straw N inputs ranged from 24 to 85 kg ha-1). Burning (B) part of the harvest remains reduced the biomass and the N inputs into the soil by approximately 65% with respect to nonburning (NB). Before flooding the field for planting, there was 13% less biomass in winter flooded plots compared to non-flooded plots. Winter flooding of the plots did not influence significantly the total extractable N (Ex N: NO3- + NH4+) availability throughout the season, although the treatment that provided more ExN - and in a faster way - to the crop in both seasons was the F/NB combination. However, there were significant differences between treatments in the content of ExN in the soil at specific moments, almost always resulting higher in F and NB treatments. Grain yield and plant height did not vary significantly among treatments during the two seasons. Both the B/NB and the F/NF treatments presented agro-environmental advantages and disadvantages and the cumulative effect of these practices on ExN and some agrophysiological rice parameters over several years should be studied in Southern Spain in order to optimize the recommended N-fertilizers rate.
Keywords: Oryza sativa; Winter flooding; Harvest residues burning; Extractable nitrogen
36044Abbreviations
ExN: Extractable Nitrogen; F: Flooded; NF: Nonflooded; B: Burn; NB: Nonburn
Introduction
In Southern Spain rice systems, several economic and environmental aspects have resulted in changes in the way the harvest remains- i.e. stubble cane plus chopped straw - are managed. These remains can be eliminated by three possible ways: burning, removal for offsite use, and in-field decomposition by puddling. The Andalusian Specific Regulation of Integrated Production in Rice (BOJA num. 39, 27th February 2012) prohibits the rice straw burning before November 30th and only concedes burning authorizations under the incidence or hazard of some diseases or pests that may overwinter in the straw. These limitations have led to a more difficult and less effective burning process, as well as a strong decline of harvest remains burning with respect to their incorporation into the soil during the last years. Removing straw for off-farm use could also alleviate these concerns, but rice straw has little commercial interest [1]. Therefore, in-field decomposition is the most viable option for many farmers nowadays. Nevertheless, large amounts of harvest remains in the field before spring field operations can interfere with field operations and may immobilize nitrogen [2]. The mixing degree of harvest remains and soil depends on cultural practices and soil characteristics [3,4]. As a result of puddling, soil particles are deposited by gravity and undergo stratification in layers of clay, silt and sand [5]. In addition, bulk density increases, water content decreases, despite the soil is waterlogged, and gases are trapped in the mud layer. Some other studies [6,7] demonstrated that incorporating harvest remains during the fall or early winter led to lower nitrogen (N) immobilization and higher N availability in the soil, which resulted in a grain yield increase compared to the late straw incorporation [8].
After puddling, up to 30% of local farmers choose to flood their fields and keep them under these conditions until the beginning of the year, which reduces the amount of weeds to be tilled to prepare the seeding of the following season and provides some substitute wetlands for waterfowl. Decomposition under flooded soil – i.e. anaerobic - conditions is thought to be slower than under aerobic conditions [9-11]. However, other authors [12] found no difference in straw decomposition in submerged vs. aerobic soils. In contrast, the potential for N immobilization under anaerobic conditions is thought to be less than in aerobic soils [13-15].
Nitrogen is the nutrient that produces greater influence on the growth of the rice plant and its grain yield. In terrestrial ecosystems, almost 95% of the total N is associated with the organic matter [16]. Nitrogen is absorbed by the roots as ammonium ion (NH4+) and nitrate ion (NO3-) species. Plants are thought to use 30-35% of the applied N fertilizer, whereas 20% is temporarily immobilized and the 45-50% remaining is lost [1].
The agronomic effects of winter flooding and straw burning practices on harvest remains decomposition and seasonal soil extractable N (ExN) dynamics have not been widely studied and, in any case, have not been characterized or quantified under the conditions of Southern Spain rice systems to date. A study carried out in California rice systems [2] showed that incorporating straw after harvest, followed by flooding the fields, implied a greater decomposition of harvest remains and an increase of available or extractable nitrogen in the soil, which could lead to some reduction in the recommended N fertilizer rates. Taking into account their methodology and results, but regarding to the specific environmental conditions – Mediterranean climate, slightly saline soils… - and the associated cultural practices in our rice area, a two-year research studying the evolution of ExN in the soil of rice fields according to harvest remains burning and winter flooding was carried out.
Materials and Methods
Site description and management
Experiments were conducted from the 2011 harvest to the end of 2013 growing season on about 100 ha within a state called “Casudis”, which belongs to the company "Hisparroz, S.A." and is located on the left side of the Guadalquivir River, in “La Puebla del Río” township (Sevilla). The soil had a silty clay texture, salt free in its first 40 cm deep and its characteristics are given in Table 1.
| Parameter | Unit | Analysis Result |
|---|---|---|
| Cationic Exchage Capacity | meq 100 g-1 | 23.2 |
| Exchangeable Na | % | 15.1 |
| Electric conductivity. Ext. 1:5 | mS cm-1 | 2.2 |
| pH | 01:02.5 | 8.1 |
| Oxidable Organic Matter | % P/P | 2.12 |
| Available Phosphorus | ppm | 25.6 |
| Available Nitrogen | ppm | 16.4 |
| Available Sodium | ppm | 487 |
| Clay | % | 51.2 |
| Silt | % | 41.1 |
| Sand | % | 7.7 |
| Texture classification | Silty clay | |
Table 1: Characteristics of the soil (0–15 cm). Casudis, La Puebla del Río (Sevilla), 2011.
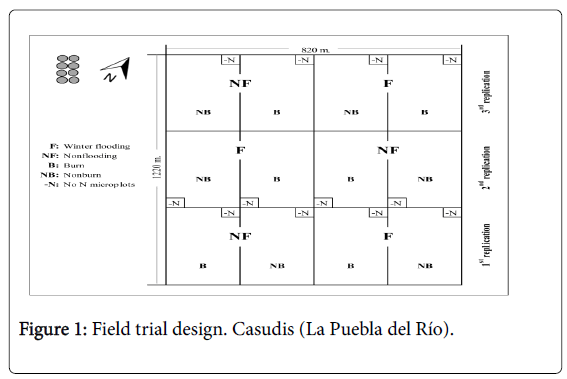
The experimental design was a split-plot with three replications. Winter flooding (F) and nonflooding (NF) were main plots, and straw treatments - burn (B) and nonburn (NB) - were subplots (Figure 1). The plot size ranged from 7.5 to 8.3 ha. Each of the 12 plots was separated by a levee, or sometimes for a rail, and had its own inlet and outlet.
Cultivation practices and soil preparation were those typical of the area where the experiments were established, ensuring that all them affected in the same way to each of the mean plots.
The two burning treatments (B and NB) were established just after the harvest of the preceding growing season. The chopped straw was piled on the strings of stubble left by the combine, alternately. That chopped straw and a big portion of the stubble cane, still fixed to the ground, were burned.
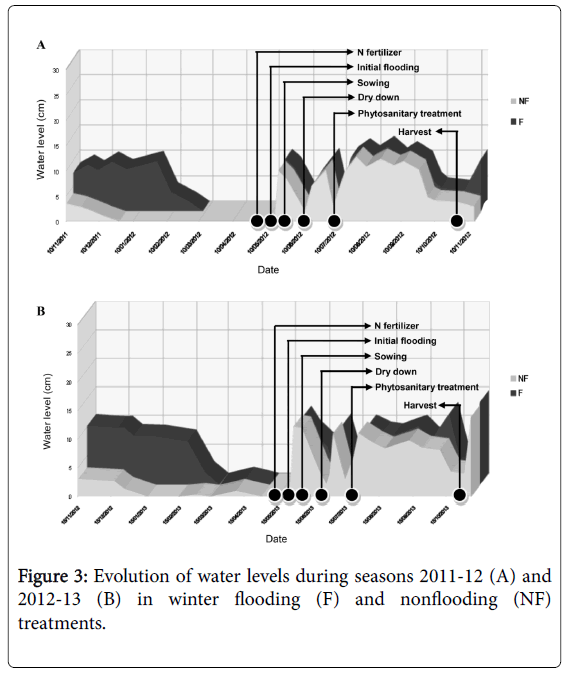
Winter flooding was conducted immediately after puddling, once all the harvest remains had been incorporated into the soil, whether they had been burned previously or not; since incorporation is a necessary and non-negotiable practice for rice growers in Southern Spain. Plots remained flooded or drying, according to treatment, from early November until February; the moment in which the plots were drained to begin with the spring field operations. Water levels in the F treatments were maintained between 7 and 10 cm (Figure 2) deep during the winter. The plots F were free of puddles early in the second half of March in both years.
Spring field operations began in the middle of March in both years with the first cultivator plow pass, and were the same for all treatments. Three additional plow passes were given until mid-May, while laser leveling was conducted in late April. Phosphoric fertilizer was applied in the second half of March as Superphosphate 18%, at a rate of 54 kg P2O5 ha-1. Nitrogen fertilizer (urea 46%, 145 kg N ha-1) was applied on May and incorporated into the soil at the same time than its application. Later, all the plots were flooded and then rice (var. ‘Puntal’) was planted aerially, with a density of 160 kg seeds ha-1.
Plots remained flooded during the entire growing season, although water was maintained at very low levels at the rooting stage, during the general treatment against weeds and before harvesting.
In addition, microplots which received no N fertilizer (-N) were established in each plot, to more accurately access the fate of straw N and to avoid the interferences that the application of N fertilizer generates on the ExN content of the soil. These plots had a size of 24 by 24 m and were located at the water inlet corner of each subplot. P fertilizer was applied to the -N plots at the same rate as the rest of the field.
Parameters, sampling and analysis
Harvest remains biomass, expressed in kg ha-1 and with a known N content of 0.7%, were determined for each treatment. Samples were collected after burning (ash was not collected) and before puddling and winter flooding, by making three randomly throws, using a 0.25 m2 ring, above the corridors of harvest left by the combine and cutting stubble cane contained therein at ground level. In NB treatments, chopped straw over the stubble was also collected. Samples were dried for five days to constant moisture at 65ºC for dry weight determination, obtaining the straw biomass and N inputs per ha.
To provide an estimate of harvest remains biomass decomposition during the winter, double nylon litter bags (2 mm mesh and 44 by 48 cm) were filled with those rice straw remains from the corresponding treatment, which had a known dry weight. The bags were buried in each plot, both under flooding and nonflooding, to expose them to incorporation conditions. Then, they were dug up after about four months and washed with abundant water. The remaining biomass was brought back to dry weight in oven at 65°C for 5 days- and lost weight with respect to moment of his burial in field was calculated.
In order to know the evolution of extractable nitrogen (ExN) content, several soil samples were collected in six (2013) or seven (2012) different moments during the year, by taking out soil cylinders about 10-15 cm long containing the first 20 to 25 cm deep into the soil. In those first 25 cm, most of the nutrients absorbed by the roots of rice plants are accumulated. Three samples of each treatment (replications) were collected and stored in sealed plastic bags. The determination of ExN, expressed in mass of N belonging to NO3- (N-NO3-) and NH4+ (N- NH4+), was performed a few days later by extracting 2.5 g of soil in 25 ml of 1N KCl and the subsequent colorimetric analysis using a multiparameter analyzer [17]. Soil samples were taken from both the main field (+N) and -N microplots.
The other considered and measured parameters in +N plots were grain yield (kg ha-1 of paddy rice at 14% of relative humidity), water levels evolution, plant height, lodging percentage, pests and diseases incidence, waterfowl presence/absence during the winter, ExN content in irrigation water and cutting height of the harvest. In –N microplots, only ExN evolution in soil, plant height, lodging percentage, pests and diseases incidence, ExN content in irrigation water and cutting height of the harvest, were calculated.
Finally, statistical analysis for each relevant data set – of soil, water or plant - in both +N and –N plots, was carried out with “Statistix 9.1” software, using a split-plot design with winter flood treatments (F and NF) as main plots and straw treatment (B and NB) as subplots. The corresponding analysis of variance (ANOVA) were executed by applying the test of the Least Significant Difference (L.S.D.) and checking the effect of winter flooding, straw burning and the possible interaction between the two at significance levels of 0.05, 0.01 and 0.001.
Results and Discussion
Precipitation and temperature
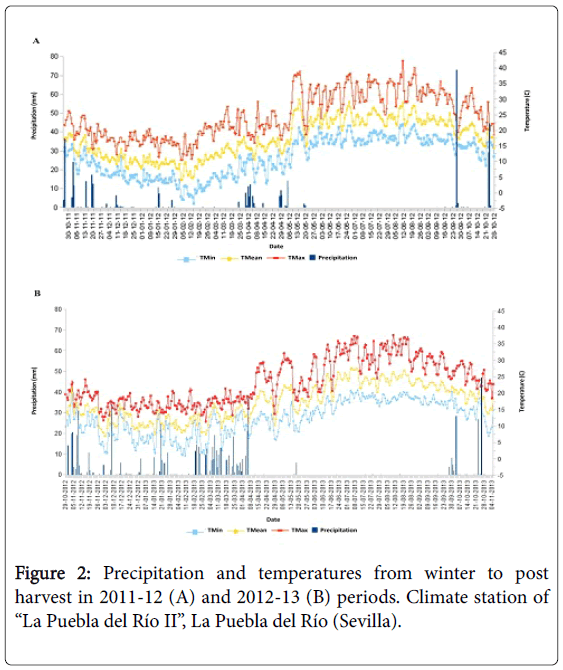
Weather data were taken from the closest climate station to the experimental site (Climate station “La Puebla del Río II”). During 2012 and 2013 seasons, it was possible to irrigate with water with low salt content. The accumulated rainfall between harvest of 2011 and 2012 was 404.6 mm, whereas during the approximately three months of winter flooding only 79.8 mm were accumulated. The first important rainfall of that period occurred on November 14th and average maximum and minimum temperature was fue 17.4°C and 5.9°C, respectively. Meanwhile, between harvest of 2012 and 2013, an amount of 683 mm were accumulated, with a winter period particularly wet, with 254.8 mm fallen fairly steadily. Average maximum and minimum temperature during the winter flood treatment period was 17.1°C and 7.9°C, respectively (Figures 3A and 3B).
Straw biomass and nitrogen inputs
In the NB treatments, where all the harvest remains were incorporated into the soil following harvest, average straw biomass was 12145 and 10325 kg ha-1 in 2011 and 2012, respectively. Burning (B), which eliminated almost the total of chopped straw and by 15% of the stubble, reduced the amount of harvest remains by 63% in 2011 and 66% in 2012. Straw N concentration was similar across straw treatments at each year, averaging 0.7% N. Based on results from field studies, some authors [8] reported that a straw N concentration of 0.54% N was the critical level of straw N determining whether or not N immobilization would affect yield response in single growing seasons. Total straw N remaining in the field following the implementation of the treatments, which could be called Potentially minerizable N (PMN), was 85.02 (NB) and 31.33 (B) kg N ha-1 in 2011, and 72.28 (NB) and 24.33 (B) kg N ha-1 in 2012. At both years, straw burning resulted in 48 to 54 kg ha-1 less N inputs from straw compared to the treatments where all the harvest remains were incorporated into the soil (Table 2).
| Straw treatment | Year | Straw N (%) | Straw biomass (kg ha-1) | N inputs (kg ha-1) |
|---|---|---|---|---|
| Nonburn (NB) | 2011 | 0.7 | 12145a* | 85.02 |
| Burn (B) | 4476b | 31.33 | ||
| Nonburn (NB) | 2012 | 10325a | 72.28 | |
| Burn (B) | 3476b | 24.33 |
*Different letters beside each treatment mean indicates a significant difference (P<0.05) from the other mean within each year.
Table 2: Harvest remains biomass and N inputs into the soil following treatment implementation after harvesting. November of 2011 and 2012.
Straw decomposition
The amount of straw and straw N remaining in the field just before planting the 2012 crop was estimated based on straw loss from litter bags. Averaged across years and straw management treatments, 57% of the straw remained in the F plots compared to 70% in the NF plots (Table 3). Decomposition was significantly higher in F treatments in both years. Comparison of the individual straw treatments indicated that nonburning resulted in a higher percentage of decomposition. Following the winter flood, 61.5% of the harvest residues remained in the NB treatment compared to an average of 66% for the B treatment, but those differences were only significant in year 2013. No significant straw by winter flood treatment interaction was found in any of the two years.
| 2012 | 2013 | ||||
|---|---|---|---|---|---|
| Main plot | Subplot | Straw remaining in litter bag (%) | Total straw1 (kg ha-1) | Straw remaining in litter bag | Total straw1 (kg ha-1) |
| Flood (F) | Burn (B) | 51.3a2 | 2295 | 68.6a2 | 2385 |
| Nonburn (NB) | 49.5a | 6016 | 59.0b | 6089 | |
| Mean | 50.4 | 63.8 | |||
| Nonflood (NF) | Burn (B) | 73.0a | 3266 | 71.4a | 2480 |
| Nonburn (NB) | 70.3a | 8537 | 67.2b | 6943 | |
| Mean | 71.6 | 69.3 | |||
| ANOVA | |||||
| Flood | *** | * | |||
| Burn | NS | * | |||
| Flood x Burn | NS | NS | |||
| C.V. (%) | 6.63 | 4.56 | |||
| L.S.D. (95%) Flood | 1.42 | 4.77 | |||
| L.S.D. (95%) Burn | 6.48 | 4.87 | |||
*Significance at P<0.05
***Significance at P<0.001
1Calculated by multiplying the percent in the litter bag by the initial straw biomass (Table 2).
2Different letters beside each subplot treatment mean indicates a significant difference (P<0.05) from the other mean within the same main plot treatment.
Table 3: Harvest residues in soil before planting in 2012 and 2013. Estimates are based on litter bag data.
From these results, we can also deduce that the average potential mineralizable nitrogen (PMN) per year supplied to the soil from the straw decomposition was 24.6 kg N ha-1 in the treament NF/NB, 36.0 kg N ha-1 in F/NB, 7.7 kg N ha-1 in NF/B and 11.1 kg N ha-1 in F/B.
Evolution of water levels
As depicted in Figure 2A and 2B, F treatments remained completely flooded during the winter period. All the plots were flooded immediately after the harvest, so real aerobic conditions lasted over a month in being established in NF treatments. Last puddles disappeared in January, although the frequent rainfalls produced wet conditions and some puddles during all the winter and the spring dry down periods in 2013. F treatments were dried down in middle March. The whole trial was flooded again in last May. The evolution of water levels was very similar for all the different treatments.
A first decrease in water level was made three weeks after sowing. This partial drain oxygenates soil, which helps to accelerating mineralization and activating rooting. After less than a week, water levels were increased again until one month and a half after sowing, when a second partial drain was done for applying the general treatment against weeds. A few days later water levels were increased and remained between 8 and 15 cm until two or three weeks before harvesting. During those weeks, water level was established below 5 cm.
Soil nitrogen evolution in season 2011-12
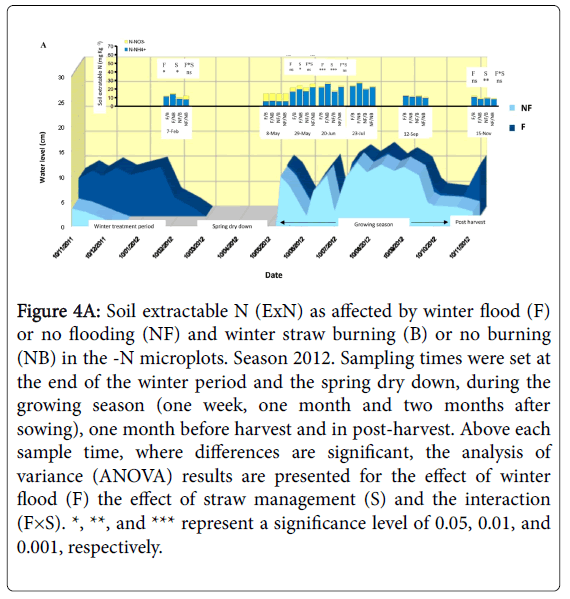
Before the spring drain, soil extractable N (ExN) levels were similar in –N and +N plots (Figure 4A and 4B, respectively). Regarding to –N microplots (Figure 4A), most of the N (>60%) in the NF plots was in the NH4+ form, due to the relatively saturated conditions. In the F treatments, the percentage raised up to >85%. ExN levels were significantly higher in F and NB treatments than in NF and B, respectively. Those differences could be explained by the fact that nitrogen availability in flooded soils increases with the organic matter content – more in NB - and with higher temperatures, since low temperatures retard organic residue decomposition [9,18]. We found more stable temperatures during winter in flooded soils than in dry soils due to the specific heat of water [19], which may causes that the microorganisms that decompose the organic matter have a greater rate of activity. On the other hand, the low N content of the soil during the winter period could also reduce the activity of aerobic organisms in the NF plots with respect to the anaerobic ones in F treatments, which could develop their decomposing activity without great N requirements [1]. In that sense, some authors [9-11] found that decomposition under flooded soil – i.e. anaerobic - conditions was slower than under aerobic conditions. However, results from a similar study [12] suggested there were no difference in straw decomposition in submerged vs. aerobic soils. In addition, the potential for N immobilization under anaerobic conditions is thought to be less than in aerobic soils [13-15].
Figure 4A: Soil extractable N (ExN) as affected by winter flood (F) or no flooding (NF) and winter straw burning (B) or no burning (NB) in the -N microplots. Season 2012. Sampling times were set at the end of the winter period and the spring dry down, during the growing season (one week, one month and two months after sowing), one month before harvest and in post-harvest. Above each sample time, where differences are significant, the analysis of variance (ANOVA) results are presented for the effect of winter flood (F) the effect of straw management (S) and the interaction (F×S). *, **, and *** represent a significance level of 0.05, 0.01, and 0.001, respectively.
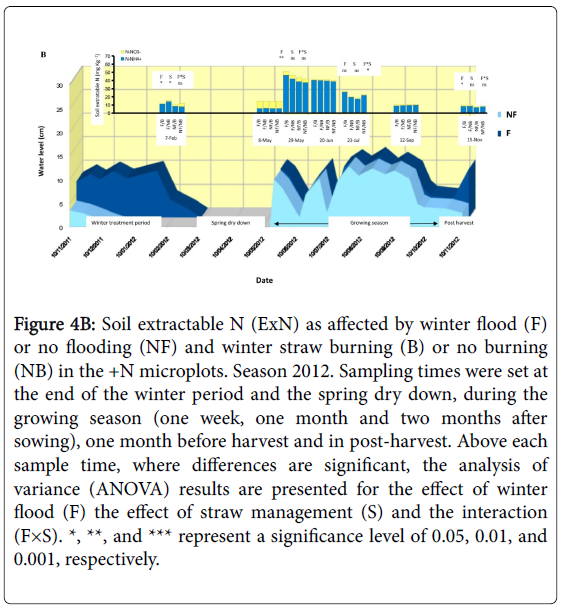
Figure 4B: Soil extractable N (ExN) as affected by winter flood (F) or no flooding (NF) and winter straw burning (B) or no burning (NB) in the +N microplots. Season 2012. Sampling times were set at the end of the winter period and the spring dry down, during the growing season (one week, one month and two months after sowing), one month before harvest and in post-harvest. Above each sample time, where differences are significant, the analysis of variance (ANOVA) results are presented for the effect of winter flood (F) the effect of straw management (S) and the interaction (F×S). *, **, and *** represent a significance level of 0.05, 0.01, and 0.001, respectively.
During the the spring dry down, much of the ExN nitrified and almost two-thirds was in the form of NO3- in all treatments. At the end of this period, just before re-flooding the plots for sowing, it was observed that the average levels of ExN increased slightly, not significantly. This increase could be explained by the permanence of the mineralization process, although the dry drown also produces N losses by volatilization [20]. On this period there were no significant differences in ExN levels according to treatment.
One week after sowing, with plots previously flooded, a significant increase in ExN levels was observed in all treatments. Irrigation water, according to its origin, had remarkable amounts of dissolved nitrogen. It was determined that the concentration of dissolved N in the irrigation water channel after sowing was 6.04 mg L-1, mostly nitrates and nitrites; which could add up to 60 kg ha-1 of N during the whole season. The rainwater, in addition, can provide from 5 to 14 kg N per hectare per year [21,22]. The ratio of NH4+ was then much higher than that of NO3-, since denitrification occurs in a few days - two or three - after the flood. Probably the NO3- which had accumulated during the spring dry down stage was lost by denitrification when water was reintroduced into the experimental plots for sowing the rice [23,24]. The difference between F and NF treatments was not significant, although higher concentrations of ExN were observed in NB treatments with respect to B treatments.
In the sampling carried out approximately one month after sowing, with the crop in the stage of tillering, soil ExN levels remained stable; which was favorable for the crop given the high N requirement at this stage. The F and NB treatments in this critical period presented greater availability of ExN in comparison with NF and B treatments, respectively. The supersaturation conditions in soil, although the water level remained low for algae prevention, resulted in more than 95% of the ExN being in the ammonium form. Two months after sowing, soil ExN levels were still similar to those obtained one month earlier and no significant differences were observed among treatments, although the ExN remained slightly higher in treatments F and NB.
From the end of July the ExN was decreasing since N extraction by the crop increased once the plants reached the flowering stage. Annual minimums were reached from September (last sampling before harvest) to November (post-harvest sampling, when the treatments for the following season had been re-established in the experimental fields).
With respect to +N plots (Figure 4B), where fertilizer - urea 46% - was applied on 17th May 2012, a very similar soil ExN evolution was observed dring the season. However, differences with –N microplots were analyzed. On the one hand, in the sampling carried out one week after sowing the application of nitrogen fertilizer resulted in average levels of ExN in the soil that almost duplicated those measured in the – N microplots (45 ppm in +N vs. 25 ppm) and almost triplicated the concentration of ExN existing before such application. This gives an idea of the importance of the nitrogenous inorganic fertilizer for rice cultivation under our conditions. F treatments contained significantly more ExN than NF. One month later, as observed in –N plots, ExN levels remained high, although there were no significant differences among treatments. In relation to this, some authors [2] already indicated that the application of nitrogen fertilizer masked these differences among treatments. A remarkable fact is that a significant decrease in the average content of ExN in soil were detected two months after sowing in these plots, since the crop was already in the flowering stage and had extracted about 75% of the total N required during the season. Thereafter, the results were similar to those observed in the –N plots. The significant ExN decrease that took place from the end of July, as well as the low basal levels of this nutrient at the end of the vegetative cycle (September-October) and in postharvest, could indicate that the nitrogen fertilizer rate applied in our rice area might be a little low for an optimum development and yield of the Puntal variety.
The general conclusion that can be established regarding the differences between treatments during the season in –N and +N plots is that there is a trend, although not always significant and not for all the samplings carried out, according to which the levels of ExN in the soil were higher in treatments F and NB with respect to NF and B, respectively. And, above all, that this trend became even more evident or significant in the periods when rice required the largest amounts of N in its life cycle, i.e., 25-50 days after sowing and in the booting stage.
Soil nitrogen evolution in season 2012-13
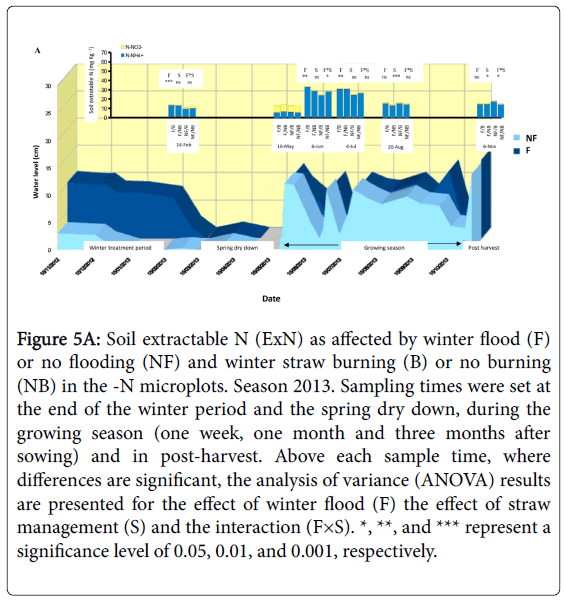
Regarding to -N microplots, Figure 5A depicts that more than 85% of the soil ExN in NF treatments was in the form of NH4+ before the spring dry down, since abundant precipitations during the winter period had caused relative saturation conditions in the area. In F treatments the percentage increased to more than 95%. Total levels of ExN (NO3- + NH4+) were significantly higher in F treatments than in NF, as observed in the previous season, although the crop residues burning (NB and B treatments) was not significant this time.
Figure 5A: Soil extractable N (ExN) as affected by winter flood (F) or no flooding (NF) and winter straw burning (B) or no burning (NB) in the -N microplots. Season 2013. Sampling times were set at the end of the winter period and the spring dry down, during the growing season (one week, one month and three months after sowing) and in post-harvest. Above each sample time, where differences are significant, the analysis of variance (ANOVA) results are presented for the effect of winter flood (F) the effect of straw management (S) and the interaction (F×S). *, **, and *** represent a significance level of 0.05, 0.01, and 0.001, respectively.
During the total drought of the plots, much of the ExN nitrified, but the continuous rains kept all plots with puddles, so ExN in the form of NO3- represented no more than 60% in any treatment. It was also observed that average levels of ExN increased slightly in almost all the treatments, as it occurred in the previous season in a similar moment. There were no significant differences in ExN levels according to treatment, although in NF they were lower than in F.
One week after sowing a significant increase in ExN levels was observed in all treatments, with the NH4+ ratio being much higher than that of NO3-, even more than in the previous season, since soil presented higher moisture levels at the end of the spring dry down period. The difference between treatments B and NB was not significant, although higher concentrations of ExN were measured in F treatments with respect to NF. If we observe the evolution of the water sheet and the rainfall occurring during the spring drought period, there were two moments in which the NF plots became dried down and then re-flooded or flooded. This, as mentioned above, caused soil N losses by denitrification and later volatilization [23,24], which could explain that up to two months after sowing the ExN concentration was significantly lower in NF treatments than in F - only subjected to one dry period and the later flood -, which would have had less soil N losses by this process.
In the sampling carried out approximately one month after sowing, with the crop in the stage of tillering, ExN did not experience a significant decrease; which was positive due to the high N requirement of the crop at this stage. The F treatments presented greater availability of N in comparison with NF in this critical phase. The conditions of soil supersaturation resulted in more than 95% of the ExN being in the ammonium form.
In the samplings of the previous season it was observed that levels of ExN in the soil two months after sowing were similar to those obtained a month before. In order to detect the moment at which a general and significant ExN decrease occurred, a sampling was carried out almost three months after sowing in 2013. As it can be observed, in that moment, after the second period of maximum nitrogen requirement by the crop, there was a significant decrease in all the treatments studied.
From that moment until post-harvest, differences among treatments were only significant when comparing the ExN content of the B treatment versus the NB, being higher in the first ones. Since the decomposition was faster and a little more ExN was available in the NB during the first half of the season, although not significantly, it is possible that by the second half most of the ExN had already been extracted in the treatments NB but the crop residues incorporated in B treatments were still been mineralized. B treatments had more percentage of stubble, which was more difficult to be decomposed.
As observed in season 2012, levels of ExN in the soil were higher in treatments F with respect to NF, mainly in periods when the crop required the greatest amounts of N in its life cycle; so the second year of experiments seemed to reinforce the reliability of the data and conclusions presented.
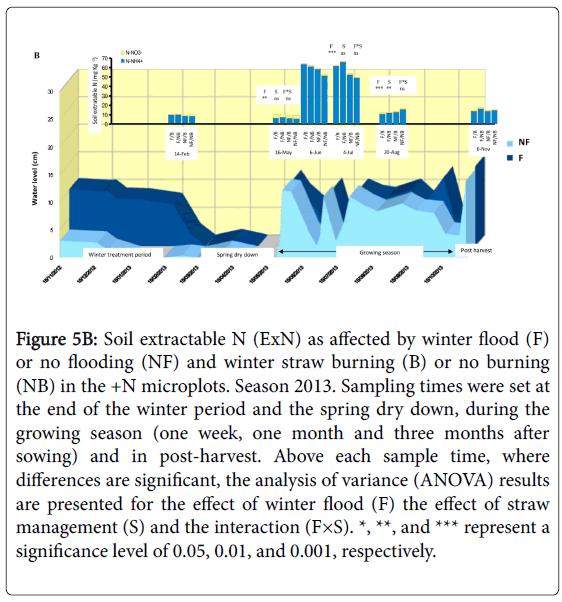
During the 2013 season, the evolution of the ExN in the +N plots (Figure 5B) was also similar to what was observed in the –N microplots. However, the differences were again analyzed.
Figure 5B: Soil extractable N (ExN) as affected by winter flood (F) or no flooding (NF) and winter straw burning (B) or no burning (NB) in the +N microplots. Season 2013. Sampling times were set at the end of the winter period and the spring dry down, during the growing season (one week, one month and three months after sowing) and in post-harvest. Above each sample time, where differences are significant, the analysis of variance (ANOVA) results are presented for the effect of winter flood (F) the effect of straw management (S) and the interaction (F×S). *, **, and *** represent a significance level of 0.05, 0.01, and 0.001, respectively.
From the beginning of the season to one and a half months after sowing, there were always higher concentrations of ExN in flooded soils (F) than in NF; although differences were not significant in all sampling moments.
In the sampling carried out one week after sowing, as in the season 2012, the application of the nitrogen fertilizer resulted in levels of soil ExN that almost duplicated those measured in the microplots –N (average of 55 ppm in +N plots versus 30 ppm in –N), being F treatments richer in ExN content compared to NF, but not significantly. One month later, as in the –N plots, ExN levels remained high, with significantly greater levels, again, in F treatments.
In the penultimate sampling, the results were similar to those observed in the –N microplots, with the ExN content in soil being higher for B and NF treatments compared to NB and F, respectively. However, this situation was not maintained in the post-harvest period, where F / NB combination presented more soil ExN content than the rest, although not significantly.
A relatively important observation from the graphs depicting the evolution of ExN throughout the year, for both 2012 and 2013 seasons, was that soils from the fertilized plots (+N) always presented some less ExN on average than those from the microplots –N from the ripening stage to the beginning of the following season. Research works on California rice paddies [2] concluded that nitrogen extraction by the rice plant is directly proportional to the nitrogen fertilizer rate applied to the crop, so the addition of more N by the fertilization labor in +N plots resulted in soils with less ExN (in basal level) than those from the –N microplots during the mentioned period. In fact, it should be noted that the results of this study, in general terms, were quite similar to those obtained in California [2]; which reaffirms the validity of our data, since the agronomic and environmental conditions in the California rice area are very similar to those of the Guadalquivir Marshes and that is what was expected when this research began.
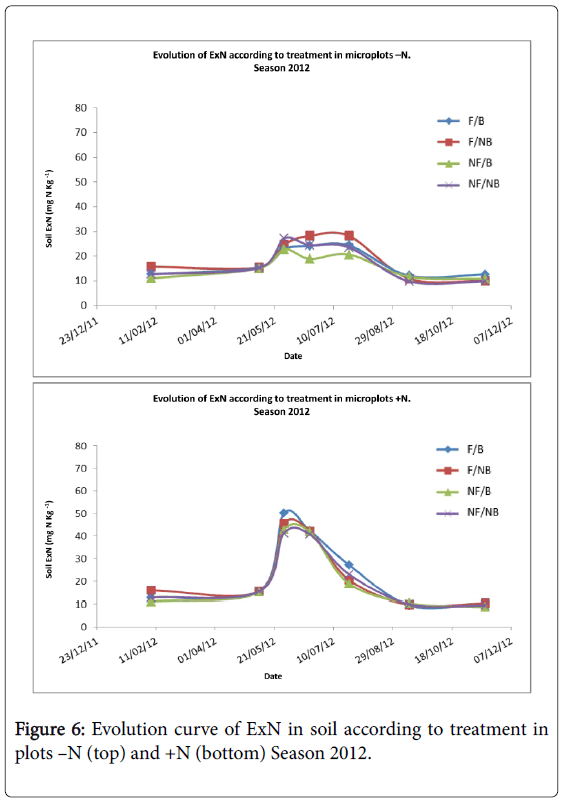
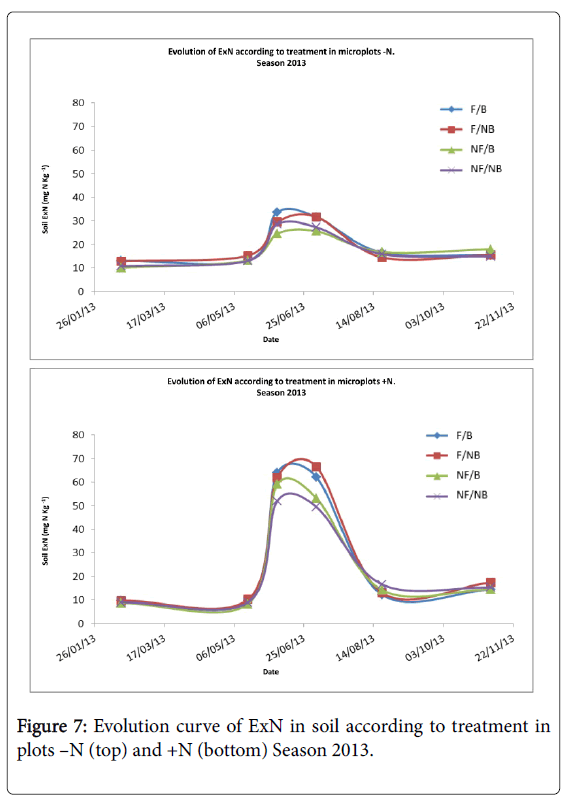
Since the results did not show strong significant differences in favour of a specific treatment considering every sampling moment - although the observed trends have been pointed out - after those two years of experiments, we decided to quantify the available ExN that each treatment provided to the crop throughout the year by calculating the integral of the soil ExN evolution curve that described each treatment in every type of plot (-N and +N) and every year (Figures 6 and 7). Thus, it was calculated that treatments with the combination F/NB treatments – followed by F/B treatments - provided the highest cumulative amounts of ExN throughout the year. However, there were no significant differences between the four treatments.
It was also observed that from the end of the winter period up to two months after sowing - period of maximum N requirement by the rice - the F treatments provided more N to the crop. By the end of the crop season and until the beginning of the winter, on the other hand, NF treatments presented the highest ExN content in the soil. Although those differences were not significant either, the capability of flooding to put more N available to the plant in the moments of greatest requirement was observed once again in both seasons.
Crop yields and plant height
The grain yield in –N microplots was obtained indirectly through the determination of the yield components, due to the impossibility of harvesting the microplot and the abundant bald areas on them in the period of harvest, as a result of factors such as the proximity to the water inlet, the trampling during the collection of samples or even the action of the machinery during the different labor and operations in the plot.
Under these conditions, the results obtained would not have been representative or reliable. These yields, therefore, were only orientative. In any case, by comparison among treatments, a lower yield was observed in the NF treatments and higher in F treatments. In addition, the average value of the grain yield calculated in the fertilized plots (+N) was significantly higher than in the –N, obtaining between 2,000 and 3,000 kg ha-1 more (Table 4).
| Main plot | Subplot | Plan height (cm) | Grain yield (kg ha-1) (14% humidity) | ||
|---|---|---|---|---|---|
| +N | -N | +N | -N | ||
| Flood (F) | Burn (B) | 93.9a** | 90.2a | 9990a | 7911a |
| Non burn (NB) | 91.9a | 85.3a | 9933a | 7531a | |
| mean | 92.9 | 87.8 | 9962 | 7721 | |
| Non flood (NF) | Burn (B) | 93.8a | 87.4a | 9928a | 7383a |
| Non burn (NB) | 92.6a | 87.0a | 9877a | 6986a | |
| mean | 93.2 | 87.2 | 9903 | 7185 | |
| ANOVA | |||||
| Flood | NS | NS | NS | NS | |
| Burn | NS | NS | NS | NS | |
| Flood x Burn | NS | NS | NS | NS | |
| C.V. (%) | 2.83 | 4.92 | 2.49 | 11.9 | |
| L.S.D. (95%) Flood | 6.54 | 8.99 | 1052.6 | 797.07 | |
| L.S.D. (95%) Burn | 4.22 | 6.9 | 496.28 | 783.5 | |
*Signification level at P<0.05
**Different letters beside each subplot treatment mean indicates a significant difference (P<0.05) from the other mean within the same main plot treatment.
Table 4: Plant height and grain yields at 14% humidity. Season 2012.
With respect to the +N plots, grain yields obtained by measuring the weight of the crop from each one, presented values close to 10,000 kg ha-1 and did not show significant differences among treatments (Table 4), as described in some similar studies [2,25]. Once again, however, higher yields were observed - although not significantly - in F treatments with respect to NF.
Plant heights did not show significant differences between treatments either, although plants were obviously significantly higher in the +N plots in comparison with –N microplots. In the year 2013 very similar results to those of 2012 were observed (Table 5). With respect to grain yield, differences among treatments were not significant, both in the +N plots and in the –N microplots. However, a slight trend in favour of F treatments with respect to NF was again observed, being the F/NB combination the one that showed higher yields, both in +N and –N plots.
| Main plot | Subplot | Plan height (cm) | Grain yield | ||
|---|---|---|---|---|---|
| (14% humidity) kg ha-1 | |||||
| +N | -N | +N | -N | ||
| Flood (F) | Burn (B) | 109.1a** | 102a | 9890a | 7602a |
| Non burn (NB) | 106.9b | 103.7b | 9979a | 7755a | |
| mean | 108 | 102.8 | 9935 | 7679 | |
| Non flood (NF) | Burn (B) | 107.7a | 100.0a | 9776a | 6941a |
| Non burn (NB) | 107.1a | 101.7b | 9821a | 7133a | |
| mean | 107.4 | 100.8 | 9794 | 7037 | |
| ANOVA | |||||
| Flood | NS | NS | NS | NS | |
| Burn | NS | * | NS | NS | |
| Flood x Burn | NS | NS | NS | NS | |
| C.V. (%) | 0.86 | 0.66 | 10.61 | 9.87 | |
| L.S.D. (95%) Flood | 4.35 | 5.53 | 877.5 | 1095.7 | |
| L.S.D. (95%) Burn | 1.48 | 1.08 | 756.3 | 607.95 | |
*Signification level at P<0.05
**Different letters beside each subplot treatment mean indicates a significant difference (P<0.05) from the other mean within the same main plot treatment.
Table 5: Plant height and grain yields at 14% humidity. Season 2013.
Regarding plant heights, significant differences were exclusively observed in NB treatments with respect to B treatments in –N plots; being higher also in F treatments versus NF, although not significantly. Once again, therefore, we found a slight agronomic advantage - little significant - of F/NB combination with respect to the rest.
These assessments, however, are valid only for two years of experiments. If these treatments were established continuously during a larger number of years, it could be possible that the cumulative effect of the winter flood and the burning of stubble resulted in significant differences in favor of any particular treatment. However, due to the trends observed and some significant differences, from this study we suggest and pointed out that the treatment that would provide greater soil ExN content throughout the season, and that could lead to higher grain yields, would be the combination F/NB.
Conclusion
Attending to our results, we conclude in general terms that incorporating straw in the fall followed by a winter flood results in the best straw decomposition and increases early season soil N availability. This could lead to increased N uptake and a reduction in the recommended fertilizer N rate if these practices were maintained for more years, since this combination seemed to put more nitrogen available to the crop in the moments of greatest requirement of this nutrient. Further studies should be carried out in the area in order to demonstrate this assumption.
Comparing the two fertilization treatments (+N and –N), the crop extracted a bigger amount of N from the soil when the plots were fertilized compared with when they were kept without fertilization. With respect to agrophysiological parameters, plant height only varied significantly among the different treatments in the second season of experiments - being greater in the NB treatments than in the B - for the microplots without N-fertilizer application. Grain yield at 14% of humidity, meanwhile, was not significantly different among the four treatments in each one of the seasons, although in both years they were slightly bigger in the plots that had been flooded during the previous winter (F treatments). In the medium and long term, however, and as a consequence of the cumulative effect over time, it could be possible that the incorporation of all harvest remains (as opposed to the burning of part of them), together with the winter flood conditions which favour the decomposition of the organic matter and the availability of ExN in the soil, would lead to a significant addition of N into the soil and to higher grain yields. Therefore, we consider appropriate to continue this line of research.
Finally, it was observed that flood treatments favoured the presence of waterfowl in the rice area of the Guadalquivir Marshes during the winter period, which constitutes a support for the maintenance of the biodiversity in the environment near the National Park of Doñana. However, both the burn/non-burn and the winter flood/non-flood treatments presented agro-environmental advantages and disadvantages, according to the approach from which they were studied. Therefore, from this work it is advised that, to a greater or lesser extent, a certain alternation of the cultural practices tested should be carried out over time. The farmer must be the one making the final decision, based on information such as the one presented here and depending on the needs of his agricultural plots in each moment.
Acknowledgement
Results presented here came from the work carried out within the Research Project "Agroenvironmental Response to Nitrogen Fertilizer, Burning of Stubble and Winter Flood in the Rice Fields of the Guadalquivir Marshes", initiated and defined by the company “Hisparroz, S.A.”, with the collaboration of the “Instituto de Investigación y Formación Agraria y Pesquera de Andalucía” (IFAPA), framed in the line of work on Sustainability of Rice, common to both Entities. The Project has been conducted by the Rice Department team, funded by Herba Ricemills, S.L.U., through a Collaboration Agreement between both Entities.
References
- Aguilar M (2010) Producción integrada de arroz en el sur de España. Servicio de Publicaciones y Divulgación de la ConsejerÃa de Agricultura y Pesca. ISBN 978-84-8474-290-6. Junta de AndalucÃa; pp: 320.
- Linquist BA, Brouder SM, Hill JE (2006) Winter straw and water management effects on soil nitrogen dynamics in California rice systems. Agron. J 98: 1050-1059.
- Sanchez P (1976) Properties and management of soils in the tropics. John Wiley and Sons, New York. ISBN 9780471752004.
- De Datta SK (1981) Principles and practices of rice production. John Wiley and Sons, New York.
- Moorman FR, Van BN (1978) Rice: soil, water, land. International Rice Research Institute, Los Baños, Philippines
- Rao DN, Mikkelsen DS (1976) Effect of rice straw incorporation on rice plant growth and nutrition. Agron. J 68: 752-755.
- Bacon PE, Lewin LG, McGarity JW, Hoult EH, Alter D (1989) The effect of stubble management and N fertilization practices on the nitrogen economy under intensive rice cropping. Aust J Soil Res 27: 685-698.
- Williams WA, Mikkelsen DS, Mueller KE, Ruckman JE (1968) Nitrogen immobilization by rice straw incorporated in low-land rice production. Plant Soil 28: 49-60.
- Pal D, Broadbent FE (1975) Influence of moisture on rice straw decomposition in soils. Soil Sci Soc Am J 39: 59-63.
- Tate III RL (1979) Effect of flooding on microbial activity in organic soils: Carbon metabolism. Soil Sci 128: 267-273.
- Clark MD, Gilmore JT (1983) The effect of temperature on decomposition at optimum and saturated soil water contents. Soil Sci Soc Am J 47: 927-929.
- Neue HU, Scharpenseel HW (1987) Decomposition pattern of 14C-labeled rice straw in aerobic and submerged rice soils of the Philippines Sci Total Environ 62: 431-434.
- Arharya CN (1935) Studies on the anaerobic decomposition of plant materials: I. The anaerobic decomposition of rice straw. Biochem J 29: 528-541.
- Arharya CN (1935) Studies on the anaerobic decomposition of plant materials: III. Comparison of the course of decomposition of rice straw under anaerobic, aerobic, and partially aerobic conditions. Biochem J 29: 1116-1120.
- Broadbent FE, Nakashima T (1970) Nitrogen immobilization in flooded soils. Soil Sci Soc  Am J 34: 218-221.
- Schulten HR, Schnitzer M (1998) The chemistry of soil organic nitrogen: a review. Biol Fertil Soils 26: 1-15
- Maynard DG, Kalra YP, Crumbaugh JA (2007) Nitrate and exchangeable ammonium nitrogen (chapter 6). Pages 71-80 in M.R. Carter and E.G. Gregorich, editors. Soil sampling and methods of analysis (2nd edition). CRC Press, Taylor and Francis Group, Boca Raton, FL.
- Sain P, Broadbent FE (1977) Decomposition of rice straw in soils as affected by some management factors. J Environ Qual 6: 96-100.
- Krishnan P, Ramakrishnan B, Raja Reddy K, Reddy VR (2011) High temperature effects on rice growth, yield, and grain quality. In Donald L. Sparks, Editor: Advances in Agronomy, Vol. 111, Burlington: Academic Press.
- Chowdary VM, Raob NH, Sarma PBS (2004) A coupled soil water and nitrogen balance model for flooded rice fields in India. Agriculture, Ecosystems and Environment 103: 425-441.
- Aguilar M, Navarro L, GarcÃa JM (2008) Estudio agroeconómico del cultivo del arroz bajo producción integrada en las Marismas del Guadalquivir. Servicio de Publicaciones y Divulgación de la ConsejerÃa de Agricultura y Pesca de la Junta de AndalucÃa.
- Aguilar M (2006) Water use and integrated rice management in Southern Spain. International Rice Commission, Chiclayo, Perú.
- Broadbent FE, Tusneem ME (1971) Losses of nitrogen from some flooded soils in tracer experiments. Soil Sci Soc Am J 35: 922-926.
- Ponnamperuma FN (1972) The chemistry of submerged soils. Advances in Agronomy 24: 29-96.
- Eagle AJ, Bird JA, Horwath WR, Linquist BA, Brouder SM, et al. (2000) Rice yield and nitrogen utilization efficiency under alternative straw management practices. Agron J 92: 1096-1103.
Citation: Aguilar M, Fernández-Ramirez J, Gonzalez-Pineda T, Ortiz-Romero C (2017) Evolution of Soil Extractable Nitrogen as Affected by Winter Flooding and Straw Burning in Southern Spain Rice Systems. J Rice Res 5: 185. DOI: 10.4172/2375-4338.1000185
Copyright: © 2017 Aguilar M, et al. This is an open-access article distributed under the terms of the Creative Commons Attribution License, which permits unrestricted use, distribution, and reproduction in any medium, provided the original author and source are credited.
Select your language of interest to view the total content in your interested language
Share This Article
Recommended Journals
Open Access Journals
Article Tools
Article Usage
- Total views: 4005
- [From(publication date): 0-2017 - Jun 30, 2025]
- Breakdown by view type
- HTML page views: 3134
- PDF downloads: 871
