Research Article Open Access
Geochemistry of Core Sediments from Tropical Mangrove Region of Tamil Nadu: Implications on Trace Metals
Kalaivanan R1*, Jayaprakash M1, Nethaji S1, Arya V1 and Giridharan L2
1Climate Change and Environmental Research Group (CERG), Department of Applied Geology, University of Madras, Chennai, Tamil Nadu, India
2Department of Geology and Mining, Govt. of Tamil Nadu, India
- *Corresponding Author:
- Kalaivanan R
Climate Change and Environmental Research Group (CERG)
Department of Applied Geology, University of Madras
Chennai, Tamil Nadu, India
Tel: 25399422
E-mail: kalaivanan1986@gmail.com
Received Date: January 13, 2017; Accepted Date: August 29, 2016January 30, 2017; Published Date: February 07, 2017
Citation: Kalaivanan R, Jayaprakash M, Nethaji S, Arya V, Giridharan L (2017) Geochemistry of Core Sediments from Tropical Mangrove Region of Tamil Nadu: Implications on Trace Metals. J Earth Sci Clim Change 8:385. doi: 10.4172/2157- 7617.1000385
Copyright: © 2017 Kalaivanan R, et al. This is an open-access article distributed under the terms of the Creative Commons Attribution License, which permits unrestricted use, distribution, and reproduction in any medium, provided the original author and source are credited.
Visit for more related articles at Journal of Earth Science & Climatic Change
Abstract
The present study aims to determine the concentrations of certain trace metals (Fe, Mn, Cr, Cu, Pb, Zn, Co, Ni, Ba, Sr, V and Rb) and to identify the possible sources of the trace metals with multivariate analyses and assess the metal contamination using the enrichment factor (EF) and geo-accumulation index (Igeo) from the two core samples taken from Pichavaram lagoon. Pichavaram mangrove is a dynamic intertidal environment lying in between Vellar and Coleroon estuaries in Cauvery delta along the east coast of India. High OM in the present study is noted in both core samples which are mainly controlled by productivity and sediment texture. The increase of trace metals concentrations was observed at lower intersects which indicates that the trace metals were reprecipitated around the redox boundaries. Further it signifies that the enrichment of metals in C1 core sample is closely related to the diagenetic. Factor 1 with significant positive loadings on Mud and good loadings on Fe and Mn suggests the associations of these metals with finer sediment fractions and aluminosilicates. These elements to be enriched in the clay fraction in both core samples. They are mainly related to anthropogenic inputs and reflect the complexing nature of the organic matter. Igeo studies confirm the contamination of the study area. Overall the study highlights significant anthropogenic contributions in terms of heavy metal pollution. Comparative data for normalized enrichment factors and the modified degree of contamination show that Pichavaram sediments have suffered significant systematic heavy metal contamination following catchment urbanization.
Keywords
Geochemistry; Trace metals; Statistical analysis; Enrichment factor; Igeo
Introduction
The anthropogenic input of metallic elements, particularly from rapid economic development in coastal areas, has caused severe environmental crisis in marine ecosystems [1-4]. Trace metals (e.g., Fe, Mn, Cr, Cu, Ni, Co, Zn and Pb) are of particularly high concern due to their persistence in the environment, bioaccumulation, and high toxicity [5-9]. Sediments exhibit a great capacity to accumulate trace metals at even low concentrations in aquatic environments [10]. Most trace metals in the aquatic ecosystem are associated with sediments, especially bottom sediments [11,12].
Trace metals that accumulate in sediments, which act as both final sinks for various chemical pollutants and potential secondary sources, may be released back into water columns under changing environmental conditions [13,14]. Once absorbed by aquatic organisms, trace metals may be converted to more toxic organic complexes that may not only pose a risk to aquatic organisms but may also cause long-term human health issues and may even damage the ecosystem [15]. One of the most affected ecosystems in coastal areas is the mangrove ecosystem. Mangroves in many inter-tidal zones of an estuary, especially in the tropics and sub-tropics, enhance accumulation of fine, organic-rich materials and associated contaminations [16-18]. The mangrove ecosystem being an ecotone between terrestrial fresh water and marine environment makes it a good trap zone against sea and land debris [19]. Mangrove sediments serve as a sink for heavy metals that may be released back to the water column by various remobilization processes as a consequence of equilibrium disruption [20-22]. Heavy metals can be mobilized from sediment if there is a change in physicochemical properties and consequently result in trophic transfer to detritivores and other higher level trophic organisms in the food web [23]. In addition, the accumulation of heavy metals in sediments may also produce harmful effects on the biota living in them [24,25]. In this environment, therefore, sediments can play a double role, both as a carrier and as a possible source of contaminants. Because of the ubiquitous presence of heavy metals, their persistence, and their ability to create hazardous conditions in the environment, a number of studies have been carried out all over the world to assess the levels of different elements in mangrove sediments [26-32]. The objectives of this study were to (1) determine the concentrations of certain trace metals (Fe, Mn, Cr, Cu, Pb, Zn, Co, Ni, Ba, Sr, V and Rb) in core sediments of Pichavaram lagoon. (2) Identify the possible sources of the trace metals with multivariate analyses, and (3) assess the metal contamination using the enrichment factor (EF) and geoaccumulation index (Igeo).
Study Area
Pichavaram is situated in the southeast coast of Tamil Nadu, India. It is located at about 225 km south of Chennai between latitude 11°20' to 11°30' north and longitudes 79°45' to 79°55' east. Pichavaram mangrove is a dynamic intertidal environment lying in between the Vellar and Coleroon estuaries in the Cauvery delta along the east coast of India (Figure 1). It is an estuarine mangrove situated at the confluence of Uppanar, a tributary of the Coleroon River. It encloses an area of about 1100 ha consisting of 51 islets, of which 50% is covered by forest, 40% by waterways and the remaining area is covered by sand-flats and mudflats [33]. The lithology includes gneiss, charnokite, granite, quartzite, limestone, and alluvium [34]. Alluvium is dominant in the western part, whereas fluvio-marine beach sands cover the eastern part. Input from the Cauvery River sustains the distributaries of Coleroon River. The Cauvery River flows through densely populated areas and transports fertilizers, pesticides, and pollutant metals [34]. The Coleroon Estuary is heavily impacted by anthropogenic pollution, with high concentrations of Cr, Cd, Fe, Mn, and Zn [35]. Moreover, the Uppnar River and Khan Saheb Canal contribute towards anthropogenic input during monsoons. The mangroves have also been affected by aquaculture farming mainly due to logging and deforestation [36].

Figure 1: Study area.
Material and Methods
For the present study Core-1 (C1), which was collected during October, 2012 and Core-2 (C2) Collected during April 2013. Core 1 (latitude N 11° 25ʼ 28.5ʺ and longitude E 79° 47ʼ 39.4ʺ) and Core 2 (latitude N 11° 26ʼ 27.2ʺ and longitude E 79° 47ʼ 21.4ʺ) was retrieved from Pichavaram area. The site was selected as it is one of the adjoining areas and draining sites for minor rivers, which flow during monsoon periods and also has the tidal influence from the coastal environment. A PVC coring tube (6.3 cm diameter and 2.5 m length), pre-cleaned with acid was used for the collection of core sample. The overall length of the core-1 (C1) was 150 cm and Core-2 (C2) was 180 cm and in both cores, sub-samples were made at 2 cm intervals. In this study, the geochemical data have not been corrected for compaction, as it is likely to be uniform down the length of the core [37,38]. Textural studies of sand, silt and clay were carried out following the procedure of Ingram [39]. Carbonate content was measured using the method described by Loring and Rantala, (1992) and organic carbon (OC) was evaluated following the procedure of Gaudette [40,41]. Total trace elements were determined using an X-ray fluorescence (XRF) spectrometer equipped with an Rh tube at the National Geophysical Research Institute (NGRI), Hyderabad, as per the method described by Chen [42]. Pearson correlation coefficient (r) was employed to find the relationship between physico-chemical characteristics and heavy metal concentration. For the Principal Component Analysis (PCA), the orthogonal transformation (normalized varimax) was applied to maximize the number of loading factors without changing the total variance or the variance of each element in the model. To interpret the respective factors, only loads above 0.70 are considered; this value generally allows the definition of the least number of factors with the highest weights [43,44].
Index of Geo-accumulation
The Index of Geoaccumulation (Igeo) was computed using the following equation [45-48].
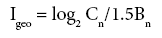
Where Cn is the measured concentration of the element in the core sediment fraction and Bn is the geochemical background value (average shale) in the earth's crust [49]. The constant 1.5 allows for natural fluctuations in the content of a given substance in the environment with very small anthropogenic influences.
Six classes of the geochemical index Müller have been distinguished [45].
Class Value Sediment Quality
0 Igeo< 0 Practically uncontaminated
1 0< Igeo<1 Uncontaminated to moderately contaminated
2 1< Igeo< 2 Moderately contaminated
3 2< Igeo< 3 Moderately to heavily contaminated
4 3< Igeo< 4 Heavily contaminated
5 4< Igeo< 5 Heavily to extremely contaminated
6 5< Igeo Extremely contaminated
Enrichment factor
The enrichment factor (EF) was based on the standardization of a tested element against a reference. A reference element is the one characterized by low occurrence variability. Fe has been chosen as the normalization element because of its origin being exclusively lithospheric. It permits to calculate the heavy metal contamination and it was calculated according to the following formula:
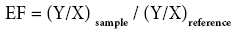
Ysample - trace element concentration in the sample;
XReference- trace element concentration in the continental crust [49].
Ysample - Fe content in the sample;
XReference - Fe content in the continental crust [48].
Five contamination categories are recognized based on the enrichment factor [50].
EF < 2 Deficiency to minimal enrichment
EF=2-5 Moderate enrichment
EF=5-20 Significant enrichment
EF=20-40 Very high enrichment
EF > 40 Extremely high enrichment
Contamination factor and pollution load index
The pollution level in trace metal was calculated by the method based on pollution load index [51]. This is a simple method based on pollution load Index to assess the extent of pollution by metals in estuarine sediments.
CF = C metal/C background

CF = Contamination factor.
n = Number of metals.
C metal = metal contamination in polluted sediment.
C background value = background value of that metal.
Four categories of contamination factor have been distinguished,


Results and Discussion
Textural characteristics of sediment
Textural data of both C1 and C2 are presented as mud (silt + clay) (Table 1). The grain size distribution in the core sediments is important in understanding the depositional environment history. Results of the two core samples, C1 and C2 reveal average value of mud concentration as 70.3 and 72.8% respectively. In the present study, grain size indicates a highly variable depositional environment in top and bottom portion of C1 and middle portion of C2. In both the cores, there is decrease in grain size in upper portion which may suggest that the sediments in the upper portion were deposited at low energy condition. The decrease in sand content through time may reflect period of wet and cold climate [52]. However, the reason for increase in sand at the depth of 20 cm, 60 cm and 104 cm of C2 might be because of extra input from the connecting river and possibly due to energy conditions, which prevailed at this region. Higher amount of mud from 30 cm depth in C1 suggest considerable amount of clay flocs entering the creek and is selectively trapped in the mangroves [53] where the grid like network structures of mangrove roots also help to retain the finer particles [54,55].
| Parameters | Sand | Mud | CaCO3 | OM | Fe | Mn | Cr | Cu | Pb | Zn | Co | Ni | Ba | Sr | V | Rb | |
|---|---|---|---|---|---|---|---|---|---|---|---|---|---|---|---|---|---|
| All values in % | µg g-1 | ||||||||||||||||
| Core-1 | Min | 6.4 | 31.8 | 1.7 | 1.3 | 18185.2 | 395 | 141.1 | 21.7 | 44.5 | 56.8 | 8.3 | 21.8 | 369.1 | 218.9 | 68.1 | 0.7 |
| Max | 68.2 | 93.6 | 3.7 | 4.9 | 30984.7 | 717.9 | 183.8 | 44.5 | 75.8 | 76.3 | 16.5 | 41 | 544.4 | 418.7 | 95.8 | 10.7 | |
| Avg | 29.7 | 70.3 | 2.7 | 3.3 | 25735.2 | 551 | 159.1 | 31.3 | 56.8 | 63.2 | 13.2 | 31.5 | 439.6 | 294.6 | 81.7 | 6.1 | |
| St. dev | 18.8 | 18.8 | 0.4 | 1 | 3255.2 | 84.4 | 8.6 | 5.2 | 6.2 | 3.3 | 2.1 | 4.2 | 38.2 | 45 | 6.2 | 2.3 | |
| Core-2 | Min | 10.9 | 49.7 | 1.2 | 0.2 | 22102 | 295.8 | 110.3 | 12.3 | 17.7 | 67.6 | 12.4 | 46.2 | 380.8 | 209.1 | 71 | 46 |
| Max | 50.3 | 89.1 | 4 | 7.5 | 51268.2 | 945.6 | 183 | 105.5 | 64.7 | 152.8 | 27 | 87.9 | 563.1 | 410.8 | 92.9 | 77 | |
| Avg | 27.2 | 72.8 | 2.2 | 4.2 | 36867 | 606.2 | 144.8 | 44.5 | 33.2 | 99.5 | 19.6 | 63.3 | 449.1 | 308 | 81.7 | 58.8 | |
| St. dev | 8.6 | 8.6 | 0.6 | 1.4 | 6135.9 | 126.4 | 14.2 | 22.3 | 9.2 | 16.7 | 2.7 | 8.9 | 26.5 | 46 | 4.6 | 6.1 | |
Table 1: Sediment texture (in %), calcium carbonate (CaCO3 %), organic matter (OM %) and trace elements concentration (in μg g 1of the study area.
OM and CaCO3
In both cores C1 and C2, the average concentrations of OM were 3.3% and 4.2% respectively, which is slightly higher than the values recorded from other regions [56,57]. The distribution pattern in both the C1 and C2 core sediments suggests that adsorption and incorporation of organic materials from the overlaying water column are taking place in association with the fine-grained particles. In C2, higher percentage of OM was found at the bottom portion of the core (150 cm and 160 cm) while the lower percentage were recorded at the depth of 20 cm, 60 cm and 120 cm (Figure 2). The OM get bound to the finer particles reflecting high inputs of terrigenous material from the adjacent land mass [58]. The relatively lower percentage of OM in the top sediments is due to constant flushing activities by tides along with impact of waves which remove fractions of the sediments from the fringing area. High OM in the present study is mainly controlled by productivity and sediment texture.

Figure 2: Sediment texture, CaCO3, OM in C1 and C2 in Pichavaram lagoon.
The average values of CaCO3 content in both C1 and C2 core samples are found to be 2.7% and 2.2% respectively. Downcore variations of CaCO3 are plotted in (Figure 2). High value of calcium carbonate is observed at the top and bottom segment of C1 core may be due to proximity to the coastal area and also due to the reprecipitation of carbonates in the reduced layer. The vertical distribution of CaCO3 in both the core sample indicates difference in the top layer (0 cm to 30 cm), where C1 core, CaCO3 is high compared to C2. The low value in C2 core sample in top portion reveal high sedimentation rate and greater dilution [59,60]. The lower concentrations in the middle part of both cores suggest that the active detritus dilution has reduced the concentration of calcium carbonate.
Total Trace Metal Distribution (TTMs)
In sediment, total metals concentration can indirectly reflect both logical mineralogy and even the beginning or nature of sediments [61- 63]. In general, metal accumulation in aquatic biota has a significant correlation with total metal concentrations in the sediment, which appear to be the most important variable parameter in environment. The trace metals in the mangrove environment are influenced by and are closely related to the Fe–Mn oxy-hydroxides. In the present study, the sediments contain elevated concentrations of Fe, Mn, Cr, Cu, Pb, Zn, Co, Ni, Ba, Sr, V and Rb in comparison to the reference site. These results are similar to those reported in other studies around the world where sediments were contaminated by industrial activities. In this study, the anthropogenic input from the nearby agricultural, domestic, and industrial processes through vellar river has made this pristine ecosystem vulnerable for the heavy metal contamination [64,65]. The average concentration of trace metals for core sample C1 and C2 are as follows Fe (C1-25735.2; C2-36867 ppm); Mn (C1-551; C-606.2 ppm), Cr (C1-159; C2-144.76 ppm), Cu(C1-31.3; C2-44.5 ppm), Pb(C1-56.8; C2- 33.2 ppm); Zn (C1-63.2; C2-99.5 ppm), Co(C1-13.2; C2-19.6 ppm), Ni (C1-31.5; 63.3 ppm), Ba (C1-439.6; C2-449.1 ppm), Sr (C1- 294.6; C2-308.0 ppm), V (C1-81.7; C2-81.7 ppm) and Rb (C1-6.1; C2- 58.8 ppm).
The vertical profile of C1 and C2 show enrichment in the surface layers due to early diagenetic process. A decrease in Fe and Mn at the subsurface is suggestive of the oxic/suboxic interface. In C2, there is increase in Fe concentration at lower intersects which indicates a reduced layer. Vertical distribution of Cr in the core samples is shown in (Figure 3). Total trace metal average concentration of Cr in C1 and C2 sediments are 159 ppm and 144 ppm, respectively, and it is found higher than the average continental crustal values. Cr is found to be higher in lower transect at the depth of 62 cm to 64 cm (Table 1). Diagenetic modifications, however, play a major role in the vertical distribution of Cr indicating a peak at subsurface and greater depth in core samples [54]. Similarly, Ni concentration were found to be high in the lower transect like those of Fe and Mn indicating that they are cycled along with Fe-Mn oxides in the redox boundaries and would have precipitated from the water column [66]. The highest concentration of Pb is seen at the depth of 70 cm to 72 cm. Pb concentration is found to be high in the middle intersect of the core. The increase in Pb may be due to precipitation around the redox boundaries [67]. The increase of Trace metal concentration (Fe, Mn, Cr, Cu, Pb, Zn, Co, Ni, Ba, Sr, V and Rb) at the depth of 62 cm to 64 cm indicates that the trace metals are reprecipitated around the redox boundaries. Further it signifies that the enrichment of metals in C1 core sample is closely related to the diagenetic. Distribution pattern on Ni and Co in C2 are like Fe and Mn indicating that they are cycled along with Fe-Mn oxides in the redox boundaries. Further increase of Ni and Co in the lower transect suggest that it is linked to the anoxic conditions and the addition of these elements is due to the scavenging of Fe-Mn oxides [68].

Figure 3: Downcore variation of TTms C1 and C2 in Pichavaram lagoon.
Statistical analysis
Fe and Mn have positive relationship with clay fraction (Mud) with relatively high correlation coefficients over 0.50, responding to the enrichment and adsorption of elements in the fine clay in both the core samples [69-72]. Correlation coefficients between pairs of metals show that all metals and OCs significantly correlate with other parameters except sand and CaCO3. Significant correlations of organic matter with most of the metals indicates that the sediment organic matter is acting as metal carrier and plays an important role in their distribution pattern [73]. Fe has very strong correlation with other oxides which have a higher affinity with most elements, especially for trace elements, and that the organic matter contents are important for controlling factors in the abundance of trace metals [74,75]. The results of correlation matrix of each core sample indicate that a significant fraction of the trace metal is found co-precipitated with or adsorbed on to Fe and Mn geochemical phases controlling the trace metals in sediments which may be attributed to their large surface area, extensive cation exchange capacity and widespread availability [76]. This is supported by strong significant positive correlation between Cr and Mn (r = 0.99, p < 0.05) in both the cores. Pattan found that Cr, as one of the redox sensitive metal, was suggested to be co-precipitated with authigenic Mn-oxyhydroxide [77]. Cr-Pb-Zn shows a positive correlation in both the core samples indicating that the nature and origin of these metals would have been similar (Table 2).
| Parameters | Sand | Mud | CaCO3 | OM | Fe | Mn | Cr | Cu | Pb | Zn | Co | Ni | Ba | Sr | V | Rb | |
|---|---|---|---|---|---|---|---|---|---|---|---|---|---|---|---|---|---|
| Mud | -1.000** | 1 | |||||||||||||||
| CaCO3 | 0.863** | -0.863** | 1 | ||||||||||||||
| OM | -0.869** | 0.869** | -0.779** | 1 | |||||||||||||
| Fe | -0.921** | 0.921** | -0.811** | 0.847** | 1 | ||||||||||||
| Mn | -0.843** | 0.843** | -0.716** | 0.678** | 0.830** | 1 | |||||||||||
| Cr | -0.753** | 0.753** | -0.622** | 0.777** | 0.730** | 0.663** | 1 | ||||||||||
| Cu | -0.646** | 0.646** | -0.587** | 0.771** | 0.658** | 0.539** | 0.684** | 1 | |||||||||
| Pb | -0.642** | 0.642** | -0.556** | 0.804** | 0.653** | 0.507** | 0.698** | 0.752** | 1 | ||||||||
| Zn | -0.478** | 0.478** | -0.469** | 0.671** | 0.516** | 0.367** | 0.679** | 0.751** | 0.698** | 1 | |||||||
| Co | -0.476** | 0.476** | -0.480** | 0.701** | 0.464** | 0.299** | 0.551** | 0.572** | 0.695** | 0.582** | 1 | ||||||
| Ni | -0.618** | 0.618** | -0.559** | 0.737** | 0.579** | 0.498** | 0.689** | 0.668** | 0.721** | 0.641** | 0.760** | 1 | |||||
| Ba | -0.194 | 0.194 | -0.034 | -0.087 | 0.143 | 0.358** | 0.118 | -0.063 | -0.172 | -0.105 | -0.569** | -0.322** | 1 | ||||
| Sr | 0.230* | -0.230* | 0.282* | -0.486** | -0.236* | -0.032 | -0.215 | -0.356** | -0.428** | -0.402** | -0.773** | -0.577** | .747** | 1 | |||
| V | -0.697** | 0.697** | -0.646** | 0.800** | 0.692** | 0.542** | 0.675** | 0.676** | 0.674** | 0.522** | 0.670** | 0.666** | -0.071 | -0.466** | 1 | ||
| Rb | -0.803** | 0.803** | -0.715** | 0.702** | 0.793** | 0.758** | 0.609** | 0.487** | 0.568** | 0.353** | 0.491** | 0.593** | 0.029 | -0.171 | 0.568** | 1 | |
| Parameters | Sand | Mud | CaCO3 | OM | Fe | Mn | Cr | Cu | Pb | Zn | Co | Ni | Ba | Sr | V | Rb | |
| Core-2 | Sand | 1 | |||||||||||||||
| Mud | -1.000** | 1 | |||||||||||||||
| CaCO3 | 0.835** | -0.835** | 1 | ||||||||||||||
| OM | -0.787** | 0.787** | -0.580** | 1 | |||||||||||||
| Fe | -0.705** | 0.705** | -0.516** | 0.760** | 1 | ||||||||||||
| Mn | -0.602** | 0.602** | -0.425** | 0.626** | 0.798** | 1 | |||||||||||
| Cr | -0.592** | 0.592** | -0.420** | 0.722** | 0.847** | 0.592** | 1 | ||||||||||
| Cu | -0.059 | 0.059 | 0.003 | 0.334** | 0.473** | 0.396** | 0.519** | 1 | |||||||||
| Pb | 0.062 | -0.062 | -0.024 | 0.116 | 0.15 | 0.036 | 0.138 | 0.386** | 1 | ||||||||
| Zn | 0.168 | -0.168 | 0.108 | 0.13 | 0.109 | 0.115 | 0.106 | 0.528** | 0.714** | 1 | |||||||
| Co | -0.659** | 0.659** | -0.509** | 0.683** | 0.937** | 0.741** | 0.814** | 0.459** | 0.105 | 0.058 | 1 | ||||||
| Ni | -0.673** | 0.673** | -0.448** | 0.703** | 0.872** | 0.631** | 0.889** | 0.363** | -0.081 | -0.117 | 0.846** | 1 | |||||
| Ba | 0.551** | -0.551** | 0.383** | -0.499** | -0.554** | -0.662** | -0.247* | -0.114 | -0.146 | -0.228* | -0.517** | -0.323** | 1 | ||||
| Sr | 0.485** | -0.485** | 0.294** | -0.525** | -0.698** | -0.493** | -0.520** | -0.099 | -0.297** | -0.208* | -0.656** | -0.619** | 0.603** | 1 | |||
| V | -0.639** | 0.639** | -0.433** | 0.652** | 0.891** | 0.677** | 0.797** | 0.307** | 0.114 | -0.035 | 0.854** | 0.819** | -0.379** | -0.650** | 1 | ||
| Rb | -0.368** | 0.368** | -0.268* | 0.411** | 0.674** | 0.559** | 0.610** | 0.579** | -0.072 | -0.021 | 0.721** | 0.585** | -0.212* | -0.098 | 0.608** | 1 |
**Correlation is significant at the 0.01 level (2-tailed). *. Correlation is significant at the 0.05 level (2-tailed).
Table 2: Correlation matrix of trace metals in the core-1 and core-2 sediments of Pichavaram mangroves.
Factor analysis
In order to confirm the different variable associations, to aid in the identification of parameters controlling trace metal distribution, factor analysis was carried out. In the present study, eigen values greater than 1 are selected. Varimax orthogonal rotation has been employed to transform the analysis matrix and to limit the number of variables loaded in each factor. In core 1 and 2, out of the three factors, factor 1 account for 40.62% and 33.25% of the total variance respectively (Table 3). Factor 1 with significant positive loadings on Mud and good loadings on Fe and Mn suggests the associations of these metals with finer sediment fractions and aluminosilicates. This factor may be called as “Clay controlled factor”, assuming the elements to be enriched in the clay fraction in both the core samples. The second factor show high loadings in the parameters viz., Fe, Cr, Cu, Zn, Pb, Co, Ni and organic matter in both the core samples. They are mainly related to anthropogenic inputs and reflect the complexing nature of the organic matter. Cr metal is interpreted as an anthropogenic element that is not forming part of organo-metallic compounds as it shows high positive loading in both the cores. Factor 3 in core 1 shows significant positive loading of Co which may be attributed to the post depositional diagenetic vertical redistirbution caused by remobilization and reprecipitation of Co on oxyhdroxides coating along the core 1 sample. Factor 3 of core 2, where Pb and carbonates shows positive loading indicating that high proportion of lead in sediments appears to be associated with the carbonates.
| Rotated Component Matrix | ||||||
|---|---|---|---|---|---|---|
| Parameters | Component core-1 | Component core-2 | ||||
| Factor 1 | Factor 2 | Factor 3 | Factor 1 | Factor 2 | Factor 3 | |
| Sand | -0.91 | -0.35 | -0.03 | -0.88 | -0.31 | 0.19 |
| Mud | 0.91 | 0.35 | 0.03 | 0.88 | 0.31 | -0.19 |
| CaCO3 | -0.84 | -0.26 | -0.15 | -0.78 | -0.14 | 0.16 |
| OM | 0.71 | 0.57 | 0.29 | 0.7 | 0.48 | 0.1 |
| Fe | 0.87 | 0.38 | 0.04 | 0.6 | 0.76 | 0.14 |
| Mn | 0.86 | 0.27 | -0.17 | 0.55 | 0.58 | 0.13 |
| Cr | 0.56 | 0.69 | 0.01 | 0.4 | 0.81 | 0.08 |
| Cu | 0.4 | 0.79 | 0.14 | -0.16 | 0.72 | 0.5 |
| Pb | 0.43 | 0.72 | 0.29 | 0.08 | -0.01 | 0.87 |
| Zn | 0.17 | 0.89 | 0.16 | -0.05 | 0.05 | 0.93 |
| Co | 0.33 | 0.47 | 0.74 | 0.54 | 0.77 | 0.08 |
| Ni | 0.45 | 0.57 | 0.48 | 0.5 | 0.76 | -0.12 |
| Ba | 0.22 | 0.02 | -0.93 | -0.72 | -0.08 | -0.3 |
| Sr | -0.11 | -0.24 | -0.9 | -0.67 | -0.25 | -0.34 |
| V | 0.58 | 0.51 | 0.31 | 0.53 | 0.72 | 0.01 |
| Rb | 0.86 | 0.16 | 0.14 | 0.06 | 0.87 | -0.1 |
| Eigen value | 6.5 | 4.16 | 2.83 | 5.32 | 5.05 | 2.25 |
| % of Variance | 40.62 | 26.02 | 17.7 | 33.25 | 31.58 | 14.09 |
| Cumulative % | 40.62 | 66.64 | 84.34 | 33.25 | 64.84 | 78.93 |
Table 3: Rotated component analysis results for associated trace elements in Pichavaram mangroves core-1 and core-2 sediments.
Geo-accumulation index
The Geoaccumulation index (Igeo), introduced by Müller, has been used to quantitatively measure metal pollution in aquatic sediments based on a pollution intensity classification (Igeo Class) [45,78-80]. An Igeo study in C1 sediments reveals unpollution with respect to Zn and Co (Igeo< 0). But Cr and Pb shows moderate (Igeo = 1-2) pollution load. Whereas Cu, Ni and V falls under unpolluted to moderately polluted. For core sediment C2, (Igeo< 0) Pb, Zn, Cu, Co and V falls under unpolluted to moderately polluted. Igeo value for Cr and Ni falls under moderately pollution load. B, Sr and Rb falls under unpolluted zone in both C1 and C2 samples indicating that the study area is not polluted with respect to these metals.
Enrichment factor
Anthropogenic disturbances can be evaluated without any complexity by comparing the sediment trace metal content of the study area with the world averages and the values of nearby areas. In general, the degree of enrichment or depletion of a trace element in a sample is evaluated relative to its concentration with the average crustal rocks or average shale [49,79-81]. This method has been widely used to assess the enrichment or depletion of specific elements in riverine, estuarine, and coastal environments [2,46]. Natural concentrations of Fe in sediments are more uniform than Al and beyond the influence of humans which justify its use as a normaliser [1]. In the present study, Fe has been used as a conservative tracer to differentiate natural from anthropogenic components. In C1 core samples, Cr and Pb are moderately enriched in the study area whereas Cu, Zn, Co, Sr, V and Ni show minor enrichment (Figure 4). In C2 core Cr, Cu and Ni shows moderate enrichment. Pb, Zn, Co, Sr show minor enrichment. Br and Rb show no enrichment in both core samples.

Figure 4: Enrichment factor, Geo-accumulation, Contamination factor in C1 and C2 Pichavaram lagoon.
Contamination factor and pollution load index
Sediments have been widely used as environmental indicators and this ability to trace contamination sources and monitor contaminants is also well recognized. Thus, the accumulation of metals in the sediments is strongly controlled by the nature of the substrate as well as the physico-chemical conditions controlling dissolution and precipitation. The accumulation of trace metals in sediments gives rise to two types of impacts on the overlying water. The trace metals themselves may have a synergistic or antagonistic effect on the environment.
Average Contamination Factors of Cr in C1 and C2 are 4.55 and 4.14% respectively; both the cores show considerable contamination. Average Contamination Factors of Cu in C1 and C2 are 2.19 and 3.11%; both the cores fall under moderate contamination zone. Average Contamination Factors of Pb in C1 and C2 are 3.34% and 1.95%; Pb in both the core samples falls in the moderate contamination. Average Contamination Factors of Zn in C1 and C2 are 1.21% and 1.91%, Zn in both the zones falls in the moderate contamination factor. Average Contamination Factors of cobalt in C1 and C2 are 1.14% and 1.69%, respectively. On the basis of above said classification, Co in both the zones falls in the moderate contamination factor. Average Contamination Factors of Ni in C1 and C2 are 1.69 and 3.40%, both the core sediments come under moderate contamination factor. Ba, Sr, V and Rb in both the cores fall under low contamination factor in the study area. The relatively higher concentrations of metals such as Ni, Cu, Co and others associated with this fraction are caused by the adsorption of these metals by the Fe-Mn colloids [82-84]. Based on the pollution load Index, the C2 shows relatively more pollution since the values of PLI are > 2 for trace metals in upper layers which should be taken into consideration as it may be due to anthropogenic input in the estuary region.
Conclusion
The sediment cores collected from two sites provide an ongoing and historical record of pollutant loading and anthropogenic impacts both in mangroves and estuarine region. The trace metals mobilized from the sub-oxic reduced sediment zone reabsorbed onto Fe oxides, and at greater depths they co precipitated with Fe–Mn oxy-hydroxides. This process plays a greater role in trace metal adsorption from these systems than organic matter. Cr, Pb, Co, and Cu were enriched in the sediments of both estuarine and mangrove ecosystems, which have deleterious effects on these sensitive ecosystems. Igeo calculations suggested that the sediment has behaved as a sink for the heavy metals Cr, Pb and Ni. Based on the EF, CF and Igeo, the quality of the sediment could be said to be moderately polluted and continues to deteriorate and this may impact on the macrobenthic organisms living in the study area.
Acknowledgment
The author (Dr. M. Jayaprakash) is grateful to the Department of Science and Technology, Govt. of India for the award of advanced research under the FAST TRACK (SR/FTP/ES-14/2011) scheme. Authors also thank the authorities of Department of Environment and Forests, Government of Tamil Nadu for granting permission to carry out the sample collection.
References
- Daskalakis KD, O'Connor TP (1995) Normalization and elemental sediment contamination in the Coastal United States. Environ Sci Techno 29: 470-477
- Zhang J, Liu CL (2002) Riverine composition and estuarine chemistry of particulate metals in China Weathering features anthropogenic impact and chemical fluxes. Estuarine Coastal Shelf Science 54: 1051-1070.
- Ruiz F, Abad M, Bodergat AM, Carbonel P, LazaroR, et al. (2005) Marine and brackish-water ostra- ´cods as sentinels of anthropogenic impacts. Earth Sci Rev 72: 89-111.
- Xu L, Bi X, Hu R, Tang Y, Wang X, et al. (2014) LA-ICP-MS mineral chemistry of titanite and the geological implications for exploration of porphyry Cu deposits in the Jinshajiang Red River alkaline igneous belt SW China. Mineral Petrolo
- Simpson SL, Batley GE (2007) Predicting metal toxicity in sediments: a critique of current approaches. Integrated Environmental Assessment and Management 3:18-31.
- Wang WX, Rainbow PS (2008) Comparative approaches to understand metal bioaccumulation in aquatic animals. Comparative Biochemistry and Physiology Part C: Toxicology & Pharmacology 148:315-323.
- Cai MH, Lin J, Hong QQ, Wang Y, Cai MG (2011) Content and distribution of trace metals in surface sediments from the northern Bering Sea, Chukchi Sea and adjacent Arctic areas. Mari Pollut Bullet 63: 523-527.
- Hu XF, Du Y, Feng JW, Fang SQ, Gao XJ (2013) Spatial and seasonal variations of heavy metals in wetland soils of the tidal flats in the Yangtze estuary, China: Environmental implications. Pedosphe 23: 511-522.
- Wang Y, Wang P, Bai Y, Tian Z, Li J, et al. (2015) Assessment of surface water quality via multivariate statistical techniques: a case study of the Songhua River Harbin region China. J Hydro-environ Res 7: 30e40.
- Christophoridis C, Dedepsidis D, Fytianos K (2009) Occurrence and distribution of selected heavy metals in the surface sediments of Thermaikos gulf, N. Greece. Assessment using pollution indicators. J Hazard Mat 168: 1082-1091.
- Kucuksezgin F, Uluturhan E, Batki H (2008) Distribution of heavy metals in water, particulate matter and sediments of Gediz River (Eastern Aegean). Environ Monit Assess 141: 213-25.
- Zahra A, Hashmi MZ, MalikRN, Ahmed Z (2014) Enrichment and geo-accumulation of heavy metals and risk assessment of sediments of the KurangNallah-Feeding tributary of the Rawal Lake Reservoir, Pakistan Sci Total Environ 470: 925- 33.
- David AR (2012) Causes and ecological effects of resuspended contaminated sediments (RCS) in marine environments. Environ Internat 40: 230-243.
- Hill NA, Simpson SL, Johnston EL (2013) Beyond the bed: Effects of metal contamination on recruitment to bedded sediments and overlying substrata. Environ Pollut 173: 182-191.
- Dou Y, Li J, Zhao J, Hu B, Yang S (2013) Distribution, enrichment and source of heavy metals in surface sediments of the eastern Beibu Bay, South China Sea. Mar Pollut Bull 67: 137-145.
- Harbison P (1986) Mangrove muds - A sink and a source for trace metals. Mar Poll Bull 17: 246-250.
- Silva CAR, Lacerda LD, Rezende CE (1990) Heavy metal reservoirs in a red mangrove forest. Biotropica 22:339-345.
- Lacerda ID, Fernandez MA, Calazans CF, Tanizaki KF (1992) Bioavailability of heavy metals in sediments of two coastal lagoons in Rio de Janeiro, Brazil. Hydrobiol 228: 65-70.
- Vane C, Harrison I, Kim A, Moss-Hayes V, Vickers B, et al. (2009) Organic and metal contamination in surface mangrove sediments of South China. Mar Pollut Bull 58:134-144.
- Long ER, MacDonald DD, Smith SL, Calder FD (1995) Incidence of adverse biological effects within ranges of chemical concentrations in marine and estuarine sediments. Environ Manage 19: 81-97.
- Argese E, Ramieri E, Bettiol C, Pavoni B, Chiozzotto E, et al. (1997) Pollutant exchange at the water /sediment interface in the Venice canals. Water Air Soil Pollu 99: 255-263.
- Zulkifli SZ, Mohamat-YusufF, Arai T, Ismail A, Miyazakiv N (2010) An assessment 444 of selected trace elements in intertidal surface sediments collected from the Peninsular 445 Malaysia. Environmental Monitoring and Assessment 169: 457-472.
- Kelderman P, Osman AA (2007) Effect of redox potential on heavy metal binding forms in polluted canal sediments in Delft ,The Netherlands. Water Res 41: 4251-4261.
- Harikumar PS, Nasir UP (2010) Eco-toxicological impact assessment of heavy metals in core sediments of a tropical estuary. Ecotoxicol Environ Saf 73: 1742-1747.
- Joksimovic D, Tomic I, Stankovic AR, Jovic M, Stankovic S (2011) Trace metal concentrations in Mediterranean blue mussel and surface sediments and evaluation of the mussels quality and possible risks of high human consumption. Food Chem 127: 632-637.
- Mackey A, Hodgkinson M, Nardella R (1992) Nutrient levels and heavy metals in mangrove sediments from the Brisbane River, Australia. Mar Pollut Bull 24: 418-420.
- Perdomo L, Ensminger I, Elster C, Wallner-kersanach M, Schnetter ML (1999) The mangrove ecosystem of the Ciénaga Grande de Santa Marta (Colombia): observations on regeneration and trace metals in sediment. Mar Pollut Bull 37: 393-403.
- Shriadah M (1999) Heavy metals in mangrove sediments of the United Arab Emirates shoreline (Arabian Gulf). Water Air Soil Pollut 116:523-534.
- Mremi S, Machiwa J (2004) Heavy metal contamination of mangrove sediments and the associated biota in Dar es Salaam, Tanzania. Tanzania J Sci 29: 61-76.
- Defew LH, Mair JM, Guzman HM (2005) An assessment of metal contamination in mangrove sediments and leaves from Punta Mala Bay, Pacific Panama. Mar Pollut Bull 50: 547-552.
- Otero X, Ferreira T, Huerta-Díaz M, Partiti C, Souza V, et al. (2009) Geochemistry of iron and manganese in soils and sediments of a mangrove system, Island of Pai Matos (Cananeia-SP, Brazil). Geoderma 148: 318-335.
- Marchand C, Allenbach M, Lallier-Vergès E (2011) Relationships between heavy metals distribution and organic matter cycling in mangrove sediments (Conception Bay, New Caledonia). Geoderma 160: 444-456.
- Kathiresan K (2000) A review of studies on Pichavaram mangrove, south-east India. Hydrobiol 30:185-205.
- Ramanathan AL, Vaidhyanathan P, Subramanian V, Das BK (1993) Geochemistry of the Cauvery estuary, east coast of India. Estuaries 16:459-474.
- Ramanathan AL, Subramanian V, Ramesh R, Chidambaram S, James A(1999) Environmental geochemistry of the pichavaram mangrove ecosystem (tropical) southeast coast of India. EnviGeol 37: 223-233.
- Yeon-Hong CHO, Lakshumanan C, Natesan U (2004) Coastal wetland and shoreline change mapping of Pichavaram south east coast of India using satellite data 2004- Map India Conference Beijing China.
- Sundararajan M, Natesan U (2011) Environmental geochemistry of core sediments from serthalaikkadu creek East coast of India. Environmental Earth Sciences 62: 493-506.
- Jayaprakash M, Arya V, Gopal V, Muthuswamy S, Kalaivanan P, et al. (2014) Bioavailable trace metals in micro-tidal Thambraparani estuary, Gulf of Mannar, SE coast of India. Estuarine, Coastal and Shelf Science 146: 42-48.
- Ingram RL (1970) Procedures in sedimentary petrology. Wiley NewYork USA.
- Gaudette HE, Wilson RF, Toner L, Foger David W (1974) An inexpensive titration methods for determination of organic carbon in recent sediments. J Sedim Petrol 44: 249-253.
- Loring DH, Rantala RTT (1992) Manual for the geochemical analyses of marine sediments and suspended particulate matter. Earth Sci Rev 32: 235-283.
- Chen Z, Kostaschuk R, Yang M (2001) Heavy metals on tidal flats in the Yangtze Estuary China. Environ Geol 40: 742-749.
- Henry RC (2002) Multivariate Receptor Modeling by NDimensional Edge Detection. ChemomIntell Lab Syst 65: 179-189.
- Filgueiras AV, Lavilla I, Bendicho C (2004) Evaluation of distribution, mobility and binding behaviour of heavy metals in surficial sediments of Louro River (Galicia, Spain) using chemometric analysis: a case study. Sci Total Environ 330: 115-129.
- Muller G (1981) Die Schwermetallbelastung der sedimenten des Neckars und Seine Nebenflusse. Chemiker-Zeitung6: 157-164.
- Selvaraj K, Ram-Mohan V, Szefer P (2004) Evaluation of metal contamination in coastal sediments of the Bay of Bengal India: Geochemical and statistical approaches. Marine Pollut Bullet 49: 174-185.
- Loska K, Wiechula D, Korus I (2004) Metal contamination of farming soils affected by industry. Environ Internat 30: 159-165
- Magesh NS, Chandrasekar N, Roy VD (2011) Spatial analysis of trace element contamination in sediments of Tamiraparani estuary, southeast coast of India. Estuar Coast Shelf Sci 92: 618-628.
- Wedepohl KH (1995)The composition of the continental crust. GeochimicaetcosmochimicaActa 59: 1217-1232.
- Acevedo-Figueroa D, Jimenez BD, Rodriguez-Sierra CJ (2006) Trace metals in sediments of two estuarine lagoons from puertorico. Environ Pollu 141: 336-342.
- Tomlinson DC, Wilson JG, Harris CR, Jeffrey DW (1980) Problems in the assessment of heavy-metal levels in estuaries and the formation of a pollution index. Helgoland Mar Res 33: 566-575.
- Alin SR, Cohen AS (2003) Lake level history of Lake Tanganyika, East Africa, for the past 2500 years based on ostracode-inferred water-depth reconstruction. PalaeogeoPalaeoclimPalaeoeco 199: 31-49.
- Furukawa K, Wolanski E, Mueller H (1997) Currents and sediment transport in mangrove forests. Estuar Coast Shelf Sci 44: 301-310.
- Soto-Jimenez M, Paez-Osuna F (2001) Cd, Cu, Pb, and Zn in lagoonal sediments from mazatlan harbor (SE Gulf of California): bioavailability and geochemical fractioning. Bulletin of Environmental Contamination and Toxicology 66: 350-356.
- Janaki-Raman D, Jonathan MP, Srinivasalu S, Armstrong-Altrin JS, Mohan SP, et al. (2007) Trace metal enrichments in core sediments in Muthupet mangroves, SE coast of India: Application of acid leachable technique. Environ Pollut 145: 245-257.
- Paropkari AL (1979) Distribution of organic carbon in sediments of the northwestern continental shelf of India. Indian J Mar Sci 8: 127-129.
- Jonathan MP (2001) Geochemicalcharacteristics of surface and core sediments, off Tuticorin, Gulf of Mannar, South India: Implications for metal pollution.
- Verma A, Subramanian V (2002) Organic matter and amino acid concentrations in surface sediments of the Vembnad Lake A tropical estuary. Regional Environmental Change 2: 143-149.
- Raghunath R, Murthy TRS (1996) Carbonate and organic matter studies of the shelf of Kasargod, west coast of India. Ind J Mar Sci 25: 355-357.
- Jonathan MP, RamMohan V, Srinivasalu S (2004) Geochemical variations of major and trace elements in recent sediments, off the Gulf of Mannar, the southeast coast of India. Environ Geol 45: 466-480.
- Alagarsamy R (2006) Distribution and seasonal variation of trace metals in surface sediments of the Mandovi estuary, west coast of India. Estuary Coast Shelf Sci 67: 333-339.
- Gopinath A, Nair SM, Kumar NC, Jayalakshmi KV, Pamalal D (2009) A baseline study of trace metals in a coral reef sedimentary environment, Lakshadweep Archipelago. Environ Earth Sci 59: 1245-1266.
- Nobi EP, Dilipan E, Thangaradjou T, Sivakumar K, Kannan L (2010) Geochemical and geostatistical assessment of heavy metal concentration in the sediments of different coastal ecosystems of Andaman Islands, India. Estuar Coast Shelf Sci 87: 253-264
- Cho HY, Lakshumanan C, Natesan U (2004) Coastal wetland and shoreline change mapping of Pichavaram, south east coast of India using satellite data.
- Prasad MBK (2005) Nutrient dynamics in Pichavaram mangroves, southeast coast of India.
- Klinkhammer GP (1980) Earlydiagenesis in sediments from the Eastern Equatorial pacific, II. Pore water metal results. Earth Planet Sci Let 49: 81-101.
- Lee SV, Cundy AB (2001) Heavy metal contamination and mixing processes in sediments from the Humber Estuary, Eastern England. Estuarine Coastal Shelf Sci 53: 619-636.
- Ayyamperumal T, Jonathan MP, Srinivasalu S, Armstrong-Altrin JS, Ram-Mohan V (2006) Assessment of acid leachable trace metals in sediment cores from river Uppanar, Cuddalore, Southeast coast of India. Env Poll 143: 34-45.
- He YQ, Wen WY (1985) Pollution of lead in the estuary of Lingdingyang. Trop Oceanol 4: 53-58.
- Qiu L (1989) The distribution patterns of heavy metals in surface sediments of the sea region of the Pearl River Estuary. Marine Sci Bullet 8: 36-43.
- Li XD, Wai OWH, Li YS, Coles BJ, Ramsey MH, et al. (2000a) Heavy metal distribution in sediment profiles of the Pearl River Estuary, South China. ApplGeochem 15: 567-581.
- Li XD, Shen ZG, Wai OWH, Li YS (2000b) Chemical partitioning of heavy metal contaminants in sediments of the Pearl River Estuary. ChemSpeciatBioavailab 12: 17-25.
- Samuel NL, Phillips DJ H (1988) Distribution variability and impacts of trace elements in san francisco Bay. Mar Poll Bull 19: 413-425.
- Stumm W, Morgan JJ (1996) Aquatic chemistry: Chemical equilibria and rates in natural waters. John Wiley.
- Rubio B, Nombela MA, Vilas F (2000) Geochemistry of major and trace elements in sediments of the Ria de Vigo (NW Spain): an assessment of metal pollution. Marine Pollution Bulletin 40: 968-980.
- Szefer P, Glasby GP, Stüben D, Kusak A, Geldon J (1998) Distribution of selected heavy metals and rare earth elements in surficial sediments from the Polish sector of the Vistula Lagoon. Chemosphere 39: 2785-2798.
- Pattan JN, RaoCh M, Higgs NC, Colley S, Parthiban (1995) Distribution of major, trace and rare earth elements in surface sediments of the Whart on Basin, Indian Ocean. ChemGeol 121: 201-216.
- Buckley D, Smith J, Winters G (1995) Accumulation of contaminant metals in marine sediments of Halifax Harbour, Nova Scotia: environmental factors and historical trends. AppliGeochem 10: 175-195.
- Muthu Raj S, Jayaprakash M (2008) Distribution and enrichment of trace metals in marine sediments of Bay of Bengal, off Ennore, south-east coast of India. Environ Geol 56: 207-217.
- Taylor SR, McLennan SM (1985) The continental crust: its composition and evolution. London Blackwell Publs312
- Purushothaman P, Chakrapani GJ (2007) Heavy metals fractionation in Ganga River sediments, India. Environ Monito Assess 132: 475-489.
- Pekey H, Karakas D, Ayberk S, Tolun L, Bakoglu M (2004) Ecological risk assessment using trace elements from surface sediments of Izmit Bay (Northeastern Marmara Sea) Turkey. Mar Pollut Bull 48: 946-953.
- Savvides C, Papadopoulos A, Haralambous KJ, Loizidou M (1995) Sea sediments contaminated with heavy metals: metal speciation and removal. Water Sci Tech 32: 65-67.
- Tam N, Wong Y (2000) Spatial variation of heavy metals in surface sediments of hongkong mangrove swamps. Environ Pollut 110:195-205.
Relevant Topics
- Atmosphere
- Atmospheric Chemistry
- Atmospheric inversions
- Biosphere
- Chemical Oceanography
- Climate Modeling
- Crystallography
- Disaster Science
- Earth Science
- Ecology
- Environmental Degradation
- Gemology
- Geochemistry
- Geochronology
- Geomicrobiology
- Geomorphology
- Geosciences
- Geostatistics
- Glaciology
- Microplastic Pollution
- Mineralogy
- Soil Erosion and Land Degradation
Recommended Journals
Article Tools
Article Usage
- Total views: 5118
- [From(publication date):
February-2017 - Sep 02, 2025] - Breakdown by view type
- HTML page views : 4012
- PDF downloads : 1106