Investigation of Linkages of El-Nino Southern Oscillation with Monsoonal Precipitation in India
Received: 18-Nov-2017 / Accepted Date: 28-Nov-2017 / Published Date: 30-Nov-2017 DOI: 10.4172/2157-7617.1000426
Abstract
The El-Nino southern oscillation (ENSO) is driven by temperature changes in the tropical Pacific Ocean, and can have profound impact on weather conditions around the world. The presence of large scale climate signals and their linkages to hydrologic processes on land response is a valuable indicator of impacts on extreme precipitation and stream flow events on a local scale. In recent years, the ENSO has shown greater variability indicating that it may strengthen under climate change. Therefore, the major objective of the present research was to investigate the linkages of ENSO with the monsoonal precipitation at 40 meteorological stations in India. The novelty of the present research lies in the investigation of linkages of ENSO with point rainfall rather than average rainfall computed over a large area. The results indicated a negative association between ENSO and monsoonal precipitation at the majority of stations considered in this study. Only Six stations, namely, Bhubaneswar, Gaya, Guwahati, Hissar, Kolkata and Mysore showed positive correlation between ENSO and monsoonal precipitation. It is concluded from the analysis of linkages of ENSO with monsoonal precipitation at different stations that the ENSO is associated with weak Indian monsoon. Advances in understanding the linkages of large scale indices with land-surface hydrologic processes have the potential to improve monsoon forecasting skills in India.
Keywords: El-Nino; ENSO; Pacific; Monsoonal; Precipitation; Indian; Monsoon
Introduction
Protracted differences in temperature between the eastern and western tropical Pacific Ocean that results in sea surface warming near the coast of Peru and Ecuador defines the phenomenon of El-Nino Southern Oscillation (ENSO). The Southern Oscillation is measured by observing the pressure difference between Tahiti Islands in French Polynesia and Darwin in Australia. During normal years, a highpressure system develops over the coast of Peru, whereas northern Australia and Indonesia experience a low-pressure system. As a consequence, strong trade winds move from east to west in the tropical Pacific Ocean. Precipitation to South East Asia and Australia is brought by these trade winds as they carry warm surface waters westward along with them. Cold and nutrient-rich water swells up to the surface along the coast of Peru, and thus the fishing industry gets boost in South America.
The El-Nino leads to important consequences for weather across the globe. Generally, the phenomenon of El-Nino is observed at irregular intervals of 3–7 years, with the average period being 5 years. A warming of a minimum 0.5°C (0.9 °F) averaged over the east-central tropical Pacific Ocean in temperature is required for El-Nino to occur. When 7 to 9 months of such warming occurs, it is known as El Niño "conditions"; whereas if warming of more than 9 months is found, it is called as El Niño episodes. Driven by sea-surface changes in the tropical Pacific Ocean, the ENSO phenomenon is perceived to impact weather conditions around the world. The impact of El-Niño phenomenon is observed beyond the Pacific Ocean region due to the correlation of El-Nino with other climatic oscillations. In India, the major impact of the phenomenon is on the magnitude of monsoonal rainfall. A major portion of the annual rainfall in India (around 80 percent) is received during the southwest monsoon season of June to September [1]. A high degree of spatial and temporal variability is clearly evident in the monsoonal rainfall in India.
Since last several decades, the ENSO, and its deleterious impacts on the Indian monsoon has been a subject of great practical importance. India is an agriculture-based economy, where crop production is hugely dependent on monsoonal rainfall. Therefore, it is important to understand the ENSO phenomenon and its impact on monsoonal rainfall. The impact of El-Nino is observed on agriculture, fishing, industries, and other sectors that have a cascading effect on the economy of the country. The monsoonal rainfall is the lifeline of agriculture in India. Any erratic patterns in monsoonal rainfall has devastating impact on agriculture, and consequently on the national economy that relies heavily on agricultural production. Reduction in the agricultural yield has, in most El-Nino years, resulted in the spike in commodity prices thus impacting a sizeable population that lives below the poverty line. A detailed understanding of the El-Nino phenomena and its various impacts is necessary to counter the adverse impacts of El-Nino on agricultural production. With the present state of art in monsoonal forecasting in India, it is even more important to understand the linkages of El- Niño phenomenon with the monsoonal rainfall.
Literature Review
Evaluation of impacts of large scale climate indices on weather events in different regions of the world has been a subject of great practical importance. Research conducted in different parts of the world has led to the conclusion that a significant correlation exists between large climate indices and precipitation [2,3]. It has been found that daily precipitation amounts as well as precipitation frequencies, both are altered due to ENSO events [4,5]. Changes in precipitation and temperature in North America has been found to be related to the North Atlantic Oscillation NAO [6]. Owing to lack of efficient irrigation, the agricultural production in many parts of the world depends upon rainfall. In India, irrigation production is hugely dependent on the monsoonal rainfall. Often, the crop production models utilize information from basin scale weather generators such as those developed by Sharif and Burn [7,8] and Sharif et al. [9]. Several studies [10,11] have concluded that the climate change has resulted in an increasing trend in temperature in regions around the world. Due to impact of climate change on temperature, the ENSO is believed to have strengthened under climate change. During the last decade, considerable emphasis has been laid on the research concerning the impact of large scale indices on the agricultural production in different regions worldwide.
The Pacific Decadal Oscillation (PDO) [12] is a pattern of Pacific climate variability that shifts phases on inter-decadal time scale, usually about 20 to 30 years. It is a major large-scale climate index in addition to the ENSO index. Gershunov et al. [4] investigated and found the signature of ENSO in the wintertime frequencies of heavy precipitation and temperature extremes, which is derived from both observations and atmospheric general circulation model output for the contiguous United States. Dettinger et al. [2] worked in Western North America on different time-scales on the North-South precipitation patterns. In pursuit of having a better understanding of this north– south precipitation contrasts, studies were carried out and inter-annual and decadal variations were studied in terms of its effects on total amount of precipitation and their interrelationship to large-scale climatic patterns. Garen [13] found the applicability of the ENSO as a primary variable in stream flow forecasting.
Chang-Hoi Ho et al. [14] examined South Indian Ocean (SIO) during December–March season for determination of variation of tropical cyclone activity during the period 1979–2004. Deng et al. [15] conducted a study to determine whether the ENSO has any impact on the Chinese rice production. The authors found the interdependence and relationships between ENSO and rice production of Jiangxi province, whereas the monthly distribution of rainfall was found to be almost same in ENSO as well as neutral years. Goro et al. [16] investigated the rapid termination of the 2006 El Niño using observed data and a coupled ocean-atmosphere general circulation model (CGCM). Cobb et al. [17] investigated the cause of large changes in global climate patterns from one year to the other. The authors found that although it is driven by ENSO, its sensitivity to continued anthropogenic greenhouse forcing is uncertain. An investigation of low-discharge events of the Paranaiba River basin by Sahu et al. [18] revealed an association of these events with the Pacific sea surface temperature anomalies resembling the El Nino Modoki phenomenon.
Severe droughts and floods are caused due to year-to-year variability in monsoon rainfall. A study by Gautam et al. [19] discussed El-Nino conditions in 2014 and its impact on southwest monsoonal rainfall. Deng et al. [20] analyzed inter-annual variability in precipitation in different regions of China for the period 1979-2012. The authors used empirical orthogonal functions to demonstrate that the annual precipitation variations are attributable to ENSO. Roy and Collins [21] found that the spatial pattern of ENSO over Australia has changed in the past few decades. It is, therefore, probable that the variations in local Hadley circulation are responsible for affecting the Indian summer monsoonal (ISM) rainfall during the past few decades. Roy et al. [22] investigated linkages of ENSO to ISM rainfall in observations as well as models. The results of the study by authors clearly indicated a strong teleconnection of ISM with ENSO. There is consistent evidence that El-Nino has a major influence on monsoon development in India but, in spite of the intensive research on this subject there is no absolute agreement in the precise connection between monsoon rainfall and El Nino. Therefore, the overarching aim of the present research is to investigate the linkages of ENSO index with the monsoonal precipitation at a large number of rainfall stations. Considering a relatively large number of stations in the analysis is important for improving the reliability of the conclusions drawn.
Data used
The monthly mean maximum temperature (TMX), monthly mean minimum temperature (TMN), and monthly precipitation (PPT) data for different stations was obtained from India Meteorological Department, Pune. A total of 40 stations was considered for the present research. The geographical location of different stations considered in this study is shown in Figure 1. At all stations except Agra, Akola, and Gopalpur, the precipitation data is available from 1950-2015. At Agra, Akola, and Gopalpur the precipitation data is available upto 2000 only. The characteristics of different stations are shown in Table 1. The Nino 3.4 index, that is the SST anomaly over the Nino 3.4 region (120° W–170° W, 5° S– 5° N, was obtained from Climate Analysis Section, National Center for Atmospheric Research (NCAR) in the United States of America (http://www.cgd. ucar.edu/). Figure 2 shows the Nino 3.4 Region in the Pacific Ocean.
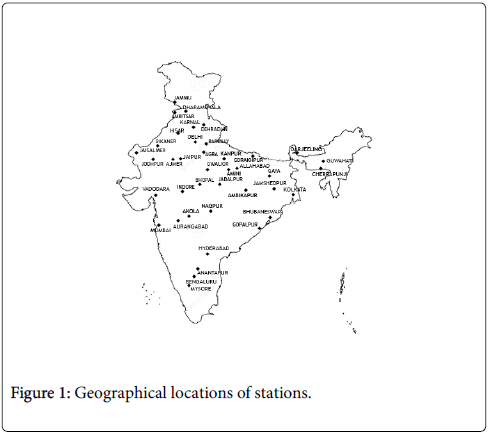
Figure 1: Geographical locations of stations.
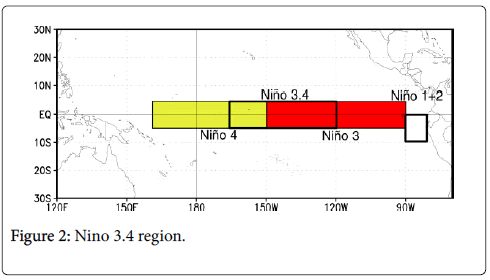
Figure 2: Nino 3.4 region.
| Station | Latitude | Longitude | Elevation (M) |
|---|---|---|---|
| Agra | 27° 10' N | >78° 05' E | 171 |
| Ajmer | 26° 27' N | 74° 42' E | 200 |
| Akola | 20° 00' N | 76° 00' E | 286 |
| Allahabad | 25° 28' 22.9224'' N | 81° 52' 42.0852'' E | 98 |
| Ambikapur | 21° 30' N | 82° 0' E | 623 |
| Amini | 11.1142° N | 72.7204° E | 2 |
| Amritsar | 31° 37' N | 74° 55' E | 219 |
| Anantapur | 14° 41' N | 77° 39' E | 335 |
| Aurangabad | 19° 53' N | 75° 23' E | 568 |
| Bangaluru | 12° 58' N | 77° 38' E | 920 |
| Bareilly | 28° 22' N | 79° 27' E | 268 |
| Baroda | 25° 25' N | 76° 70' E | 129 |
| Bhopal | 23° 15' 35.7588'' N | 77° 24' 45.4068'' E | 527 |
| Bhubaneswar | 20° 15' N | 85° 52' E | 45 |
| Bikaner | 28° 01' N | 73° 22' E | 242 |
| Cherrapunji | 25° 18' 0" N | 91° 42' 0" E | 1484 |
| Darjeeling | 27° 03' N | 88° 18' E | 2042 |
| Dehradun | 30° 19' N | 78° 04' E | 435 |
| Delhi | 28° 36' 0" N | 77° 12' 0" E | 216 |
| Dharamsala | 32° 16' N | 76° 23' E | 1457 |
| Gaya | 42° 49' N | 85° 01' E | 111 |
| Gopalpur | 19° 16' N | 84° 57' E | 1 |
| Gorakhpur | 26° 45' N | 83° 24' E | 84 |
| Guwahati | 26° 11'N | 91° 44'E | 55 |
| Gwalior | 26° 13' 5.8332'' N | 78° 10' 58.1916'' E | 196 |
| Hissar | 29° 19' N | 76° 23' E | 215 |
| Hyderabad | 17° 23' 13.7040'' N | 78° 29' 30.0624'' E | 505 |
| Indore | 22° 44' N | 75° 50' E | 553 |
| Jabalpur | 23° 10' N | 79° 59' E | 412 |
| Jaipur | 26° 55' 19.4520'' N | 75° 46' 43.9860'' E | 431 |
| Jaisalmer | 26° 55' N | 70° 57' E | 225 |
| Jammu | 32° 43' N | 74° 54' E | 327 |
| Jamshedpur | 22° 50' N | 86° 10' E | 135 |
| Jodhpur | 26° 18' N | 73° 04' E | 231 |
| Kanpur | 26° 26' 59.7228'' N | 80° 19' 54.7356'' E | 126 |
| Karnal | 28° 16' N | 77° 05' E | 228 |
| Kolkata | 22° 34' 21.5220'' N | 88° 21' 50.0112'' E | 9.1 |
| Mumbai | 18° 55' N | 72° 54' E | 14 |
| Mysore | 12° 18' N | 76° 42' E | 763 |
| Nagpur | 21° 8' 47.8788'' N | 79° 5' 19.8960'' E | 310 |
Table 1: Latitude, longitude, elevation of all the 40 stations.
Methodology
Linkages of Nino 3.4 index with the precipitation data at 39 meteorological stations in the basin have been investigated for both the warm and cold phases of El-Nino. The first step in the methodology employed here was to identify the years with El-Nino and La-Nina events. For the purpose of classification of El-Nino years, the sea surface temperature anomalies were computed for the June to September period using the data obtained from the NCAR. A year is then classified as El-Nino year if the anomaly for a particular year exceeds a threshold value of 0.4°C, whereas a year with anomaly greater than 0.4°C is classified as a La-Nina year. Figures 3 and 4 show the classification of years into three different categories, that is, El- Nino, La-Nina and normal years. The classification of different years is based on the threshold temperature anomaly of 0.4°C. The second step was to compute the correlation coefficient between Nino 3.4 index and monsoonal precipitation at all the 40 stations considered. The correlations coefficients between Nino 3.4 index and precipitation have been calculated by using R-package open source statistical and computing software available on https://cran.r-project.org by R Core Team in 2014.
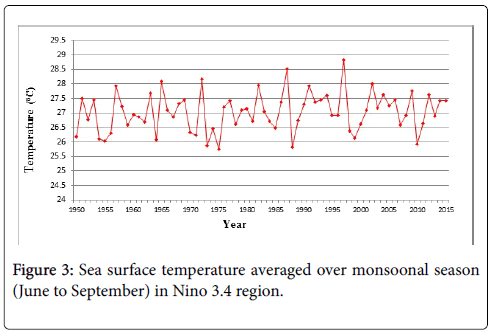
Figure 3: Sea surface temperature averaged over monsoonal season (June to September) in Nino 3.4 region.
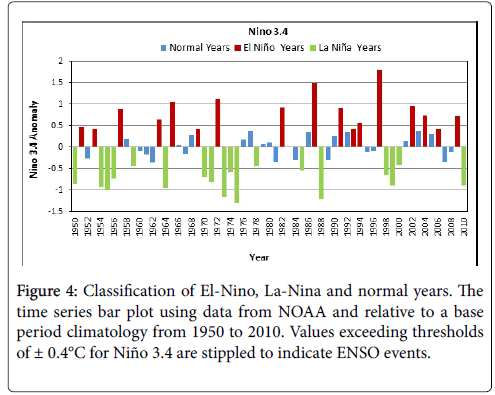
Figure 4: Classification of El-Nino, La-Nina and normal years. The time series bar plot using data from NOAA and relative to a base period climatology from 1950 to 2010. Values exceeding thresholds of ± 0.4°C for Niño 3.4 are stippled to indicate ENSO events.
Results and Discussion
Figure 3 shows the variation of average monsoonal sea-surface temperature with time in Nino 3.4 region of the Pacific Ocean. Based upon the average monsoonal temperature for the 1950 to 2015 period, the sea surface temperature anomalies in the Nino 3.4 region were computed. A plot of Nino 3.4 anomalies for different years of record is shown in Figure 4. It can be observed from Figure 4 that both positive as well as negative anomalies occur in the observed temperature in the Nino 3.4 region. It can be seen from Table 2 that there are 17 El-Nino years out of 61 years, thus indicating a periodicity of approximately 4 years. The number of La-Nina years was 18 out of 61. There were 35 years out of 61 which were associated either with the El-Nino or the La-Nino phase of the southern oscillation while the rest of the years were normal years (Table 3).
| Normal years | El-Nino years | La-Nina years |
|---|---|---|
| 1952, 1958, 1960, 1961, 1962, 1966, 1967, 1968, 1976, 1977, 1979, 1980, 1981, 1983, 1984, 1986, 1989, 1990, 1992, 1995, 1996, 2001, 2003, 2005, 2007, 2008 |
1951, 1953, 1957, 1963, 1965, 1969, 1972, 1982, 1987, 1991, 1993, 1994, 1997, 2002, 2004, 2006, 2009 |
1950, 1954, 1955, 1956, 1959, 1964, 1970, 1971, 1973, 1974, 1975, 1978, 1985, 1988, 1998, 1999, 2000, 2010 |
| Total: 26 | 17 | 18 |
Table 2: Normal, El-Nino and La-Nina years.
| El Niño | La Niña | ||||||
|---|---|---|---|---|---|---|---|
| Weak | Moderate | Strong | Very Strong | Weak | Moderate | Strong | Very Strong |
| 1951-52 | 1963-64 | 1957-58 | 1982-83 | 1950-51 | 1955-56 | 1973-74 | -- |
| 1952-53 | 1986-87 | 1965-66 | 1997-98 | 1954-55 | 1970-71 | 1975-76 | -- |
| 1953-54 | 1987-88 | 1972-73 | 2015-16 | 1964-65 | 1998-99 | 1988-89 | -- |
| 1958-59 | 1991-92 | -- | -- | 1967-68 | 1999-00 | -- | -- |
| 1968-69 | 2002-03 | -- | -- | 1971-72 | 2007-08 | -- | -- |
| 1969-70 | 2009-10 | -- | -- | 1974-75 | 2010-11 | -- | -- |
| 1976-77 | -- | -- | -- | 1983-84 | -- | -- | -- |
| 1977-78 | -- | -- | -- | 1984-85 | -- | -- | -- |
| 1979-80 | -- | -- | -- | 1995-96 | -- | -- | -- |
| 1994-95 | -- | -- | -- | 2000-01 | -- | -- | -- |
| 2004-05 | -- | -- | -- | 2011-12 | -- | -- | -- |
| 2006-07 | -- | -- | -- | 2016-17 | -- | -- | -- |
Table 3: El-Nino and La-Nina Years (1950-2015), Weak (with a 0.5 to 0.9 SST anomaly), Moderate (1.0 to 1.4 SST Anomaly), Strong (1.5 to 1.9 SST Anomaly) and Very Strong (≥ 2.0 SST Anomoly).
A correlation analysis was carried out to determine the impact of ENSO on the monsoonal precipitation at different stations under consideration. Figure 5 shows the variation of average monsoonal temperature in Nino 3.4 region with the monsoonal precipitation at different stations. The correlation was found to be negative at a majority of stations. There are only 4 stations where the correlation was found to be positive, thus indicating that the monsoonal precipitation in India generally decreases with the increase in temperature in the Nino 3.4 region. To test the statistical significance of the correlation, p-value of the correlation was computed. Table 4 shows the values of correlation coefficients and the p-values associated with these coefficients. A p-value of less than 0.05 indicates that the trend is statistically significant at 5% significance level. The bold values in the Table 4 indicate that the correlation coefficients are statistically significant at 5% significance level. At 11 stations, the correlation coefficients are statistically significant at 5% significance level, which clearly indicates that the monsoonal precipitation is significantly impacted in an adverse manner with the increase in average temperature in the Nino 3.4 region. The stations with statistically significant correlation are Ajmer, Akola, Amritsar, Bengaluru, Bareli, Indore, Jaipur, Jamshedpur, Jodhpur, and Mumbai.
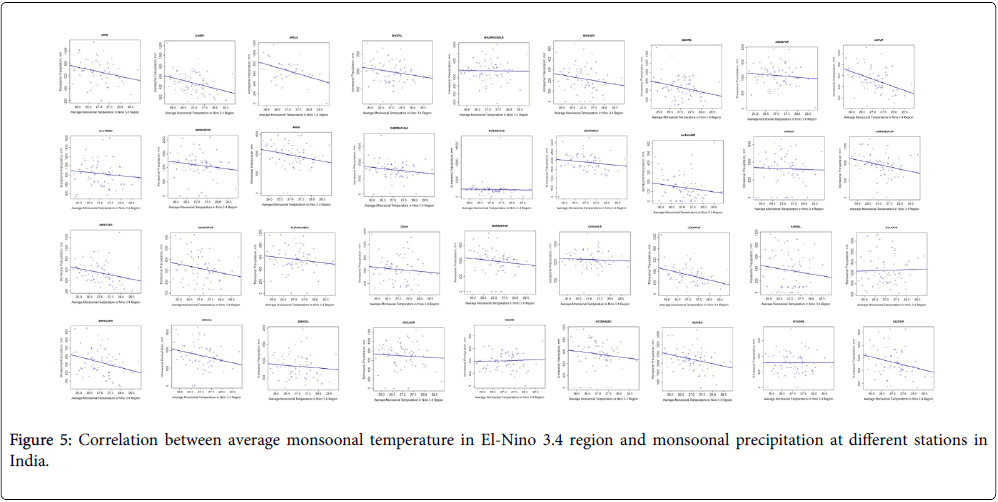
Figure 5: Correlation between average monsoonal temperature in El-Nino 3.4 region and monsoonal precipitation at different stations in India.
| S. No | Station | Correlation Co-efficients | p-value |
|---|---|---|---|
| 1 | Agra | -0.263 | 0.063 |
| 2 | Ajmer | -0.347 | 0.004 |
| 3 | Akola | -0.426 | 0.007 |
| 4 | Allhabad | -0.116 | 0.355 |
| 5 | Ambikapur | -0.149 | 0.233 |
| 6 | Amini | -0.220 | 0.076 |
| 7 | Amritsar | -0.265 | 0.032 |
| 8 | Anantapur | -0.213 | 0.086 |
| 9 | Aurangabad | -0.134 | 0.290 |
| 10 | Banglore | -0.283 | 0.021 |
| 11 | Baraili | -0.269 | 0.029 |
| 12 | Baroda | -0.102 | 0.421 |
| 13 | Bhopal | -0.209 | 0.092 |
| 14 | Bhubaneswar | -0.013 | 0.922 |
| 15 | Bikaner | -0.195 | 0.117 |
| 16 | Cherrapunji | -0.166 | 0.183 |
| 17 | Darjeeling | -0.033 | 0.794 |
| 18 | Dehradun | -0.154 | 0.218 |
| 19 | Delhi | -0.102 | 0.413 |
| 20 | Dharamsala | -0.161 | 0.199 |
| 21 | Gaya | 0.064 | 0.610 |
| 22 | Gopalpur | -0.092 | 0.521 |
| 23 | Gorakhpur | -0.120 | 0.337 |
| 24 | Guwahati | -0.059 | 0.643 |
| 25 | Gwalior | -0.070 | 0.574 |
| 26 | Hissar | 0.051 | 0.684 |
| 27 | Hyderabad | -0.142 | 0.254 |
| 28 | Indore | -0.289 | 0.019 |
| 29 | Jabalpur | -0.105 | 0.401 |
| 30 | Jaipur | -0.417 | 0.001 |
| 31 | Jaisalmer | -0.159 | 0.202 |
| 32 | Jammu | -0.031 | 0.802 |
| 33 | Jamshedpur | -0.264 | 0.033 |
| 34 | Jodhpur | -0.360 | 0.003 |
| 35 | Karnal | -0.135 | 0.278 |
| 36 | Kolkata | 0.029 | 0.815 |
| 37 | Mumbai | -0.289 | 0.019 |
| 38 | Mysore | 0.002 | 0.988 |
| 39 | Nagpur | -0.256 | 0.038 |
Table 4: Correlation coefficients and associated p-values at different stations.
It is a well-established fact the El Nino affects the weather condition around the globe. However, the exact nature of impact of El Nino on monsoonal precipitation is still not clear. It has been observed in the past that El Nino years are not necessarily associated with below normal precipitation. The year 1997-98 was an El Nino year, but the observed precipitation was higher than normal. On the other hand, a moderate El Nino in 2002 resulted in one of the worst droughts. Barring a few exceptions, the most prominent droughts in India have occurred during El Nino years. Therefore, it is highly significant to forecast the likely impacts of El Nino on agricultural production in different regions of India. The results of the analysis conducted in the present research clearly demonstrated that the magnitude of monsoonal precipitation in India is inversely related to the El Nino phenomenon in different parts of the world. The past behavior of El- Nino clearly suggests that the El Nino years do not necessarily lead to droughts in India although some major droughts have occurred in El- Nino years.
Conclusion
The major aim of the present study was to investigate the linkages of ENSO with the monsoonal precipitation at 40 meteorological stations in India. The results indicated a negative association between ENSO and monsoonal precipitation at the majority of the stations, considered for this study. Only six stations, namely, Bhubaneswar, Gaya, Guwahati, Hissar, Kolkata and Mysore showed positive correlation between ENSO and monsoonal precipitation. It is concluded from the analysis of linkages of ENSO with monsoonal precipitation at different stations that the ENSO is associated with weak Indian monsoon. Advances in understanding the tele-connections of sea surface temperature and persistent climate anomalies to the land surface have the potential to improve monsoon forecasting skills in India.
The food prices in a given year are dependent upon the agricultural production achieved in that year. Both the strength and duration of El- Nino events impact agricultural production of a region significantly. Although the agricultural production is impacted by the timings as well as the duration of El-Nino events, the sensitivity of specific crops to adverse climatic conditions also play a major role. In several regions of the world, an appreciable reduction in the agricultural production was observed during the years that were accompanied by El-Nino events. A practical application of the present research is in the agricultural sector, where the crop production could be forecast based upon the rainfall as projected under the influence of ENSO. It is, therefore, the need of the hour that due attention is paid to research in the areas concerning the phenomenon of El-Nino and its adverse impact on agricultural production. The food security of a developing country is highly dependent on the indigenous crops, and therefore greater focus on crops that are significantly resistant to adverse climatic conditions is required. It can be concluded that the results of the present research have the potential to contribute towards efficient management of agricultural production, particularly during the El- Nino phase of ENSO.
References
- Selvaraju R (2003) Impact of El Niño–Southern oscillation on Indian food grain production. Int J Climatol 23: 187–206
- Dettinger MD, Cayan DR, Diaz HF, Meko DM (1998) North-south precipitation patterns in western North America on Interannual –to-decadal timescales. J Climate 11: 3095-3111
- Neal EG, Walter MT, Coffeen C (2002) Linking the pacific decadal oscillation to seasonal stream discharge patterns in southeast Alaska. J Hydrology 263: 188–197
- Gershunov A, Barnett TP (1998) ENSO influence on intraseasonal extreme rainfall and temperature frequencies in the contiguous United States: Observations and model results. J Climate 11: 1575-1586
- Woolhiser DA, Keefer TO, Redmond KT (1993) Southern oscillation effects on daily precipitation in the southwestern United States, Water Resour Res 29: 1287-1295
- Enfield DB, Mestas-Nunez AM, Trimble PJ (2001) The Atlantic multidecadal oscillation and it’s relation to rainfall and river flows in the continental U. S., Geophysical Research Letters 28: 2077-2080
- Sharif M, Burn DH (2004) Development and application of K-nearest neighbor weather generating model’, 57th Canadian Water Resources Association Annual Congress Water and Climate Change: Knowledge for better adaptation, 16–18 June, Montreal, Canada
- Sharif M, Burn DH (2004) Assessment of water resources risk and vulnerability to changing climatic conditions: Development and application of a K-NN weather generating model, Tech. Rep. III, The University of Western Ontario, London, Ontario, Canada.
- Sharif M, Burn DH, Hofbauer KM (2013) Generation of daily and hourly weather variables for use in climate change vulnerability assessment’, Water Resources Management 27: 1533–1550
- Hamid AT, Sharif M, Archer D (2014) Analysis of temperature trends in Satluj River Basin, India. J Earth Sci Clim Change 5: 222
- Sharif M, Archer D, Fowler H, Forsythe N (2013) Trends in magnitude and timings of flow in the Upper Indus River basin. Journal of Hydrology and Earth System Sciences. 17: 1503–1516
- Mantua NJ, Hare SR, Zhang Y, Wallace JM, Francis RC (1997) A pacific interdecadal climate oscillation with impacts on salmon production. Bulletin of the American Meteorological Society 78: 1069–1079
- Garen DC (1998) ENSO indicators and long-range climate forecasts: usage in seasonal streamflow volume forecasting in the western United States, Eos Trans. AGU 79: 45.
- Ho C, Kim J, Jeong J, Kim H, Chen D (2006) Variation of tropical Cyclone Activity in the South Indian Ocean: El Niño–Southern Oscillation and Madden-Julian Oscillation Effects. Journal of Geophysical Research and Atmospheres 111
- Deng X, Huang J, Fangbin Q, Naylor RL, Falcon WP, et al. (2007) Impacts of El-Nino-Southern oscillation events on China’s Rice Production. J Geogr Sci 20: 3-16
- Goro Y, Tamaki Y, Fujii Y, Matsumoto S (2009) Rapid termination of the 2006 El Niño and its relation to the Indian Ocean, Geophysical Research Letters 36: 7
- Cobb KM, Westphal N, Sayani HR, Watson JT, Lorenzo ED, et al. (2013) Highly variable El Niño–Southern oscillation throughout the Holocene. Science Journal 339: 67-70
- Sahu N, Swadhin K, Behera JV, Ratnam DS, Parhi RV, et al. (2014) El-Niño Modoki connection to extremely-low streamflow of the Paranaı´ba River in Brazil. Climate Dynamics 12: 1509-1516
- Gautam HR, Sharma HL, Kumar R, Bhardwaj ML (2014) Effect of El Niño on southwest monsoon rainfall and agriculture in India. Current Science 107.
- Deng YY, Gao T, Gao HW, Yao XH, Xie L (2014) Regional precipitation variability in East Asia related to climate and environmental factors during 1979–2012. Sci Rep 4: 5693
- Roy I, Mathews C (2015) On identifying the role of Sun and the El Niño southern oscillation on indian summer monsoon rainfall. Atmospheric Science Letters 16: 162-169
- Roy I, Tedeschi RG, Collins M (2017) Asymmetry in different types of ENSO and related teleconnection with the Indian Summer Monsoon. Int J Climatol 37: 1794–1813.
Citation: Singh G, Sharif M, Shakeel M (2017) Investigation of Linkages of El-Nino Southern Oscillation with Monsoonal Precipitation in India. J Earth Sci Clim Change 8: 426. DOI: 10.4172/2157-7617.1000426
Copyright: © 2017 Singh G, et al. This is an open-access article distributed under the terms of the Creative Commons Attribution License, which permits unrestricted use, distribution, and reproduction in any medium, provided the original author and source are credited.
Select your language of interest to view the total content in your interested language
Share This Article
Recommended Journals
Open Access Journals
Article Tools
Article Usage
- Total views: 6157
- [From(publication date): 0-2017 - Nov 12, 2025]
- Breakdown by view type
- HTML page views: 5164
- PDF downloads: 993