Joint Mean-Variance Overall Survival Time fitted Models from Stage III Non-Small Cell Lung Cancer
Received: 16-Jan-2017 / Accepted Date: 07-Feb-2017 / Published Date: 14-Feb-2017 DOI: 10.4172/2161-1165.1000296
Abstract
Objectives: The current article aims to derive the joint mean-variance fitted models for the overall survival time from stage III non-small cell lung cancer patients. In addition, it aims to identify the determinants of the overall survival time, based on 239 subjects with 23 factors / variables.
Background: Overall survival time is positive, heterogeneous, and non-normal which is generally modeled either by the Log-normal or the gamma models. Little is known about the joint mean-variance models for overall survival time from stage III non-small cell lung cancer patients.
Materials and Methods: The present article is based on the secondary data on 239 stage III non-small cell lung cancer patients along with 23 explanatory factors/ variables. The overall survival time of 239 patients is heterogeneous, positive, and gamma distributed. Therefore, statistical joint generalized linear gamma or Log-normal models are considered to analyze the overall survival time.
Results: The overall survival time (OST) of stage III non-small cell lung cancer (NSCLC) patients is higher for the never/ex-smokers (P =0.049) than for the current smokers. The OST is higher for the stage III NSCLC patients having large cell carcinoma or other (P =0.110) than the patients having adenocarcinoma or squamous cell carcinoma. It decreases (P=0.026) as the number of positive lymph node stations increases. It is higher (P=0.072) of the lung cancer patients having N-stage at level N3 or Nx than the others. It is also higher of the lung cancer patients belonging into standard concomitant (P=0.050), or standard sequential (P=0.026), or sequentialselected (P=0.003) group than the no chemo group. The OST is higher (P<0.01) of those lung cancer patients whose start of the study year are earlier. It increases (P = 0.001) as the equivalent dose increases. It decreases (P<0.01) as the overall treatment time increases. There are many more significant determinants of the variance of OST.
Conclusions: The overall survival time from stage III non-small cell lung cancer patients is identified as heterogeneous and gamma distributed. Most of the present findings, specially the variance determinants of overall survival time are completely new in the literature.
Keywords: Chemotherapy; Gamma model; Overall survival time; Stage III non-small cell lung cancer; Non-constant variance
165790Introduction
When the lung cells grow out of control, and become abnormal, lung cancer begins to start. Then more cancer cells grow, which form into a tumor, and they spread to the different parts of the body. Lung cancer is mainly two types. One is non-small cell lung cancer (NSCLC), and the other is small cell lung cancer (SCLC). There are many subtypes of NSCLC, which grow from different types of lung cells. These subtypes are grouped together as NSCLC, because their outlook and the treatment process are often similar. Approximately, 85% to 90% of lung cancers are NSCLC, andthe remaining 10% to 15% are SCLC. The treatment processes of these two types of lung cancer are different. In 2016, the approximate incidences (new cases) of lung cancer in the United States are about 224,390 (117,920 in men and 106,470 in women), and the approximate number of deaths from lung cancer are 158,080 (85,920 in men and 72,160 in women) [1].
The lung cancer death is the first position of cancer death for both male and female [2] in the United States. In Europe also, the lung cancer death holds the first position of cancer death for male, and it is third for female [3]. In Europe, the number of new incidences of lung cancer is more than 400,000 in 2012. Out of these new lung cancer incidences, approximately 30% of patients are diagnosed with NSCLC of stage III disease. The leading cause of cancer death for both men and women (one out of four cancer deaths) is the lung cancer. Every year, more people die from lung cancer than from prostate, breast, and colon cancer combined. Note that, lung cancer occurs in older people around age 65 years [1-3].
The lung cancer patients are mostly heterogeneous. The patients heterogeneity makes the treatment difficulty to choose the better treatment for an individual patient [4]. Heterogeneity is more clear from the description of tumors, and patients based on genomics, imaging modalities, and proteomics examinations. Consequently, the different treatment options such as individualized chemotherapy, new radiation therapy schemes and techniques, proton therapy, targeted agents, surgery, or a combination of these options are being used as the medical treatment process for lung cancer patients [5,6]. In practice, a decision support system (DSS) could offer assistance for making treatment decision which is currently lacking. The DSS includes different models to interpret many related outcomes for different approaches [7,8]. A building block for the DSS is a model containing the basic significant clinical variables that predicts the individual survival outcome. The model allows to identify the risk factors and dose levels for different treatments. The model gives sufficient information about the survival time to the doctors and the patients based on individual patient clinical information [9-12]. Last three decades, several studies have examined the prognostic risk or predictive factors for the lung cancer survival time [8,13-15].
Generally, the Kaplan-Meier method (a non-parametric approach) is used for analysis of univariate survival time. Cox regression is used for multivariate prediction model. Note that the Cox proportional hazard models are based on constant variance assumption. Some authors modeled continuous variables nonlinearly by using restricted cubic splines [11,12]. Some authors used simpler transformation instead of nonlinear terms. Factors are not properly modeled in any case of Cox regression or nonlinear models. It is noted that the overall survival times are heterogeneous, positive, and non-normally distributed. So, it is modeled either by the Log-normal or the gamma joint generalized model. To the best of our knowledge, any article has not considered the analysis of overall survival time [16] using the joint mean-variance models. These issues have motivated us to undertake the present study.
The present article aims to identify the determinants of the overall survival time of 239 lung cancer patients with 23 covariates (all are non-missing information). The current article has the following hypotheses or queries: What are the determinants of the overall survival time of the 239 lung cancer patients? What are the effects of the determinants on the overall survival time? These hypotheses are examined in the current report based on the data set of 239 lung cancer subjects along with 23 factors/variables [16].
Materials and statistical methodology
Materials
The present article has considered 239 lung cancer patients with 23 factors or variables. The current secondary data set has been taken from the report [16]. The data set can be downloaded at https:// www.cancerdata.org/10.1016/j.ijrobp.2015.02.048. The description of the covariates, factors and their levels are described in Table 1. The summarized statistics such as the mean, standard deviation, and proportion of the levels are given in Table 1. A detailed discussion about the patients population and data collection methods are given in [16]. In the report [16], there are 548 patients with many missing information on the 23 factors /variable. We have considered only 239 patients (from 548 patients) with all non-missing information on the 23 factors/ variables. The description of the patient population and the data collection method is not reproduced herein as the length of the paper will be increased.
| Variable name | Operationalization | Mean (standard deviation)/ Proportion |
| Gender | Gender: (Male=1 ; Female=2) | 1%=73.1; 2%=26.9 |
| Age | Age at study | 65.56 (9.40) |
| WHO-PS (who3g) | World health organization performance status or measure (WHO-PS) levels are 1,2,3. | 1%=42.43; 2%=45.80; 3%=11.77 |
| Bmi | bmipatient pre RT: Body mass index of patient at pre radiation therapy | 25.09 (4.14) |
| fev1pc | Forced expiratory volume in 1 second. percentage of predicted pre RT | 77.20 (21.10) |
| Smok2 | Never/ex smoker=1; Current smoker=2. | 1%=64.28; 2%=35.72 |
| T_ct_loc | CT-scan: Locations of tumor, 19 locations are: right lowerlobe (1); right middlelobe (2); right hilus (3); right upperlobe (4); leftlowerlobe (5); leftupperlobe (6); lefthilus (7); mediastinum (8); notapplicable (9); lingula (10); upperlobe, unspecified (11); lowerlobe, unspecified (12); lung,trachea (13); lung, trachea left (14); lung,trachea, right (15); LUL+LLL (16); right bronchus (17); left bronchus (18); multiple lobes (19) | 4.22 (1.13) Attribute character, but treated as discrete variable |
| Histology (hist4g) | Histology: (Adenocarcinoma=1 ; Squamous Cell Carcinoma=2, Large cell carcinoma=3, other=4) | 1%=32.35; 2%=15.96; 3%=39.07; 4%=12.62 |
| PLNS(countpet_all6g | Probably this is PLNS variable that means number of positive lymph node stations | 3.13 (1.21) |
| countpet_mediast6g | None | 2.77 (1.03) |
| T-stage | T-stage (combined 6th or 7th edition): (T0-1=1; T2=2; T3=3; T4 or Tx=4) | 1%=13.02; 2%=36.13; 3%=9.66; 4%=41.19 |
| N-stage | N-stage (combined 6th or 7th edition): (N0 = 1; N1 = 2; N2 = 3; N3 or Nx = 4) | 1%=17.22; 2%=2.10; 3%=49.15; 4%= 31.53 |
| S-stage | Clinical overall stage : Levels : (IIIA=1; IIIB=2) | 1%=31.93; 2%= 68.07 |
| Timing | Chemotherapy: Level : (No chemo=1; Sequential=2 , Concurrent=3). | 1%=32.35; 2%=;15.96 3%= 39.07 |
| Group | Group: (no chemo=1; sequentialselected=2; standard sequential=3; standard concomitant=4) | 1%=10.50; 2%=6.72; 3%=47.90; 4%=34.88 |
| Yearrt | Start of study | 2006 (2.32) |
| equivalent-dose (Eqd) | Equivalent radiation dose (corrected for fraction size) at 2 Gray (Gray (Gy) is the SI unit of absorbed dose. One gray is equal to an absorbed dose of 1 Joule/ kilogram (100 rads).) | 59.69 (7.22) |
| treatment time (Ott) | Overall treatment time | 30.10 (8.50) |
| gtv1 | Gross tumor volume | 89.24 (97.83) |
| Tumorload_total | None | 123.45 (105.52) |
| Survmonth | Survival time in months | 26.77 (23.36) |
| Survyear | Survival time in years | 2.23 (1.95) |
| Deadstat | Dead/alive: (alive=1; dead=2) | 1%=84.45; 2%=15.55 |
Table 1: Operationalization of variables in the analysis & summarized statistics.
The current data contains 11 continuous variables and 12 attribute characters. The description of each variable or attribute character, attribute levels, and how they are operationalized in the present report is displayed in Table 1. Here we have considered the overall survival time as the dependent variable, and the remaining others are treated as the independent or explanatory variables. The overall survival times are determined as the duration between the start of radiation therapy and the date of death. The censored survival times are determined as the right-censored if the patients are alive at the end point of recorded time. The right-censored survival times are converted into estimated overall survival times based on model fitting.
Statistical methods: The classical linear regression models assume that the response (Y) variance is constant over the entire range of parameter values. However, it is not always true [17]. Generally, physiological data are heterogeneous. For example, the overall survival times for the lung cancer patients are heterogeneous [16]. To stabilize the heterosecedasticity of a data set, the log-transformation is often recommended, but in practice the variance may not always be stabilized (Table 2) [17].
| Model | Gamma model fit | Log-normal model fit | |||||||
| Mean | Covariate | Estimate | Standard error | t-value | P-value | Estimate | Standard error | t-value | P-value |
| Constant | 285.91 | 54.851 | 5.212 | <0.01 | 294.11 | 55.512 | 5.298 | <0.01 | |
| Smok2 | -0.1 | 0.053 | -1.976 | 0.049 | -0.11 | 0.054 | -2.073 | 0.039 | |
| Histology2 | -0.01 | 0.084 | -0.137 | 0.891 | -0.01 | 0.085 | -0.063 | 0.95 | |
| Histology3 | 0.09 | 0.062 | 1.504 | 0.134 | 0.11 | 0.062 | 1.698 | 0.091 | |
| Histology4 | 0.12 | 0.075 | 1.605 | 0.11 | 0.15 | 0.078 | 1.957 | 0.052 | |
| PLNS | -0.06 | 0.026 | -2.242 | 0.026 | -0.06 | 0.027 | -2.409 | 0.017 | |
| N-stage2 | -0.07 | 0.159 | -0.461 | 0.645 | -0.08 | 0.128 | -0.636 | 0.525 | |
| N-stage3 | 0.02 | 0.072 | 0.311 | 0.756 | -0.01 | 0.073 | -0.071 | 0.943 | |
| N-stage4 | 0.21 | 0.116 | 1.808 | 0.072 | 0.22 | 0.117 | 1.861 | 0.064 | |
| Group2 | 0.43 | 0.218 | 1.968 | 0.05 | 0.46 | 0.234 | 1.951 | 0.052 | |
| Group3 | 0.4 | 0.178 | 2.245 | 0.026 | 0.37 | 0.191 | 1.956 | 0.052 | |
| Group4 | 0.6 | 0.2 | 2.986 | 0.003 | 0.62 | 0.213 | 2.885 | 0.004 | |
| Yearrt | -0.14 | 0.027 | -5.145 | <0.01 | -0.14 | 0.028 | -5.231 | <0.01 | |
| Equivalent dose (Eqd) | 0.02 | 0.005 | 3.219 | 0.001 | 0.02 | 0.005 | 3.001 | 0.003 | |
| treatment time | -0.02 | 0.006 | -4.023 | <0.01 | -0.02 | 0.006 | -3.788 | <0.01 | |
| Deadstat | -1.19 | 0.069 | -17.247 | <0.01 | -1.47 | 0.071 | -20.792 | <0.01 | |
| Variance | Constant | -4.92 | 1.308 | -3.76 | <0.01 | -5.718 | 1.343 | -4.257 | <0.01 |
| Age | 0.011 | 0.012 | 0.847 | 0.398 | 0.022 | 0.013 | 1.725 | 0.085 | |
| WHO-PS2 | 0.384 | 0.233 | 1.649 | 0.101 | 0.472 | 0.237 | 1.994 | 0.047 | |
| WHO-PS3 | 0.103 | 0.332 | 0.311 | 0.756 | 0.035 | 0.338 | 0.103 | 0.918 | |
| Bmi | 0.032 | 0.025 | 1.287 | 0.199 | 0.042 | 0.026 | 1.623 | 0.106 | |
| fev1pc | -0.002 | 0.006 | -0.423 | 0.673 | -0.003 | 0.006 | -0.581 | 0.562 | |
| Histology2 | 0.054 | 0.336 | 0.161 | 0.872 | 0.183 | 0.345 | 0.531 | 0.596 | |
| Histology3 | -0.109 | 0.261 | -0.419 | 0.676 | -0.074 | 0.263 | -0.283 | 0.777 | |
| Histology4 | -0.411 | 0.377 | -1.091 | 0.276 | -0.331 | 0.374 | -0.885 | 0.377 | |
| T-stage2 | -0.377 | 0.341 | -1.107 | 0.269 | -0.403 | 0.357 | -1.128 | 0.26 | |
| T-stage3 | -0.293 | 0.464 | -0.63 | 0.529 | -0.547 | 0.484 | -1.129 | 0.26 | |
| T-stage4 | -0.533 | 0.35 | -1.522 | 0.129 | -0.564 | 0.362 | -1.558 | 0.121 | |
| N-stage2 | 0.029 | 0.852 | 0.034 | 0.973 | -0.366 | 0.895 | -0.409 | 0.683 | |
| N-stage3 | 0.511 | 0.311 | 1.64 | 0.102 | 0.571 | 0.321 | 1.778 | 0.077 | |
| N-stage4 | 0.266 | 0.399 | 0.668 | 0.505 | 0.319 | 0.403 | 0.792 | 0.429 | |
| Deadstat | 3.001 | 0.388 | 7.731 | <0.01 | 3.004 | 0.423 | 7.094 | <0.01 | |
| AIC | 1829.86 | 1835 | |||||||
Table 2: Results for mean and variance models of overall survival time from gamma and Log-normal fits.
For the analysis of positive observations with constant variance or constant coefficient of variation, the linear regression models with multiplicative error estimation is performed based on either the gamma or the Log-normal models [18]. However, for the physiological data analysis, neither the variance nor the coefficient of variation needs to be constant, so that these two models do not necessarily give identical results [19-21]. Note that the generalized linear models class includes the distributions which are used in modeling some continuous, non-normal, positive, and heteroscedastic data sets. In the generalized linear models class, the variance of the response may have the relationship with its mean. Then the response variance may be non-constant. In order to analyze the heteroscedastic positive data Yi ‘s, when
the log transformation Zi=log(Yi) gives stabilization of variance Var(Zi)≈. However, if a parsimonious model is essential, an improved transformation is required. In practice, a simple data transformation may not meet all the required model assumptions [17]. Under that situations, Nelder and Lee [22] have advocated to apply the JGLMs for the mean and variance as follows.Generally, the log transformation Zi=logYi is used for the positive response Yi. For the log-normal distribution, a joint modeling of the mean and variance is such that

where: xi t and gi t are respectively, the row vectors related with the mean regression coefficients β and the variance regression coefficients γ.
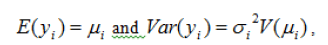
For the positive responses yi ‘s, if
Where: ’s are the dispersion parameters and V( ) is the variance function. The variance consists of two components in GLMs. One part is which depends on the mean changes, and the other is which is the independent of mean adjustment. Note that, in GLMs, the variance function characterizes the family of distribution. For example, the distribution is Poisson if V()=, gamma if V()=, normal if V()=1, etc.
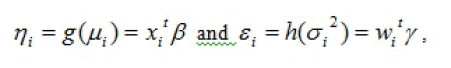
The JGLMs for the mean and the variance parameters are
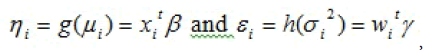
where and are the GLM link functions for the mean and the variance, respectively; and , are respectively, the row vectors for the mean and dispersion regression models with known variables or factors. The mean model parameters are estimated by the maximum likelihood (ML) method, and the restricted ML (REML) method is used for estimating the variance model parameters [19,23].
The considered response overall survival time is positive, heteroscedastic and belong to exponential family distribution. So, it should be modeled either by the gamma or the Log-normal models [19,23-25]. What are the appropriate models of overall survival time of lung cancer patients? What are the determinants of overall survival time? What are effects of the determinants on the overall survival time? These issues are focused in the following sections.
Overall survival time analysis and interpretations Analysis
The dependent variable in the present analysis is the survival time which is a continuous random variable. There are remaining 10 continuous, and 12 attribute explanatory variables. For attribute characters or factors, it is accepted the constraint that the effects of the first levels are zero. Therefore, we have taken the first level of each attribute character or factor as the reference level by estimating its as zero. Let ai for i = 1,2,3 be the main effect of A. We have taken â1 = 0, so that â2 = â2 -- â1. For example, the difference between the second and the first levels in the main effect A, (i.e., â2 -- â1) is the estimate for the effect A2.
In the present section, we have considered the survival time as the response or dependent variable, and the remaining others as the independent (or explanatory) factors or variables. Note that most of the survival times are overall, and some are the right censored survival time. The response overall survival time (overall survival time and the estimated overall survival time of the right-censored survival time) has been modeled based on both the gamma and the Log-normal models [19,23].
Based on the smallest Akaike information criterion (AIC) value in each class, the final fitted models have been selected. Note that the AIC selects a model which minimizes the predicted additive errors and squared error loss [26]. Both the fitted models results are displayed in Table 2.
From Table 2, it is clear that the gamma fitted models (AIC=1829.860) give better results than the Log-normal fitted models (AIC=1835). Some statistical insignificant independent factors and variables are included in both the mean and variance fitted models (Table 2) for better fitting [26]. The included statistical insignificant factors or variables in the fitted models are known as confounder in epidemiology. In Figure 1, the JGLMs diagnostic plots have been examined for the gamma fitted models (Table 2).

Figure 1(a,b): For the fitted gamma models of overall survival time (Table 2), the (a) absolute residuals plot with respect to fitted values, and the (b) normal probability plot of the mean model.
In Figure 1(a), the absolute gamma fitted residual values are plotted with respect to fitted values (Table 2). Residuals plot (Figure 1(a)) is completely a flat diagram, indicating that the variance is constant with the running means. Figure 1(b) reveals the normal probability plot for the gamma fitted mean model (Table 2). It does not show any systematic departure or lack of fit with respect to fitted model, or response distribution, or variables, or outliers.
Results and interpretations of overall survival time analysis
Table 2 presents the summarized results of the overall survival time analysis. The detailed results and interpretations of Table 2 (gamma or Log-normal fitted models) are described as follows. Here we have considered the P-values up to approximately 10% level as significant, and more than 10% to approximately 20% as partially significant.
*The mean overall survival time (OST) is negatively significantly associated with the smoking status (never/ex smoker=1, current smoker=2) (P=0.049). This implies that the mean OST increases as the smoking status decreases. Therefore, the mean OST is higher for the never/ex-smoker lung cancer patients than the current smokers.
*In the gamma fitted model, the mean OST is positively partially associated with the histology [adenocarcinoma=1, squamous cell carcinoma=2, large cell carcinoma=3, other=4] at level 3 (i.e., large cell carcinoma=3) (P=0.134), and at level 4 (other=4) (P=0.110). But in the Log-normal fitted model, the mean OST is positively significantly associated with the histology at level 3 (i.e., large cell carcinoma=3) (P=0.091), and at level 4 (other=4) (P=0.052). This indicates that the mean OST is higher of the lung cancer patients having large cell carcinoma or other than the patients having adenocarcinoma or squamous cell carcinoma.
*The mean OST is negatively significantly associated with the PLNS (countpet_all6g) (i.e., PLNS variable that means the number of positive lymph node stations) (P=0.026), indicating that as the number of positive lymph node stations increases, the OST decreases. It is observed in practice.
*The mean OST is positively significantly associated with the Nstage (N0=1; N1=2; N2=3; N3 or Nx=4) at level 4 (i.e., at N3 or Nx) (P=0.072), indicating that the OST is higher of the lung cancer patients having N-stage at level N3 or Nx than the others.
*The mean OST is positively significantly associated with the group (no chemo=1, sequentialselected=2, standard sequential=3, standard concomitant=4) at level 2 (i.e., sequentialselected=2) (P=0.050), at level 3 (i.e., standard sequential=3) (P=0.026), and at level 4 (standard concomitant=4) (P=0.003). This indicates that the OST increases as the group level increases. Therefore, the mean OST is higher of the lung cancer patients belonging into standard concomitant, or standard sequential, or sequentialselected group than the no chemo group.
*The mean OST is negatively significantly associated with the start of study year (P<0.01). It implies that the OST is higher of those lung cancer patients whose start of the study year are earlier.
*The mean OST is positively significantly associated with the equivalent dose (P=0.001), indicating that the OST increases as the equivalent dose increases.
*The mean OST is negatively significantly associated with the overall treatment time (P<0.01), indicating that the OST increases as the overall treatment time decreases.
*The mean OST is negatively significantly associated with the deadstat (alive=1, dead=2) (P<0.01), indicating that the OST is higher of the living lung cancer patients than the dead patients.
*The variance of OST is positively significantly associated with the age (P=0.086) (in the Log-normal fitted model), indicating that the OST variance of the lung cancer patients increases as the age increases. That is the OST variance of the lung cancer patients is highly scattered at the older ages than the younger ages. Note that it is insignificant in the gamma fitted model.
*The OST variance is positively significantly associated with the who3g (World helth organization performance measure levels are 1,2,3) at level 2 (P=0.047) (in the Log-normal fitted model), indicating that the OST variance of the lung cancer patients is higher who are at level 2, than the other levels. Note that it is insignificant in the gamma fitted model.
*The OST variance is positively partially associated with the body mass index (P=0.106) (in the Log-normal fitted model), indicating that the OST variance of the lung cancer patients increases as the body mass index increases. It is partially significant in the gamma fitted model.
*The OST variance is negatively partially associated with the T-stage (T0-1=1; T2=2; T3=3; T4 or Tx=4) at level 4 (i.e., at T4 or Tx) (P=0.121) (in the Log-normal fitted model), indicating that the OST variance of the lung cancer patients is higher who are at level T4 or Tx, than the others.
*The OST variance is positively significantly associated with the Nstage (N0=1; N1=2; N2=3; N3 or Nx=4) at level 3 (i.e., N2) (P=0.077) (in the Log-normal fitted model), indicating that the OST variance of the lung cancer patients is higher who are at level N2, than the others. It is positively partially significant in the gamma fitted model.
*The OST variance is positively significantly associated with the deadstat (alive=1, dead=2) (P<0.01), indicating that the OST variance of the lung cancer patients is higher who died than the living patients.
From Table 2, the final selected gamma fitted mean and variance models of the overall survival time of stage III non-small cell lung cancer patients (x21), respectively, are
 =exp (285.91-0.10) Smok 2-0.01 Histology 2+0.09 Histology 3+0.12 Histology 4-0.06 PLNS-0.07 N-stage 2+0.02 N-stage 3+0.21 Nstage 4+0.43 Group 2+0.40 Group 3+0.60 Group 4–0.14 Yearrt+0.02
Eqd–0.02 Ott–1.19 Deadstat), and  =exp (-4.920+0.011 age +0.384 WHO-PS2 + 0.103 WHO-PS3+0.032 Bmi-0.002 fev1pc+0.054 Histology 2–0.109 Histology 3–0.411 Histology 4–0.377 T-stage 2– 0.293 T-stage 3–0.533 T-stage 4+0.029 N-stage 2+0.511 N-stage 3+0.266 N-stage 4+3.001 Deadstat).
In Table 2, the fitted two models (gamma and Log-normal) approximately reveal the identical results. We have considered the significant determinants from both the fitted models. These two fitted models confirm the current findings.
Conclusions and Discussions
The current article has considered the overall survival time (OST) as the response variable. The estimated overall survival times are obtained from the right-censored survival time, using the fitted model of only the overall survival times. Finally, both the overall survival time and the estimated overall survival time are considered together as the overall survival time, which has been modeled based on both the Lognormal and the gamma models. Both the fitted model results are displayed in Table 2. Note that, both the fitted models reveal exactly or approximately the same interpretations. The determinants of the overall survival time have been considered in the present report based on both the fitted models.
The analysis of the whole part of the present data (548 subjects, with some missing information) is given in [16]. The present report has considered 239 subjects [16] with all non-missing information. The results of the present report are not identical with the earlier results [16]. For example, the present report has not identified that the sex is a significant determinant of the OST (Table 2), but it is significant in [16]. Regarding sex, the present report supports the results in [27], but it disagrees the results in [16,28,29]. The World health organization performance status (WHO-PS or Who3g) (at level 2) is identified here (Table 2) only as a significant determinant of the variance of OST, but it is identified as the significant determinant of the mean of OST [16,30,31]. Note that these articles [16,30,31] do not consider the variance modeling. Smoking status, histology, N-stage are significant determinants of the mean of OST in the present report (Table 2), but they are not identified in [16]. It is identified herein that the current smoking status decreases the overall survival time which supports some earlier findings [32,33].
The number of positive lymph node stations (PLNS) is negatively significantly associated with the mean of OST, in the present report (Table 2), but it is positively significantly associated in [16]. Therefore, the interpretation of PLNS in [16] indicates that the OST increases as the number of positive lymph node stations increases, which contradicts the clinician views. But the present report supports the clinician views. In the earlier articles [34,35], it has been pointed that PLANS on F-fluorodeoxyglucose positron emission tomography (FDG-PET) scan is an important risk factor for non-surgically treated patients.
The present report has identified that the group, start of study, and dead status as the significant determinants of the mean OST (Table 2), but these are not reported in [16]. Here the overall treatment time is negatively significantly associated with the mean OST (Table 2), but it is positively associated in [16]. The present result disagrees with the result in [16], but it agrees with the results, which have pointed that from a radiological point of views, shorter treatment (less than 28 days) can improve the mean OST of NSCLC patients [36,37]. It is also pointed in the earlier studies that a decrease in tumor control approximately 1.6% per day after a 6-week duration of radiation therapy, and approximately 2.0% increase in the risk of death for each day of prolongation in therapy [38]. Therefore, the present studies supports most of the earlier results regarding the overall treatment time.
Equivalent dose is negatively associated with the OST in [16], indicating that the OST increases as the equivalent dose decreases, which also contradicts the clinician views [5,6]. But in the present report, equivalent dose is positively associated with the mean OST, which supports the clinician views [5,6]. It is reported in the earlier studies that the higher radiation doses lead to improved local control and higher survival rates [5,6].
It is well-known that the smoking is one of the principal risk factor of the lung cancer, which is not identified in [16]. The OST variance determinants such as age, WHO-PS, body mass index, forced expiratory volume, histology, T-stage, N-stage, dead status (Table 2) are reported in the present report, but these not reported in any earlier lung cancer article. To the best of our knowledge, most of the present findings, specially variance of OST determinants (Table 2) are completely new in the lung cancer literature.
The current reported results (Table 2), though not completely conclusive, are revealing.The determinants of the overall survival time are derived satisfying the following regression analysis criteria. First, the determinants are selected based on comparison of both the gamma and the Log-normal fitted model analyses. Second, the final model is selected based on AIC. Third, final model is justified based on JGLMs diagnostic plots. Fourth, the standard error of the estimates are very small, indicating that the estimates are stable [23]. Fifth, the final model of the OST is selected based on locating the appropriate statistical distribution. The OST distribution is identified herein as the gamma distribution.
The present results (Table 2) attempt to remove some conflicts of earlier research findings, and they also confirm some earlier reported results [16,27-38]. These has been shortly described above. It can be observed on comparison of the present results (Table 2) with the earlier results [16,27-38]. An important conclusion has to do with the use of earlier used statistical models. While further research is called for, we find that the JGLMs are much more effective than the Cox proportional regression analysis, because they better fit the data. In short, research should have greater faith in these results than those emanating from the earlier models.
To the best of our knowledge, the present models (Results and interpretation section) can be considered as one of the best first building block of a DSS. The current models may provide better assistance for treatment decision making using the individual patient risk factors and the benefits of a specific treatment. The current results have focused many interesting conclusions. These findings may help the medical practitioners for better medical treatment. Equivalent dose, and chemotherapy are highly important for medical treatment of the lung cancer patients. Smoking should be stopped. Every one should care on his/her obesity. For both male and female individual, care should be taken on lung cancer disease at older ages.
References
- Siegel R, Ma J, Zou Z, Jemal A (2014) Cancer statistics, 2014. CA Cancer J Clin 64: 9-29.
- Ferlay J, Steliarova-Foucher E, Lortet-Tieulent J,Rosso S, Coebergh JWW, et al. (2013) Cancer incidence and mortality patterns in Europe: Estimates for 40 countries in 2012. Eur J Cancer49: 1374-1403.
- Vansteenkiste J, De Ruysscher D, Eberhardt WE, Lim E, Senan S, et al. (2013) Early and locally advanced non-small-cell lung cancer (NSCLC): ESMO Clinical Practice Guidelines for diagnosis, treatment and follow-up. Ann Oncol 24 Suppl 6: vi89-98.
- van Baardwijk A, Wanders S, Boersma L, Borger J, Ollers M, et al. (2010) Mature results of an individualized radiation dose prescription study based on normal tissue constraints in stages I to III non-small-cell lung cancer. J ClinOncol 28: 1380-1386.
- van Baardwijk A, Boersma LJ, Ruysscher DD, Wanders S, et al. (2012) Mature results of a phase II trial on individualised accelerated radiotherapy based on normal tissue constraints in concurrent chemo-radiation for stage III non-small cell lung cancer. Eur J Cancer48:2339-2346.
- Lambin P, van Stiphout RG, Starmans MH, Rios-Velazquez E, Nalbantov G, et al. (2013) Predicting outcomes in radiation oncology--multifactorial decision support systems. Nat Rev ClinOncol 10: 27-40.
- Berghmans T, Paesmans M, Sculier JP (2011) Prognostic factors in stage III non-small cell lung cancer: a review of conventional, metabolic and new biological variables. TherAdv Med Oncol 3: 127-138.
- Fowler JF (2001) Biological factors influencing optimum fractionation in radiation therapy. ActaOncol 40: 712-717.
- Steyerberg EW (2009) Clinical Prediction Models. New York, NY: Springer New York.
- Harrell FE Jr (2001) Regression Modeling Strategies. New York: Springer-Verlag.
- Akaike H (1974) A new look at the statistical model identification. IEEE Trans Automat Contr 19: 716-723.
- Burnham KP, Anderson DR (2002) Model Selection and Multimodel Inference. New York: Springer Science & Business Media.
- Uyterlinde W, Belderbos J, Baas C, WerkhovenEv, Knegjens J, et al. (2013) Prediction of acute toxicity grade 3 in patients with locally advanced non-small cell lung cancer receiving intensity modulated radiotherapy and concurrent low-dose cisplatin. Clin Lung Cancer14:541-548.
- Solan MJ1, Werner-Wasik M (2003) Prognostic factors in non-small cell lung cancer. SeminSurgOncol 21: 64-73.
- Oberije C, Ruysscher DD, Houben R, Heuvel M van de, Uyterlinde W, et al. (2015) A validated prediction model for overall survival from stage III non-small cell lung cancer: Toward survival prediction for individual patients. Int. J. Radiation OncolBiolPhys 92:935-944.
- Myers RH, Montgomery DC, Vining GG (2002) Generalized Linear Models with Applications in Engineering and the Sciences. New York, John Wiley & Sons.
- Firth D (1988) Multiplicative errors: log-normal or gamma? J. R. Statist. Soc. B 50:266-268.
- Das RN, Lee Y (2009) Log-normal versus gamma models for analyzing data from quality improvement experiments. Quality Engineering 21: 79-87.
- Das RN, Park JS (2012) Discrepancy in regression estimates between Log-normal and Gamma: Some case studies. Journal of Applied Statistics 39: 97-111.
- Das RN (2012) Discrepancy in fitting between log-normal and gamma models: An illustration. Model Assisted Statistics and Applications 7: 23-32.
- Nelder JA, Lee Y (1991) Generalized linear models for the analysis of Taguchi-type experiments. Applied Stochastic Models and Data Analysis 7:107-120.
- Lee Y, Nelder JA, Pawitan Y (2006) Generalized Linear Models with Random Effects: Unified Analysis via H-likelihood.Chapman & Hall, London.
- Das RN (2014) Robust Response Surfaces, Regression, and Positive Data Analyses. Chapman & Hall, London.
- Qu Y, Tan M, Rybicki L (2000) A unified approach to estimating association measures via a joint generalized linear model for paired binary data. Comm. Statist. Theory Methods 29: 143-156.
- Hastie T, Tibshirani R, Friedman J (2001) The Elements of Statistical Learning. Springer- Verlag, New York.
- Werner-Wasik M, Scott C, Cox JD,Sause WT, Byhardt RW, et al. (2000) Recursive partitioning analysis of 1999 Radiation Therapy Oncology Group (RTOG) patients with locally-advanced non-small-cell lung cancer (LA-NSCLC): Identification of five groups with different survival. Int J RadiatOncolBiolPhys48:1475-1482.
- Pfister DG, Johnson DH, Azzoli CG, Sause W, Smith TJ, et al. (2004) American Society of Clinical Oncology treatment of unresectable non-small-cell lung cancer guideline: update 2003. J ClinOncol 22: 330-353.
- Blanchon F, Grivaux M, Asselain B, Lebas FX, Orlando JP, et al. (2006) 4-year mortality in patients with non-small-cell lung cancer: development and validation of a prognostic index. Lancet Oncol 7: 829-836.
- Brundage MD, Davies D, Mackillop WJ (2002) Prognostic factors in non-small cell lung cancer: a decade of progress. Chest 122: 1037-1057.
- Solan MJ, Werner-Wasik M (2003) Prognostic factors in non-small cell lung cancer. SeminSurgOncol 21: 64-73.
- Peto R, Darby S, Deo H, Silcocks P, Whitley E, et al. (2000) Smoking, smoking cessation, and lung cancer in the UK since 1950: combination of national statistics with two case-control studies. BMJ 321: 323-329.
- Bolliger CT, ZellwegerJeanÂPierre, Danielsson T, Biljon X van, Robidou A, et al. (2000) Smoking reduction with oral nicotine inhalers: double blind, randomised clinical trial of efficacy and safety. BMJ321:329-333.
- Dehing-Oberije C, Yu S, De Ruysscher D, Meersschout S, Van Beek K, et al. (2009) Development and external validation of prognostic model for 2-year survival of non-small-cell lung cancer patients treated with chemoradiotherapy. Int J RadiatOncolBiolPhys 74: 355-362.
- Dehing-Oberije C, De Ruysscher D, van der Weide H, Hochstenbag M, Bootsma G, et al. Â (2008) Tumor volume combined with number of positive lymph node stations is a more important prognostic factor than TNM stage for survival of nonsmall-cell lung cancer patients treated with (chemo)radiotherapy. Int J RadiatOncolBiolPhys70:1039-1044.
- Baumann M, Herrmann T, Koch R (2011) Final results of the randomized phase III CHARTWEL-trial (ARO 97-1) comparing hyperfractionated-accelerated versus conventionally fractionated radiotherapy in non-small cell lung cancer (NSCLC). RadiotherOncol100:76-85.
- Uitterhoeve AL, Belderbos JS, Koolen MG, van der Vaart PJ, Rodrigus PT, et al. (2000) Toxicity of highdose radiotherapy combined with daily cisplatin in non-small cell lung cancer: Results of the EORTC 08912 phase I/II study. European Organization for Research and Treatment of Cancer. Eur J Cancer36:592-600.
- Machtay M, Hsu C, Komaki R, SauseWT, Swann SR, et al. (2005) Effect of overall treatment time on outcomes after concurrent chemoradiation for locally advanced non-small cell lung carcinoma: Analysis of the Radiation Therapy Oncology Group (RTOG) experience. Int J RadiatOncolBiolPhys63:667-671.
Citation: Das RB, Mukherjee S (2017) Joint Mean-Variance Overall Survival Time fitted Models from Stage III Non-Small Cell Lung Cancer. Epidemiology (Sunnyvale) 7:296. DOI: 10.4172/2161-1165.1000296
Copyright: © 2017 Das and Mukherjee. This is an open-access article distributed under the terms of the Creative Commons Attribution License, which permits unrestricted use, distribution, and reproduction in any medium, provided the original author and source are credited.
Select your language of interest to view the total content in your interested language
Share This Article
Recommended Journals
Open Access Journals
Article Tools
Article Usage
- Total views: 4202
- [From(publication date): 0-2017 - Aug 19, 2025]
- Breakdown by view type
- HTML page views: 3286
- PDF downloads: 916