Research Article Open Access
Lidar Station of the St. Petersburg State University. Day Variations of Aerosol, Wind, and Meteorological Parameters in the Atmosphere Above St. Petersburg, Russia
Maxim S*, Irina M and Dmitriy S
St. Petersburg State University, Resources Center, Observatory of Environmental Safety, Universitetskaya Nab, Russian Federation
- *Corresponding Author:
- Maxim S
St. Petersburg State University, Resources Center
Observatory of Environmental Safety, Universitetskaya Nab
7/9, St. Petersburg, 199034 Russian Federation
Tel: 78123282000
Fax: 7812428 6744
E-mail: M.Sapunov@spbu.ru
Received Date: November 14, 2016; Accepted Date: January 31, 2017; Published Date: February 08, 2017
Citation: Maxim S, Irina M, Dmitriy S (2017) Lidar Station of the St. Petersburg State University. Day Variations of Aerosol, Wind, and Meteorological Parameters in the Atmosphere Above St. Petersburg, Russia. J Earth Sci Clim Change 8:386. doi: 10.4172/2157-7617.1000386
Copyright: © 2017 Maxim S, et al. This is an open-access article distributed under the terms of the Creative Commons Attribution License, which permits unrestricted use, distribution, and reproduction in any medium, provided the original author and source are credited.
Visit for more related articles at Journal of Earth Science & Climatic Change
Abstract
Lidar sounding of atmospheric aerosols in the atmosphere above the big city is used for the air pollution monitoring and constructing optical models of the atmosphere. The four periods during the day are studied. The microphysical properties of aerosol particles are retrieved: vertical profiles of the mean particle size, particle size distribution, real and imagine parts of the refractive index, numerical and volume concentrations. Results of lidar sounding are compared with data of AERONET stations situated near St. Petersburg. Because lidar and AERONET observations are accomplished in clear sky conditions, the nearest dates are chosen for consideration. Optical models for 4 day periods are taken for radiative calculation: reflected and transmitted hemispherical fluxes, radiative divergence, radiative forcings and heating rates are calculated. The day variations of the radiative characteristics are analyzed and transmitted flux is compared with AERONET observations. The vertical profiles of meteorological parameters are taken from radiosounding upperair observation in St. Petersburg suburb Voeikovo and demonstrated in the article. The meteorological parameters impact to the air pollution is considered. Wind characteristics (horizontal and vertical velocity components and direction) are observed with wind lidar and compared with radiosounding upper-air observation. The day variation of aerosols parameters, wind characteristics, and temperature profiles are elucidated. Difference in composition and concentration of aerosols particles is revealed during a day.
Keywords
Environmental safety; Extinction and backscatter coefficients; Lidar sounding of the atmosphere; Laser system
Introduction
The solution of the ecological tasks at a regional level requires the building of the network of environmental safety stations [1]. which basis is environmental safety observatories, where environmental monitoring methods intended for appliance in the stations network, as well as for real-time registration of the transboundary atmospheric transfer of pollutants are worked out and developed.
The establishment of the Observatory of ecological safety of St. Petersburg state University was due to the need of development of research, creation of new techniques, the elaboration of advanced algorithms for regular monitoring of atmospheric pollution in the city with the use of high-tech instruments. Equipping the Observatory with laser systems not only provides environmental monitoring, but also the functioning of the laser station in the framework of the European Aerosol Research Lidar Network (EARLINET). The Station associated in EARLINET in April 2014, is performing calibration and accomplishing observations according to the network schedule.
The main objectives of the Center are as follows:
1. Formation of models of the influence on the environment of potentially hazardous industries and large-scale construction works;
2. Estimation of transboundary transport of atmospheric pollutants;
3. Creation of forecast models of the development of an unfavorable situation in the environment and techniques for the assessment of possible economic damage;
4. Preparation of the situational synthesized maps of suspected areas and sites of occurrence of threats to environmental safety with the assessment of the state of environmental safety of high ecological risk areas and sites;
Because the lidar station of the SPbSU is now part of the European lidar network (EARLINET), the EARLINET networking enables the use of the information provided by lidar monitoring stations for modeling the transboundary pollution transport over Europe. The data from atmospheric measurements performed by means of the laser systems will present interest for solution of not only ecological problems, but also the problems of atmospheric physics and meteorology. The signal received can be processed by other techniques to provide the vertical profiles of the meteorological parameters, the concentrations of trace gases, aerosol layers in the atmosphere, etc.
Another important task accomplished by the SPbSU Resource Center is the development of training programs, including lecture courses and laboratory workshop to provide students with the skills they need to operate modern remote sensing facilities.
Material and Methods
Determination of aerosol scattering optical parameters from the lidar sounding data
Stationary and mobile multiwave lidar systems provide information on the concentration and physical nature of atmospheric aerosol, chemical composition of the gas phase of the atmosphere, wind, and turbulence in troposphere for vertical and slant paths in all directions [2,3]. The lidar system includes components and state of the art technology, available from both Russian and foreign manufacturers, and allows remote sensing over a broad wavelength range.
Laser pulses of ~10 nsec duration, propagating in the atmosphere, interact with its various components and undergo partial backscattering to the receiver. The backscattered signals from the pulse beam, emitted by laser into the atmosphere, are collected by the telescope, and sent to the appropriate receiver. The received signal is transmitted to the control computer, where it is processed in real time mode. The computer provides the primary processing of raw signal (background exposure accounting, smoothing over a group of pulses). Time scanning of the signal provides information on the points in space along the lidar beam propagation path. The characteristic times of lidar sounding are comparable with the atmospheric variability times, so lidars provide synchronous data on aerosol and gas phases.
Further step consist in solving the inverse problem of lidar sensing, and the retrieval of the concentrations of the substances detected [2,3]. To this end, special algorithms were developed for the solution of the entire set of inversions, which use different methods and approaches to the regularization of solutions for the different components monitored [4]. The output appears as both the smoothed lidar backscattered signal, and the quantities of polluting substances, in particular, against the corresponding threshold levels, and the direction and speed of their transport, i.e., in fact, one deals with the first stage of the inverse problem of environmental safety.
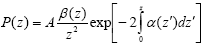
To retrieve the optical parameters of the atmosphere, the basic equation of lidar sounding is used, which is usually written as follows:
 (1)
(1)
where Ð (z) is the power of backscattered signal from the laser beam distance z; Ð is the instrumental constant depending on the laser power, the aperture of receiving telescope, and the recording system effectiveness; β(z) and α(z) are the backscattering and extinction coefficients, respectively, which depend on the particle properties and are the desired quantities. The equation contains two unknowns and is unsolvable without assumption of additional links between α and β; it is solved by the Klett method and Raman method [5,6].
The algorithm and computer codes applied at the St. Petersburg lidar station are those elaborated in Optosystems Ltd. by the team headed by I. Veselovskii [7].
Lidar systems
The stationary lidar system: The stationary lidar system is mounted at the roof of the university building at height of 35 m, geographical coordinates: Lat 59.943N, Lon 30.273E. It collects information on the atmospheric boundary layer (up to an altitude of 3 km) and on the troposphere (up to an altitude of 15 km depending on atmospheric conditions). The detected atmospheric aerosol parameters include the average and effective radii of the aerosol particles detected in the range from 0.5 to 11 microns; the numerical, surface and volume particles concentration; the real and imaginary parts of the system refractive index of the particles substance; the water vapor content; the depolarization coefficient; the aerosol backscatter and extinction coefficients; the single scattering albedo. The vertical profiles of the wind velocity and wind direction, the turbulence level, and the wind “shear” are obtained with the wind lidar.
The laser system allows:
1) recording the evolution of natural and man-made aerosols in the atmosphere.
2) analyzing the physical structure of the aerosol and estimating the integral size of aerosol particles.
3) remotely determining the wind speed and direction at various altitudes.
4) performing ground mapping to produce a digital map of the area, indicating the atmospheric aerosol and chemical pollutant concentrations.
5) forecasting the pollution transport in the atmosphere based on the pollution concentration data and on the measured actual wind profiles.
6) promptly identifying the sources of pollution.
7) preparing reports in the specified format, based on measurement results.
8) storing and managing the databases from previous measurements.
The system consists of:
• Doppler heterodyne lidar to measure the wind speed and direction, consisting of a stabilized semiconductor laser emitter; a single-mode fiber laser amplifier; a unit for installation and alignment of the optical transmission and optical reception paths; a temperature stabilization unit for the reception/transmission optical path; a power supply unit and radiator parameters control unit. The wind speed measuring range is 0.5–40 m/sec, ±0.5 m/sec accuracy; the wind direction measuring range is 0–360º, ±5º accuracy.
• an aerosol lidar consists of a tunable stabilized Nd:YAG laser emitter (355, 532 and 1064 nm); a unit for laser installation and alignment; a receiving channel unit; optical forming and receiving path units; a power supply unit and radiator parameters control unit.
• a transmitting-receiving telescope provides the laser radiation formation, transmission of the radiation through the scanning system to the studied objects, and reception of useful signals containing information on the object substance and its concentration and on the distance to the object. The light diameter of the telescope is 350 mm.
• a scanning system ensuring high-precision angular positioning of the viewing line: azimuth scanning range 0° to 360°; viewing angle scanning range 0° to 110º; angle step 1'; maximum velocity 20/sec.
Also, the stationary lidar system includes a video surveillance system and a special basement equipment with a platform vibration isolation system, a life-support system and accessories (a set of alignment tools, including visualizers and He-Ne lasers for precise alignment). The control and data acquisition system includes control units and units for heterodyne channel signal processing (Doppler lidar), synchronization of the interaction of basic subsystems, data communication for automated control of the lidar emitter and video camera parameters and the scan system, automatic data collection, automatic maintenance of the parameters set, and performance monitoring of the lidar equipment with fault data output.
The software of the multiwave lidar system includes a general software with the operating system and system-wide software which integrates a database management system for reception, storage and transmission of primary lidar measurements data to other lidar system subsystems (including the situational-information center software), and a GIS for digital mapping of the area.
The mobile lidar system: The mobile lidar system is a transported module on a van platform, which accommodates the lidar system equipment and a control cabin and allows conducting environmental monitoring in different geographical sites under field condition. The mobile system is a fully autonomous and highly automated system which has its own power supply and climate control unit maintaining the necessary conditions for mobile multiwave lidar operation: the preset temperature mode in the range from +15 to +28°C with a 1°C step for the interior space. The equipment of the system includes a mobile carrier with a cargo compartment provided with all the necessary facilities for its proper functioning (including power supplies with a diesel generator, step-down transformers bearing the lidar subsystems, computer software and hardware). The mobile system is additionally equipped with a shortwave differential absorption lidar based on a tunable multiwave Ti: Sph laser operating in three wavelength ranges: 700...960, 350...480, 230...310 nm [8]. Along with the possibilities offered by the stationary system as described above, the mobile lidar system allows remotely detecting the atmospheric concentration of trace gases (SO2, NO2, Cl2, O3), whose absorption lines coincide with the laser radiation range.
Results
Data of lidar monitoring atmospheric aerosols
Laser sounding is an active measurement because it uses the signal generated by laser (laser system). Lidar systems allow accomplishing the ecological monitoring of the objects in real time and promptly obtaining the result in terms of ecological information: the concentration and the direction and speed of transport of pollutants in the atmosphere. The pollutant concentrations derived from lidar sounding based on the laser system in the Observatory of Environmental Safety allow directly comparing the results with the threshold concentrations and thereby detecting dangerous situations for ecosystems and people [4]. The results of observations at the St. Petersburg station appear as follows: 1) range-corrected signals, 2) profiling of the extinction coefficients at wavelengths of 355 and 532 nm, the backscatter coefficient at wavelengths of 355, 532 and 1064 nm, and the volume depolarization ratio at 355 nm. Processing of the extinction coefficients at 355 and 532 nm and the backscattering coefficient at 355, 532 and 1064 nm gives the particle size distribution and the real and imaginary parts of the refractive index.
St. Petersburg is located near the Finland Gulf and has a high annual average air humidity. In this regard there are so few clear days: 20-25 clear days yearly average. The average cloudiness is 7.3 points per annum, precipitation falls about half days of a year. The South-West wind is predominant with an average speed of 2-2.5 m/s.
Lidar sounding is successful only under the clear-sky conditions; with heavy clouds it is ineffective because of prevalent multiple scattering and a very small backscatter portion of the cloud phase function.
Figures 1 and 2 present an example of the vertical profile of the volume extinction coefficient α(z) in the height (m) – time (hour) coordinates, derived from 355 and 532 nm channels measurements in the zenith direction on March 5 2015 during 12 hours. The figures clearly traced a “pollution cap” variation above the city up to the height of 1.8 km. One can see that extinction coefficient reach maximal values from 15:30 till 17:30, and remains high values till 20:00 hours. It is easy to obtain aerosol optical depth (AOD) from these data by summation over height and multiplying to the step equal to 7.5 m. The values averaged over every considered time period are presented in the Table 1 for three spectral channels. After 22:00 hours extinction coefficient is 4 times less than in day time and significantly dissipates with ground level particles elevating [9].

Figure 1: Dynamics of the vertical profile of aerosol extinction during 4 time intervals from 11:00 till 23:30 h of local time from observations March 5 2015 in 355 nm channel in St. Petersburg.

Figure 2: Dynamics of the vertical profile of aerosol extinction in 532 nm channel during 4 time intervals from 11:00 till 23:30 h of local time from observations March 5 2015 in St. Petersburg.
| Wavelength, nm Time period | 340 | 355 | 440 | 500 | 532 | 1020 | 1064 |
|---|---|---|---|---|---|---|---|
| Lidar, 11:00-14:00 | 0.129 | 0.167 | 0.02 | ||||
| Lidar, 15:30-17:30 | 0.302 | 0.182 | 0.03 | ||||
| Lidar, 18:45-21:00 | 0.247 | 0.147 | 0.02 | ||||
| Lidar, 21:45-23:30 | 0.113 | 0.119 | 0.01 | ||||
| AERONET, Peterhof (45) | |||||||
| 05-Mar-15 | 0.188 | 0.109 | 0.059 | ||||
| AERONET, Tøravere (262) | |||||||
| 05-Mar-15 | 0.339 | 0.296 | 0.246 | 0.199 | |||
| 06-Mar-15 | 0.574 | 0.555 | 0.561 | 0.563 | |||
| AERONET, Kuopio (357) | |||||||
| 09-Mar-15 | 0.051 | 0.043 | 0.039 | 0.028 | |||
| 18-Mar-15 | 0.367 | 0.324 | 0.301 | 0.27 | |||
| AERONET, Helsinki (300) | |||||||
| 12-Mar-15 | 0.028 | 0.024 | 0.021 | 0.014 | |||
| 18-Mar-15 | 0.215 | 0.174 | 0.154 | 0.115 | |||
| AERONET, Moscow (637) | |||||||
| 06-Mar-15 | 0.405 | 0.337 | 0.298 | 0.17 |
Table 1: Aerosol optical depth, (km-1) averaged over time intervals: 1 – 11:00-14:00, 2 – 15:30-17:30, 3 – 18:45-21:00 and 4 – 21:45-23:30 from lidar sounding on March 5 2015 and nearest AERONET stations on nearest available days.
Averaged values of the extinction coefficient allowed calculating aerosol optical thickness (AOT) that presented in the Table 1 together with AOT from Aerosol Robotic Network (AERONET) observations. Mention that lidar and AERONET observation needs clear sky. the weather conditions are not coincides in scales of considered distances.
Nevertheless, the comparison lidar and AERONET data helps testing lidar results. There is data of AERONET stations neighbor to St. Petersburg that available for nearest dates. The Peterhof station is new one and does not provide complete information. It is the nearest AERONET site and is remote to 45 km from the lidar station. The distance from St. Petersburg to Tøravere is 262 km, to Helsinki is 300 km, to Kuopio is 357 km, and to Moscow is 637 km (pointed in brackets in the table). There are 7 spectral channels of AERONET observations, we used here channels, which are closer to lidar ones. It is seen that the optical thickness obtained from lidar sounding is similar to the nearest station Tøravere and to values in the big city Moscow. It is seen that AOT at Finland stations (Kuopio and Helsinki) is lower in the nearest date but increases strongly in a week.
The useful characteristic is a particle depolarization. The laser light beam is initially polarized, after interaction with spheroidal particles it retains the polarization, and interaction with crystal particle provokes reducing polarization of the backscattered light received by telescope. Hence there is a possibility estimating the particle shape that helps indicating particle origin. Figure 3 shows the particle depolarization factor of atmospheric aerosols. One can see that aerosol particles, which shape is close to spheroid, are dominated in the night time (after 19:00 h) in the near surface layer < 1 km. It might be soot particles. Particle depolarization also points to dust (kind of sand crystal particles) in the first half of the day till 1 hour p.m. that elevated 2 km, and in the night after 9 p.m. descending to 1 km. It is seen noisy errors in heights upper 2 km.

Figure 3: Dynamics of the vertical profile of linear depolarization during 4 time intervals from 11:00 till 23:30 h of local time from observations March 5 2015 in St. Petersburg.
Aerosol parameters retrieved
Figures 4a and 4b show vertical profiles of particle number and particle volume in 1 cm3 in four time intervals: 1 – 11:00-14:00, 2 – 15:30-17:30, 3 – 18:45-21:00 and 4 – 21:45-23:30 of local time, where one can see decreasing particles number in the night time. It is to point out that particle volume does not vary strongly above 800 m, and number concentration changes significantly. It might show to redistribution particles over size during the day. Particle volume concentration might be easy recalculated to mass concentration that is used in ecological state description.

Figure 4: Vertical profiles of extinction coefficient (a), particle number (b) and volume (c) concentration in 1 cm3 averaged in four time intervals: 1 – 11:00-14:00, 2 – 15:30-17:30, 3 – 18:45-21:00 and 4 – 21:45-23:30 of local time from observations March 5 2015 in St. Petersburg.
An important characteristic of aerosol particles is their size. The atmosphere contains particles of different sizes, so an ensemble of particles described by the particle size distribution n(r) is typically considered. Figure 5 present size distributions at four heights, 315, 700, 930 and 1140 m derived from lidar sounding on March 5 2015 for above mentioned 4 time intervals. It is seen that, at the height of 315 and 700 m, aerosol is characterized by a bimodal size distribution in 1st and 2nd time intervals. But later the coarse mode disappears. In the evening there is a bimodal distribution but in submicron ranges and in the night time only mode 0.3 μm remains. There are two modes for morning, day and evening at 930 m and one mode in the night in submicron diapason. The pattern remains at higher altitude 1140 m, but in the evening and especially night time the slight maximum appears for 1.25 μm particles.

Figure 5: Particle size distribution at 4 heights: 315, 700, 930 and 1140 m, and in 4 time intervals 1 – 11:00-14:00, 2 – 15:30-17:30, 3 – 18:45-21:00 and 4 – 21:45-23:30 of local time from observations March 5 2015 in St. Petersburg.
The particle size distribution dV(r) d ln r was retrieved from AERONET observation at four nearest stations in the nearest available dates, which shown in the Figure 6. The double mode pattern is seen at all shown results.

Figure 6: Particle size distribution from AERONET observation at stations nearest to St. Petersbu15rg: a) Peterhof, March 5 2015; b) Kuopio, March 9 2015; c) Toravere, March 5 2015; d) Moscow, March 9 20.
The mean and effective radii are expressed as:
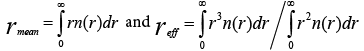
Figure 7 shows the vertical profiles of particle mean rmean and effective reff radii for above pointed time intervals. The particle mean radius is unvaried during the day and only in the night time increases especially at heights 1500 – 1600 m. There are significant errors in the retrieval of the considered parameter higher 1600 m, hence the altitude is restricted by 1600 m for violet curve.

Figure 7: Profiles of the mean (a) and effective (b) radius in four time intervals: 1 – 11:00-14:00, 2 – 15:30-17:30, 3 – 18:45-21:00 and 4 – 21:45-23:30 of local time from observations on March 5 2015 in St. Petersburg.
It is seen 2-modes distribution also that includes a coarse mode (1.0-1.5 μ) in the atmospheric layer lower 700 m.
Figures 8a and 8b present the profiles of real and imaginary parts of the refractive index. The real part varies in the lower atmospheric layer (<800 m) and upper than 1600 m. The imagine part differs noticeably in the morning (blue line) around 0.003 and remains stable around 0.005 over the height later in the day. Values of these parameters are in ranges of obtained earlier from taking probes of mineral dust [10- 12]. AERONET retrieval from data at Kuopio station on March 9 2015 points to imaginary part of the refractive index 0.002 – 0.003, which in good agreement with lidar retrieval lower 800 m in the morning. In addition, it is necessary to note that there is more black carbon and dust in the air above big city, which has grater values of the refractive index imagine part.

Figure 8: Vertical profiles of real (a) and imaginary (b) parts of the refractive index in four time intervals: 1 – 11:00-14:00, 2 – 15:30-17:30, 3 – 18:45-21:00 and 4 – 21:45-23:30 of local time from observations on March 5 2015 in St. Petersburg and c) retrieval from AERONET data at Peterhof station on March 5 2015 in 13:14 (blue) and 13:37 (red) moments.
Optical modelling and radiative calculation
The vertical homogeneous layer was assumed with optical parameters presented in the Table 2. Results of lidar sounding in St. Petersburg and AERONET observation in available sites around the city are used together with proposed modelling.
| Time intervals |
l, nm | Rayleigh scattering |
Aerosol scattering | Sum scattering |
TAU aerosol |
Molecular absorption | TAU sum | w0 | g | Ð |
|---|---|---|---|---|---|---|---|---|---|---|
| Averaged over the day | 355 | 0.60 | 0.12 | 0.72 | 0.129 | 0.001 | 0.730 | 0.987 | 0.70 | 0.7 |
| 532 | 0.11 | 0.16 | 0.27 | 0.164 | 0 | 0.280 | 0.976 | 0.65 | 0.7 | |
| 1064 | 0.05 | 0.02 | 0.07 | 0.022 | 0 | 0.072 | 0.978 | 0.60 | 0.7 | |
| 1 | 355 | 0.60 | 0.10 | 0.70 | 0.129 | 0.001 | 0.730 | 0.960 | 0.70 | 0.7 |
| 532 | 0.11 | 0.14 | 0.25 | 0.167 | 0 | 0.277 | 0.904 | 0.65 | 0.7 | |
| 2 | 355 | 0.60 | 0.20 | 0.80 | 0.302 | 0.001 | 0.903 | 0.886 | 0.70 | 0.7 |
| 532 | 0.11 | 0.11 | 0.22 | 0.182 | 0 | 0.292 | 0.895 | 0.65 | 0.7 | |
| 3 | 355 | 0.60 | 0.20 | 0.80 | 0.247 | 0.001 | 0.848 | 0.943 | 0.70 | 0.7 |
| 532 | 0.11 | 0.12 | 0.23 | 0.147 | 0 | 0.257 | 0.933 | 0.65 | 0.7 | |
| 4 | 355 | 0.60 | 0.10 | 0.70 | 0.113 | 0.001 | 0.714 | 0.980 | 0.70 | 0.7 |
| 532 | 0.11 | 0.10 | 0.21 | 0.119 | 0 | 0.229 | 0.918 | 0.65 | 0.7 |
Table 2: Optical models for the atmosphere above St. Petersburg on March 5 2015.
Digits in the left column point to number of the time interval. Parameters for averaged over the day results are presented also. Ground albedo is assumed equal to 0.7 because there was snow around the city in March. Incident solar flux is taken for wavelengths 355, 532 and 1064 nm as 1.006, 1.790 and 0.640 Wm-2nm-1.
Radiative calculation with Delta-Eddington approach gives values of reflected from the atmosphere, transmitted to the surface fluxes and radiative divergence for optical parameters averaged (aver) and varied over the day. Solar zenith angles were taken equal to θ0 = 65, 70, 75, 80° correspondingly to considered time intervals. Table 3 presents relative values in 5 upper lines and energetic values in lower lines.
| q0,° | 1: 65 | 2: 70 | 3: 75 | 4: 80 | ||||||||||
|---|---|---|---|---|---|---|---|---|---|---|---|---|---|---|
| l, nm | Fup | Fdown | R | Fup | Fdown | R | Fup | Fdown | R | Fup | Fdown | R | ||
| aver | 355 | 0.719 | 0.832 | 0.032 | 0.733 | 0.779 | 0.032 | 0.751 | 0.709 | 0.036 | 0.775 | 0.619 | 0.392 | |
| aver | 532 | 0.704 | 0.908 | 0.023 | 0.712 | 0.874 | 0.026 | 0.724 | 0.823 | 0.03 | 0.743 | 0.74 | 0.036 | |
| aver | 1064 | 0.701 | 0.977 | 0.006 | 0.703 | 0.967 | 0.007 | 0.707 | 0.95 | 0.008 | 0.714 | 0.919 | 0.011 | |
| 355 | 0.673 | 0.778 | 0.094 | 0.641 | 0.815 | 0.114 | 0.683 | 0.802 | 0.077 | 0.758 | 0.609 | 0.06 | ||
| 532 | 0.649 | 0.868 | 0.091 | 0.64 | 0.684 | 0.155 | 0.735 | 0.7 | 0.055 | 0.68 | 0.726 | 0.102 | ||
| Wm-2nm-1 | ||||||||||||||
| aver | 355 | 0.306 | 0.354 | 0.014 | 0.252 | 0.268 | 0.011 | 0.196 | 0.185 | 0.09 | 0.136 | 0.108 | 0.069 | |
| aver | 532 | 0.533 | 0.687 | 0.017 | 0.436 | 0.535 | 0.016 | 0.336 | 0.382 | 0.014 | 0.231 | 0.231 | 0.011 | |
| aver | 1064 | 0.189 | 0.264 | 0.002 | 0.154 | 0.211 | 0.002 | 0.117 | 0.158 | 0.001 | 0.08 | 0.102 | 0.001 | |
| 355 | 0.286 | 0.331 | 0.04 | 0.22 | 0.28 | 0.039 | 0.178 | 0.209 | 0.02 | 0.133 | 0.107 | 0.011 | ||
| 532 | 0.491 | 0.657 | 0.069 | 0.392 | 0.418 | 0.095 | 0.317 | 0.452 | 0.026 | 0.212 | 0.227 | 0.032 | ||
| Total flux, W*m-2 | 202 | 268 | 16 | 161 | 210 | 25 | 120 | 190 | 11 | 103 | 83 | 18 | ||
Table 3: Radiative characteristics calculated for the atmosphere above St. Petersburg on March 5 2015.
Approximate integrating over wavelength gives values for transmitted flux presented in the table in the lowest line. Figure 9 demonstrates comparison for cloudless atmosphere of observed with pyranometer in Kuopio station (red symbols) and calculated on the base of optical models obtained from lidar sounding (blue symbols).

Figure 9: Solar flux (W m-2) from pyranometer data in Kuopio station on March 9 2015 (red symbols) versus solar angle (a) and UTC time (b), and calculated from modeling in St. Petersburg from lidar sounding on March 5 2015 (blue symbols), during the day. Small difference is possible to explain by higher aerosol content in polluted atmosphere of the big city and pure air in Kuopio. The higher aerosol content decrease transmittance for smaller values of solar zenith angle and increased a bit for higher angles due to increasing scattering by aerosols.
Small difference is possible to explain by higher aerosol content in polluted atmosphere of the big city and pure air in Kuopio. The higher aerosol content decrease transmittance for smaller values of solar zenith angle and increased a bit for higher angles due to increasing scattering by aerosols.
The results of lidar monitoring the wind characteristics
The details of lidar sounding of the wind characteristics are considered in Akhmetianov and Banakh [13,14]. The St. Petersburg station offers a possibility to scan the wind characteristics in two regimes: in azimuthal cone and over zenith angle, as Figure 10 indicates.

Figure 10: Scanning regimes of wind characteristics with lidar observations : a-in az imuthal cone; b - over zenith angle
Vertical step and the averaging area depend on the scanning parameters as shown in Figures 11 and 12. The maximal height depends also on atmospheric conditions [15].

Figure 11: Parameters of the cone scanning: averaging area at distance 5775 m (blue line) and altitude step (green line) depending on the scanning cone angle �?.

Figure 12: Projection of the wind velocity and direction from the observation 05.03.2015, in 10:25 a.m.: a) to the horizontal plane (scanning over asymuth) presented as a city map, b) to the vertical plane (scanning over zenith viewing angle in the plane of maximal wind velocity).
Wind velocity increases with height from 2 till 6 m/sec after 15:23. Wind direction does not vary in the morning, but from 15:23 till night it shifts from the North at ground level to the West at the height 1 km (Figure 13a-13f). It is seen that lidar measurements of the wind allows obtaining more details and following the day variations of atmospheric dynamics.

Figure 13: Vertical profiles of wind characteristics from wind Doppler lidar sounding on March 5 2015 in the morning and day (a - c), and evening (d - f) moments pointed in figure; a, d –horizontal component of the velocity, b, e – vertical component; c, f – wind direction.
Discussion
Extinction coefficient is maximal in day time after 15:30 and reaches 0.8 km-1 and decrease in the night. The clear stratification in the evening and especially night time coincides with noticeable vertical motions. Regretfully there is no observation of temperature and moisture with radiosonde in day time and we cannot analyze situation together with meteorological parameters.
The profiles of value of particle number, extinction coefficient and particle mean radius are in range of known aerosol models [16].
The aerosol volume demonstrates smooth decrease with altitude, particle number for day and evening time in contrast has marked maximums at 400 m. It points to the prevalence of big particles in the lower layer less 500 m in day and evening that is seen in Figure 8b for effective radius (red line). The particle concentration decrease significantly in the night time but particles grow in 3 times. It might be explained by humidity increasing but the lack of radiosonde data doesn’t permit further discussion [10,17]. The vertical profiles of particle mean radius is homogeneous without variations above 400 m (for morning observation above 600 m). The particle number in higher levels (above 1600 m) is extremely low and errors of the particle size retrieval increase, because the violet curve presented only till this altitude (Figure 14).

Figure 14: Vertical profiles of the temperature (a), moisture (b), wind velocity (c) and wind direction (d) from radio-sounding observation at 03:00 a.m. 6 March 2015 in Voeikovo station.
The lower values of both parts of the refractive index (1.4276+i 0.0034) in the morning (blue curves in the Figure 9) at layers lower 1000 m coincides with noticeable values of the particle linear depolarization. It allows assuming a mineral dust in the atmosphere in 1st time interval [11,12]. Later imagine part increases without variations over altitude and particle linear depolarization is kept significant in thinner layer (500 m) in day and evening time, then in the night elevates till 1000 m. The values of real and imagine parts of the refractive index in day, evening, and night time points to increase soot particles in the pollution cap.
It is possible to mention a link between vertical wind motion and aerosol stratification. Convective transport, as the key mechanism for lifting aerosol out of the boundary layer, is very important for all components, as Kipling says [18].
Analysis of the capabilities of the lidar system demonstrates its wide application for ecological monitoring of the environment in observatory of environmental safety. The lidar system includes modern computer techniques for data processing, and nowadays the software for results presentation in ecological terms is developed. The resulting characteristics can be represented as the risks of high level of air pollution, whose impact on the health of the population can be assessed. Hence, the active optical methods of ground-based atmosphere remote sensing will allow determining not only optical parameters of the atmosphere and atmospheric aerosols but also the environmental parameters: environmental risks of hazardous events associated with the condition of the atmosphere on the local scale [2]. Future plans call for using the mobile lidar unit that will provide pollution transfer around streets and exchange with suburb atmosphere study. The analysis of the complicated links between wind characteristics and formation of the pollution cap above the city need in more statistics and it is out of this consideration. We are only presenting here the information obtained from one experiment accomplished on March 5 2015 in the city center.
Acknowledgments
The equipment of the Resources Centre Observatory of Environmental Safety of Research Park, St. Petersburg State University has been used for the study/
The authors are grateful for the support of work: Agreement No. 14. 586.21.0023 Conducting applied research on the development of an automated information system for monitoring and forecasting the balance for urban storm water drainage systems) in the framework of realization of the Federal target program Research and development on priority directions of development of scientific-technological complex of Russia for 2014 - 2020" (a Unique identifier for applied scientific research project RFMEFI58615X0023.
References
- Donchenko VK (2007) Actual problems of studying of man-made pollution of the environment. Environmental safety. Methodological problems of ecological safety No. 1-2 St. Petersburg: SRCES RAS.
- Donchenko VK, Melnikova IN, Boreisho AS, Morozov AV (2010) The use of mobile lidarsystemes for the inverse problem of ecological monitoring.
- Donchenko VK, Samulenkov DA, Melnikova IN, Boreisho AS, Chugreev AV (2013) Laser complexes of the Resources Center of St. Petersburg State Uiversity. Problem statement and first results. Cur Prob Rem Sens Earth Spac 10: 122-134.
- MelnikovaI, Donchenko V, BoreishoA, MorozovA(2010)Lasersystemsforthesolutionoftheinverseproblemofecologicalmonitoring 1: 2.
- KlettJD (1981) Stable analytical inversion solution for processing lidar returns. Appl Opt 20: 211-220.
- Ansmann A, Riebesell M, Wandinger U, Weitkamp C, Voss E, et al. (1992) Combined Raman elastic-backscatter, and lidar ratio. ApplPhys B 55: 18.
- Veselovskii I, Whiteman DN, Kolgotin A, Andrews E, Korenskii M (2009) Demonstration of aerosol property profiling by multi-wavelength lidar under varying relative humidity conditions. J Atmo and Ocean Tech 26: 1543-1557.
- Boreysho AS, Chakchir SY, Konyaev MA, Konovalov KA, Savin AV (2005) Optical heterodyning in differential tunable CO2 Laser Systems.
- Samulenkov DA, Melnikova IN, SapunovMV, Donchenko VK, Kuznetsov AD (2015) Difference of day and night profiles of the pollution cap in the center of St. Petersburg city. Currprobremosens Earth Spac 12: 81-96.
- Shettle EP, Fenn RW (1979) Models of aerosols lower troposphere and the effect of humidity variations on their optical properties.
- Sokolik IN, Toon OB (1999) Incorporation of mineralogical composition into models of the radiative properties of mineral aerosol from UV to IR wavelengths. Geophys Res104: 9423-9444.
- Dubovik O, Holben BN, Eck TF (2002) Variability of absorption and optical properties of key aerosol types observed in worldwide locations. J AtmosSci 59: 590-608.
- AkhmetianovBR, VasilyevDN, KonyaevMA, Mishina OA, Penkin MS, et al. (2013) Approachesandalgorithmsfordataprocessingofwindcoherentdopplerlidarwithconescanning. J radio electr 10: 11-23.
- BanakhVA (2013) Coherent doppler wind lidars in turbulent atmosphere.
- Sapunov MV, Melnikova IN, Donchenko VK, Samulenkov DA, Kuznetsov AD (2016) The vertical profile of wind speed and direction of the lidar and upper-air measurements. Cur probremosens Earth Spac13: 149-160.
- Krekov GM, Rakhimov RF (1982) Optical - radar model of the continental aerosol.
- Mikhailov EF, Vlasenko SS (2007) Structure and optical properties of soot aerosols in a moist atmosphere: Influence of hydrophilicity of particles on the extinction, scattering, and absorption coefficients, Izvestiya, Atmosp Ocean Phy 43:105-207.
- Kipling Z, Philip S, Colin EJ, Graham WM, Nicolas B, et al. (2016) What controls the vertical distribution of aerosol? Relationships between process sensitivity in HadGEM3–UKCA and inter-model variation from AeroCom Phase II. AtmosChemPhys 16: 2221-2241.
Relevant Topics
- Atmosphere
- Atmospheric Chemistry
- Atmospheric inversions
- Biosphere
- Chemical Oceanography
- Climate Modeling
- Crystallography
- Disaster Science
- Earth Science
- Ecology
- Environmental Degradation
- Gemology
- Geochemistry
- Geochronology
- Geomicrobiology
- Geomorphology
- Geosciences
- Geostatistics
- Glaciology
- Microplastic Pollution
- Mineralogy
- Soil Erosion and Land Degradation
Recommended Journals
Article Tools
Article Usage
- Total views: 6596
- [From(publication date):
February-2017 - Aug 30, 2025] - Breakdown by view type
- HTML page views : 5671
- PDF downloads : 925