Performance and Yield Stability Analysis of Potato Genotypes in Ethiopia
Received: 12-Jan-2018 / Accepted Date: 29-Jan-2018 / Published Date: 05-Feb-2018 DOI: 10.4172/2329-8863.1000336
Abstract
Potato (Solanum tuberosum L.) is one of the most widely grown root and tuber crop in the mid and high altitude areas of Ethiopia. It has both dietary and income generating role to produces. However the yield obtained at farm levels is very low other compared with other county. One of the main reason for such low yield of potato in the country is luck of high yielding and disease resistance variety. To this effect, potato national variety trial was conducted by Adet, Holleta and Kulumsa Agricultural Research Centers with the main objective of identifying high yielder and disease tolerant potato genotypes in 2009 and 2010. In this trial 10 genotypes were tested against standard and local checks in randomized complete block design with three replications on gross plot size of 9 m2 planted at a spacing of 75 cm × 30 cm between rows and plants, respectively. Combined analysis over locations and seasons revealed that the clone CIP-396004.337 gave the highest marketable tuber yield of 345.60 qt/ha followed by CIP-395096.2 (344.20 qt/ha) whereas the lowest tuber yield (156.40 qt/ha) was from CIP-396029.250. Moreover, the lowest percentage (4.03%) of late blight infestation was from CIP-396004.337 as compared to 21.17% from genotype CIP-396029.250. GGE biplot as well as ASV analysis identified CIP-396004.337 as high yielder and stable clone and therefore recommended for release as commercial variety. Since 2013, it is released as new potato variety in Ethiopia with local name of “Dagem”.
Keywords: AMMI; ASV; GGE biplot; Stability; Yield
Introduction
Root and tubers are said to be one of the most efficient crops in converting natural resource, labor and capital into a high quality food with wide consumer acceptance [1]. Among the root and tuber crops potato is the first and the most predominant crop in Ethiopia. In Ethiopia potato cultivation extends from mid altitude areas to the extreme highland areas above 3000 m.a.s.l, where the environment preclude the choice for cultivating other crops except hardy crops such as potato and Barly. This emanates from the crop inherent nature to grow under wider agro-ecology conditions. Such quality of potato together with its short crop cycle makes it is a strategic food security crop in this areas. Hence, potato serves as both stable food and income generating crop.
However, the recent five years (2008-2012) mean national average yield is approximately 80.83 qt/ha (http://faostat3.fao.org), which are very low compared to the world average of 184.94 qt/ha (http://faostat3.fao.org). Diseases, poor crop management practices, lake of improved verities for different purpose and troubles, use of inferior quality seed tubers of unknown origin and health status and inappropriate storage structure are among the key factors contributing to this yield level. To overcome these problems research has been done for long periods. As a result reasonable number of disease tolerant varieties, improved crop management practices and postharvest handling technologies were identified. Pilot level demonstration of these technologies revealed the possibility of increasing the current yield three to four folds. However, our pervious released technologies and promotion activities as compared to the existing production constraints of the crop in the area indicates, till more research effort is required to overcome the problems.
One of the primary factor that determine the production and productivity of potato in the country is varieties under production. The local varieties are low yielder susceptible to major potato disease and narrow genetic base. Therefore, to develop high yielding, disease tolerant and stable potato varieties and increase the production and productivity of potato conducting variety development experiments in different part of the country is vital. This paper presents the result of potato national variety trials conducted for two main cropping seasons.
Materials and Methods
The trial was carried out for two years (2009 and 2010 main cropping seasons) across three agro-ecology zones of major potato growing areas (Adet, Holleta and Kulumsa). In this trial a total of 10 potato clones were tested against standard and local checks in randomized complete block design with three replications on a gross plot size of 9 m2. A spacing of 75 cm × 30 cm between rows and plants, respectively were used for this trial. Fertilizer and crop husbandry practices were applied as per the recommendation. Finally agronomic and yield data were taken from the central two rows of 16 plants and used for analysis. The data were subjected to SAS V9 and GenStat V16 [2,3] for ANOVA and stability analysis, respectively.
Results and Discussion
Analysis of variance
Combined ANOVA result of each location over two years indicated significant (P<0.01) genotypic differences for plant height, stem number per plant, number of tubers per square meters, late blight score, average tuber weight tuber yield (Tables 1-4).
| Year/s | Source | DF | SS | MS | %(L+G+GL) |
|---|---|---|---|---|---|
| 2009 | Location (L) | 2 | 418485.99 | 209242.99** | 40.78 |
| Genotype (G) | 11 | 544939.02 | 49539.91** | 53.1 | |
| GL | 22 | 62772.77 | 2853.31** | 6.12 | |
| 2010 | Location (L) | 2 | 181526.59 | 90763.30** | 17.37 |
| Genotype (G) | 11 | 480404.99 | 43673.18** | 45.97 | |
| GL | 22 | 383214.63 | 17418.85** | 36.67 | |
| % (L+G+Y+GL +GY+GYL) |
|||||
| Combined | Location (L) | 2 | 334404.25 | 167202.13** | 15.81 |
| Genotype (G) | 11 | 963291.85 | 87571.99** | 45.54 | |
| Year (Y) | 1 | 44112.37 | 44112.37** | 2.09 | |
| GL | 22 | 246894.61 | 11222.48** | 11.67 | |
| GY | 11 | 62052.16 | 5641.10** | 2.93 | |
| YL | 2 | 265608.33 | 132804.16** | 12.56 | |
| GLY | 22 | 199092.8 | 9049.67** | 9.41 |
Table 1: Genotype (G), environment (L and Y), genotype by environment (GE), variance terms for rainfed potato yield trials in 2009 and 2010 and combined over these years/seasons.
| Genotypes | Plant height(cm) | Main stem/plant | Late blight (%) | No of tubers/m2 | Average tuber weight(gm) | MTY(qt/ha) | TTY (qt/ha) |
|---|---|---|---|---|---|---|---|
| CIP-396033.102 | 67.31ab | 4.36ab | 16.33b | 46.2d | 68.71c | 305.76cd | 315.20b |
| CIP-392641.4 | 51.76d | 2.98cd | 43.66a | 37.2e | 68.99c | 239.73efg | 255.77cd |
| CIP-395112.36 | 53.30cd | 2.98cd | 36.66a | 54.33bcd | 59.03d | 314.83cd | 320.45b |
| CIP-396004.337 | 64.35ab | 3.12cd | 8.58bcd | 46.80d | 89.57a | 398.69ab | 411.55a |
| CIP-395096.2 | 71.3a | 4.43ab | 10.33bc | 64.13a | 68.50c | 422.39a | 434.52a |
| CIP-395111.13 | 37.85f | 1.17e | 10.50bc | 30.93e | 31.07f | 185.46g | 193.34e |
| CIP-395011.2 | 63.90ab | 2.41d | 10.08bc | 46.58d | 81.90ab | 357.65bc | 381.20a |
| CIP-396031.108 | 69.3a | 3.74abc | 10.91bc | 52.48cd | 74.65bc | 374.95ab | 388.58a |
| CIP-396029.250 | 43.71ef | 3.32cd | 42.33a | 28.93e | 81.07b | 210.22fg | 261.13ed |
| CIP-396004.225 | 70.68a | 3.57bc | 16.5b | 61.7ab | 47.66e | 287.12de | 300.47bc |
| GUDENIE | 60.11bc | 4.73a | 15.5b | 48.33d | 57.33d | 265.37def | 273.8bcd |
| LOCAL | 50.06de | 3.08cd | 12.46bc | 58.13abc | 47.38e | 261.74def | 267.56bcd |
| Mean | 58.67 | 3.32 | 18.13 | 47.97 | 64.66 | 301.99 | 314.04 |
| CV (%) | 11.01 | 26.87 | 37.63 | 15.72 | 11.01 | 16.05 | 15.08 |
| LSD (5%) | 7.5 | 1.03 | 7.93 | 8.76 | 8.27 | 56.35 | 55.04 |
Table 2: Performance of potato clones combined over season at Adet.
| Genotypes | Plant height (cm) | Main stem/plant | No of tubers/m2 | Average tuber weight (gm) | MTY(qt/ha) | TTY (qt/ha) |
|---|---|---|---|---|---|---|
| CIP-396033.102 | 55.33bc | 3.91bcd | 37.18de | 71.08ab | 272.01abc | 275.72ab |
| CIP-392641.4 | 33.16e | 2.10f | 22.38f | 29.87e | 60.14d | 65.54c |
| CIP-395112.36 | 51.66c | 3.40cde | 47.01bcd | 59.27bcd | 279.21abc | 282.48ab |
| CIP-396004.337 | 50.16c | 4.10c | 41.11de | 76.14ab | 309.21abc | 311.99ab |
| CIP-395096.2 | 60.66ab | 4.43ab | 69.01a | 42.45de | 274.29abc | 280.35ab |
| CIP-395111.13 | 35.83de | 1.78f | 66.70b | 53.31cd | 249.65bc | 259.08b |
| CIP-395011.2 | 50.00c | 2.08f | 43.43d | 74.12a | 327.13a | 330.38a |
| CIP-396031.108 | 62.66a | 3.18cde | 45.05cd | 67.64abc | 305.65abc | 308.80ab |
| CIP-396029.250 | 40.00d | 3.15de | 31.13ef | 28.47e | 81.97d | 87.70c |
| CIP-396004.225 | 52.83c | 3.91bcd | 41.11de | 61.55cd | 246.60c | 253.05b |
| GUDENIE | 60.66ab | 4.26a | 56.23b | 60.10bc | 315.93ab | 320.83ab |
| LOCAL | 41.16D | 2.71EF | 54.08BC | 40.99F | 48.05D | 62.26C |
| Mean | 49.51 | 3.33 | 45.37 | 53.33 | 230.81 | 236.51 |
| CV (%) | 10.85 | 24.38 | 20.00 | 27.32 | 25.66 | 25.01 |
| LSD (5%) | 6.24 | 0.98 | 10.54 | 16.93 | 68.85 | 68.77 |
Table 3: performance of potato clones combined over seasons at Holleta.
| Genotypes | Plant height (cm) | Main stem/plant | Late blight (%) | No of tubers/m2 | Average tuber weight (gm) | MTY(qt/ha) | TTY (qt/ha) |
|---|---|---|---|---|---|---|---|
| CIP-396033.102 | 60.23cd | 4.22a | 14.43cd | 43.07f | 54.55bcd | 221.30d | 227.87d |
| CIP-392641.4 | 43.48ef | 2.55de | 19.40bc | 31.06g | 55.30bcd | 161.71e | 172.43e |
| CIP-395112.36 | 56.46d | 3.19bcd | 18.58bc | 50.03bcde | 47.29ef | 232.30cd | 236.74cd |
| CIP-396004.337 | 59.15cd | 3.51b | 3.51f | 44.80edf | 70.06a | 305.34a | 313.16a |
| CIP-395096.2 | 64.83ab | 4.33a | 8.30ef | 62.83a | 50.66ed | 308.77a | 317.86a |
| CIP-395111.13 | 61.26bc | 2.34e | 11.45de | 63.80a | 47.85ef | 292.36a | 304.36a |
| CIP-395011.2 | 60.50cd | 2.33e | 10.38de | 43.56ef | 60.07b | 246.40bc | 259.80bc |
| CIP-396031.108 | 65.65a | 3.54b | 14.26cd | 47.41cdef | 57.70bc | 262.12b | 270.51b |
| CIP-396029.250 | 40.95f | 3.26bc | 21.23b | 30.86g | 52.16cde | 144.59e | 155.41e |
| CIP-396004.225 | 62.55abc | 3.57b | 12.70de | 54.80b | 39.81g | 207.99d | 217.89d |
| GUDENIE | 60.43cd | 4.76a | 10.81de | 51.15bcd | 42.42fg | 208.39d | 215.05d |
| LOCAL | 45.46e | 2.83cde | 31.46a | 53.13bc | 31.69h | 157.34e | 167.35e |
| Mean | 56.75 | 3.37 | 14.71 | 48.04 | 50.80 | 229.05 | 238.20 |
| CV (%) | 6.56 | 16.59 | 31.20 | 11.93 | 11.34 | 9.39 | 9.89 |
| LSD (5%) | 4.33 | 0.65 | 5.33 | 6.66 | 6.69 | 25.00 | 27.38 |
Table 4: Performance of potato clones combined over seasons at kullumsa.
At Adet, the highest plant height (71.30 cm), number of tubers per square (64.13) and maximum marketable tuber yield (422.39 qt/ha) was recorded from genotype CIP-395096.2 but it didn't should statistical difference with clone CIP-39604.337 and CIP-396031.108. Whereas the largest average tuber weight (89.57 gm) and the lowest late blight score (8.58%) was obtained from clone CIP-396004.337 (Table 2). The lowest marketable tuber yield (185.46 qt/ha) was obtained from genotype CIP-395111.13. At Holleta, the maximum number of stems per plant (4.43) and number of tubers per square meters (69.01) was counted from the clone CIP-395096.2 and the highest marketable tuber yield (327.13 qt/ha) was harvested from CIP-395011.2 (Table 3). In contrast the lowest marketable tuber yield (48.05 qt/ha) was harvested from the local variety. At Kulumsa, the maximum stem number per plant (4.76) was counted from the standard check Gudenie. The highest average tuber weight (70.06 gm) and the lowest late blight score (3.51%) was recorded from genotype CIP-396004.337 whereas the maximum tuber number per square meter (63.80) was from CIP-395111.13 and marketable tuber yield of 308.77 qt/ha was obtained from CIP-395096.2 but it didn't showed statistical difference with CIP-396004.337 and CIP-395111.13 (Table 4).
Combined analysis over location in a year as well as combined over locations and years discovered presence of significant (P<0.01) difference among marketable tuber yield of tested genotypes (Table 1). During 2009 season, the maximum mean MTY (Marketable Tuber Yield) was obtained from CIP-395096.2 (329.49 qt/ha) while the minimum was from CIP-396029.250 (123.65 qt/ha) (Table 5) but there was no statistical difference between clone CIP-396004.337, CIP-395096.2 and CIP-396031.108. During 2010 season, the maximum and significant (P<0.01) mean MTY was obtained from clone CIP-396004.337(361 qt/ha) [4]. Across locations and season, the highest marketable tuber yield (337.70 qt/ha) was obtained from genotype CIP-396004.337. In contrast the lowest marketable tuber yield (145.60 qt/ha) was harvested from CIP-396029.250 (Table 5). This manly attributed to genetic difference in yielding ability and tolerance to late blight of potato (Table 6). The highest yielding genotype gave a yield advantage of 28.30 and 116.89% over the standard checks Gudenie and local check, respectively (Table 7).
| Genotype | MTY (qt/ha) during 2009 season | MTY(qt/ha) during 2010 season | Combined over loc and seasons | ||||||
|---|---|---|---|---|---|---|---|---|---|
| E1(Adet) | E3 (Holleta) |
E5 (Kulumsa) |
Combined over 2009 | E2 (Adet) | E4 (Holleta) | E6 (Kulumsa) |
Combined over 2010 | ||
| CIP-396033.102 | 318.70bc | 157.04bc | 241.00de | 238.913c | 292.82cd | 386.98ab | 201.41bcd | 292.74d | 265.82d |
| CIP-392641.4 | 209.81de | 47.32d | 133.60f | 130.244f | 269.64cd | 72.95c | 189.82bcde | 177.47g | 153.86f |
| CIP-395112.36 | 364.85b | 207.59ab | 268.19cd | 280.210b | 282.81cd | 350.83ab | 196.41bcde | 278.65e | 278.45c |
| CIP-396004.337 | 371.11ab | 229.82ab | 342.54ab | 314.489a | 426.27a | 388.59ab | 268.14a | 361.00a | 337.19a |
| CIP-395096.2 | 423.15a | 213.62ab | 351.71a | 329.493a | 421.64a | 334.95ab | 265.81a | 340.80b | 335.15a |
| CIP-395111.13 | 370.33ab | 208.18ab | 294.55c | 291.020b | 254.68cd | 291.11b | 290.17a | 278.65e | 284.84c |
| CIP-395011.2 | 328.43bc | 260.29a | 277.69cd | 288.803b | 386.88ab | 393.96ab | 215.10bc | 331.98b | 310.39b |
| CIP-396031.108 | 419.91a | 222.22ab | 304.23bc | 315.453a | 329.99bc | 389.70ab | 220.00b | 313.23c | 314.34b |
| CIP-396029.250 | 185.00e | 69.49cd | 116.46f | 123.650f | 235.44d | 94.44c | 172.72de | 167.53gh | 145.59f |
| CIP-396004.225 | 353.15ab | 147.73bc | 250.44d | 250.440c | 221.09d | 345.46ab | 165.55e | 244.03f | 247.24e |
| GUDENIE | 224.35de | 192.22ab | 208.58e | 208.383d | 306.39bcd | 439.63a | 208.19bc | 318.07c | 263.23d |
| LOCAL | 267.13cd | 50.67d | 131.50f | 149.767e | 256.35cd | 45.43c | 183.18cde | 161.65h | 155.71f |
| MEAN | 318.21 | 162.18 | 243.38 | 243.4056 | 285.77 | 294.45 | 214.70 | 271.99 | 257.65 |
| CV | 13.19 | 33.01 | 9.54 | 6.22 | 18.61 | 22.21 | 9.61 | 4.046 | 5.13 |
| LSD | 72.67 | 93.45 | 39.31 | 18.898 | 90.06 | 110.76 | 34.96 | 13.738 | 11.51 |
| Range | 238.15 | 212.97 | 235.25 | 205.18 | 394.2 | 124.62 | |||
Table 5: Genotype performance over 2009 and 2010 season and combined over these years.
| Genotypes | Plant height (cm) | Main stem/plant | Late blight (%) | No of tubers/m2 | Average tuber weight (gm) | TTY (qt/ha) |
|---|---|---|---|---|---|---|
| CIP-396033.102 | 60.99cd | 4.17bc | 10.25c | 42.13e | 64.78b | 272.9b |
| CIP-392641.4 | 42.80fg | 2.54fg | 21.02a | 30.18f | 51.39c | 164.6c |
| CIP-395112.36 | 53.80e | 3.19ed | 19.41a | 50.46bc | 55.20c | 279.9b |
| CIP-396004.337 | 57.88d | 3.58d | 4.03e | 44.24de | 78.59a | 345.6a |
| CIP-395096.2 | 65.60ab | 4.39b | 6.21de | 65.32a | 53.87c | 344.2a |
| CIP-395111.13 | 44.98fg | 1.76h | 4.16e | 50.47bc | 44.08d | 252.6b |
| CIP-395011.2 | 58.13d | 2.27g | 6.82de | 44.52de | 73.70a | 323.8a |
| CIP-396031.108 | 65.87a | 3.49d | 8.39cd | 48.31cd | 66.66b | 322.6a |
| CIP-396029.250 | 41.55g | 3.42de | 21.17a | 30.31f | 53.91c | 156.4c |
| CIP-396004.225 | 62.02bc | 3.68cd | 6.48de | 52.53bc | 49.67cd | 257.1b |
| GUDENIE | 60.53cd | 4.92a | 8.77cd | 51.90bc | 53.28c | 269.9b |
| LOCAL | 45.56f | 2.87ef | 14.64b | 55.11b | 30.02e | 165.7c |
| Mean | 54.98 | 3.34 | 10.95 | 47.12 | 56.26 | 262.9 |
| CV (%) | 10.01 | 22.90 | 43.16 | 15.98 | 17.50 | 17.60 |
| LSD (5%) | 3.62 | 0.50 | 3.11 | 4.96 | 6.48 | 30.5 |
Table 6: Yield, agronomic and disease reaction of potato clones combined over locations and seasons.
| Genotypes | MTY (qt/ha) | Advantage over the standard check | Advantage from the local check |
|---|---|---|---|
| CIP-396033.102 | 264.6 | 0.53 | 69.94 |
| CIP-392641.4 | 153.9 | ||
| CIP-395112.36 | 275.4 | 4.63 | 76.88 |
| CIP-396004.337 | 337.7 | 28.30 | 116.89 |
| CIP-395096.2 | 335.5 | 27.17 | 115.48 |
| CIP-395111.13 | 242.5 | 55.75 | |
| CIP-395011.2 | 310.4 | 17.93 | 99.36 |
| CIP-396031.108 | 314.2 | 19.37 | 101.79 |
| CIP-396029.250 | 145.6 | ||
| CIP-396004.225 | 247.2 | ||
| GUDENIE | 263.2 | ||
| LOCAL | 155.7 |
Table 7: Mean marketable tuber yield and yield advantage of potato clones across locations.
The two genotypes CIP-396004.337 and CIP-395062.2 were the two superior genotypes that produced the highest tuber yield as well as the lowest late blight percentage. There for, these clones are selected as a candidate for variety verification trial of 2012 year for release to maximize potato yield in the country. At appropriate stage we invited technical committee to see the field performance of candidate clones across Adet, Holleta and Kulumsa location. During this trial stage, the maximum mean on-station as well as on-farm tuber yield was obtained from clone CIP-396004.337 (Table 8). The mean on-station and onfarm of tuber yield (qt/ha) of clone CIP-396004.337 were ranged from 332.80 (Holleta) to 472.50 (Kulumsa) and 243.90 (Holleta) to 460 (Kulumsa), respectively. This clone, also showed minimum late blight score (Table 8). It also had better mineral and starch content (Table 8). This result assures that clone CIP-396004.337 is one of the potential variety to bust production in the country.
| Genotype | Total tuber yield (tons/ha) | Late blight score (%) | Dry matter content (%) | Starch yield (t/ha)* | Mineral content (mg/kg)* | |||||||
|---|---|---|---|---|---|---|---|---|---|---|---|---|
| Adet | Holleta | Kulumsa | ||||||||||
| On-Station | Means across on- farms | On-Station | Means across on farms | On-Station | Means across on farms | Adet | Kulumsa | FE | ZN | |||
| CIP-396004.337 | 337.5 | 308.0 | 332.8 | 243.9 | 472.5 | 460.0 | 6 | 8.5 | 24.22 | 5.63 | 79.96 | 8.10 |
| CIP-395096.2 | 292.5 | 281.0 | 321.0 | 223.1 | 267.9 | 266.2 | 17 | 10 | 22.50 | 4.21 | 32.98 | 10.8 |
| Gudenie | 270.0 | 213.5 | 314.8 | 226.9 | 274.7 | 255.3 | 24 | 32 | 23.30 | 6.91 | 24.63 | 7.07 |
| Belete | 295.0 | 281.0 | 323.0 | 239.6 | 430.0 | 432.2 | 4 | 6 | 22.58 | 4.25 | ||
Table 8: mean total tuber yield, late blight score and quality parameters of candidates and standard checks during VVT during 2012 main season. *adapted from: Tesfaye et al. [5].
Stability analysis
GGE Biplot: The partitioning of GGE through GGE biplot analysis showed that PC1 and PC2 accounted 78.50% and 12.13% of GGE sum of squares, respectively explaining a total of 90.63% variation (Figure 1). This result revealed that there was a differential yield performance among potato genotypes across testing environments due to the presence of GEI. Genotypes that had PC1 scores>0 were identified as higher yielding and those that had PC1 scores<0 were identified as lower yielding [6]. Thus, of the tested genotypes G4, G5, G7 and G8 identified as high yielder genotypes (PC1 score>0) while G2, G9 and G12 as low yielder genotypes (PC1 score<0 (Figure 1). Unlike the PC1, PC2 was related to genotypic stability/instability. The minimum the absolute PC2 value is the more stable than the other. Thus, G7and G8 were the most stable genotypes. Similarly, among high yielder genotypes G4 also had better stability.
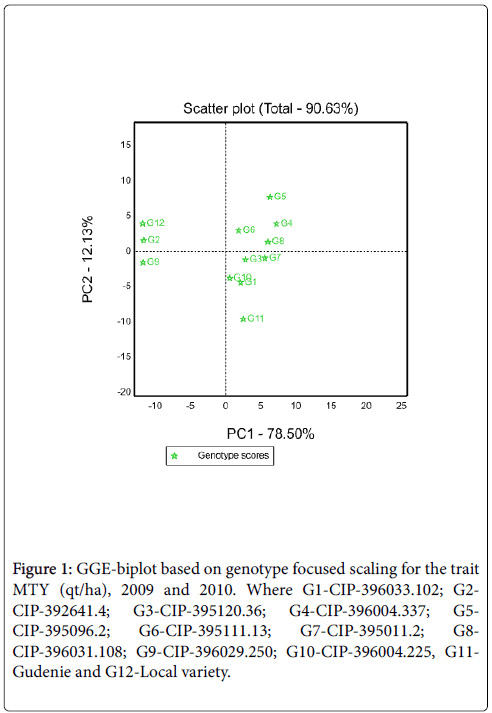
Figure 1: GGE-biplot based on genotype focused scaling for the trait MTY (qt/ha), 2009 and 2010. Where G1-CIP-396033.102; G2- CIP-392641.4; G3-CIP-395120.36; G4-CIP-396004.337; G5- CIP-395096.2; G6-CIP-395111.13; G7-CIP-395011.2; G8- CIP-396031.108; G9-CIP-396029.250; G10-CIP-396004.225, G11- Gudenie and G12-Local variety.
Mean performance and stability of potato genotypes: Figure 2 shows the AEC view of the GGE biplot. The average tester coordinate (ATC) ordinate separates genotypes with above average mean from below average means. Therefore, genotypes with above average means were from G3 to G4 on the figure, while G9, G2 and G12 were genotypes which had below average mean performance. Whereas G1, G11 and G10 were had near to average mean yield. The shorter the genotype vector is more stable than others. Thus, among tested genotypes G4 identified as maximum yielder genotype as well as better stability while G11 identified as poorly stable (long vector length) and mean yielder genotypes. Among the tested genotypes G5 identified as high yielder genotype but less stable genotype.
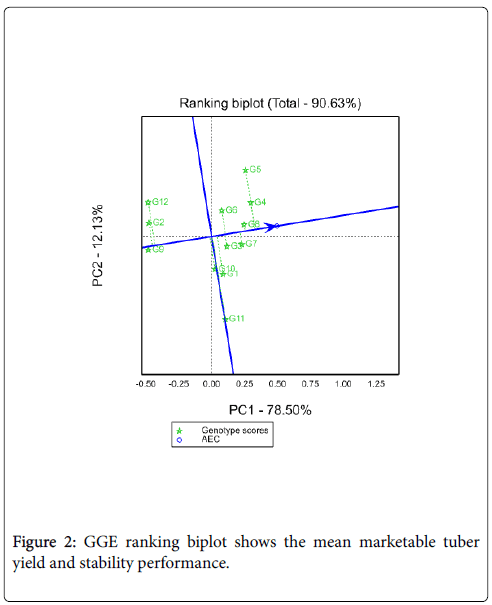
Figure 2: GGE ranking biplot shows the mean marketable tuber yield and stability performance.
Comparison of genotypes with ideal genotypes: An ideal genotype should have both high mean yield performance and high stability across environments. It is a genotype to be on average environmental coordinate (AEC) on positive direction and has vector length equal to the longest vector of the genotype on the positive side of AEC with longest vector length of high yielding genotypes and indicated by an arrow pointed to it [4,6]. Thus, Figure 3 shows that G4 nearest to the ideal genotypes (the center of concentric circles) so it is more desirable than other tested genotypes.
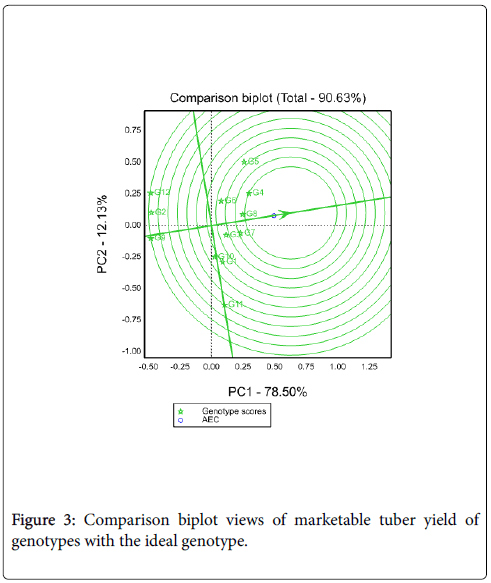
Figure 3: Comparison biplot views of marketable tuber yield of genotypes with the ideal genotype.
Suitability of genotypes for particular environment using the “Which-Won-Where” function of a GGE biplot: Figure 4 shows the which-won- Where view of this study. The vertex genotypes in this figure were G4, G5, G7, G9, G11 and G12. Four rays divide the biplot in to four sectors. Out these test environments fall in three of them. The vertex genotype for sector which encompasses E1, E2, E5 and E6 was G4 and sector content E3 was G7, for E4 was G11, these implying that these genotypes were the winning genotypes for respected environments. However, Which-won-where views of the GGE biplot of each year was repeated across years (Figure 5). In this case GE can be exploited by recommending specific genotype to specific locations [7]. Thus, G4 can be recommended to Adet and Kulumsa and G7/11 for location Holleta.
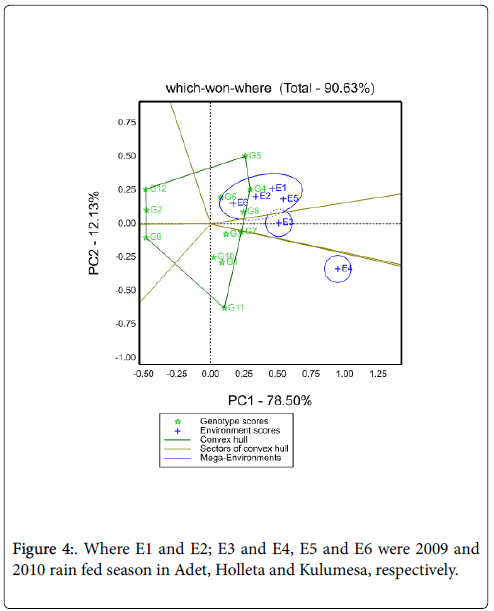
Figure 4: Where E1 and E2; E3 and E4, E5 and E6 were 2009 and 2010 rain fed season in Adet, Holleta and Kulumesa, respectively.
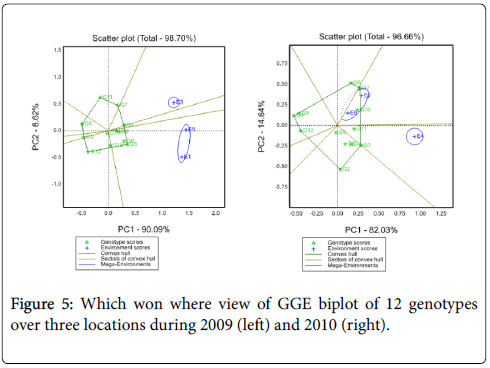
Figure 5: Which won where view of GGE biplot of 12 genotypes over three locations during 2009 (left) and 2010 (right).
AMMI’s stability value (ASV): AMMI’s stability value (ASV) was calculated using the following formula, as suggested by Purchase [8].

Where, ASV=AMMI’s stability value, SS=Sum of Squares, IPCA1=Interaction of Principal Component Analysis one, IPCA2=Interaction of Principal Component Analysis two IPCASS1 and IPCASS2 are engine values Sum of squares of PCA 1 and PCA2 respectively.
The AMMI stability value (ASV) [8] based on the AMMI model‘s IPCA1 and IPCA2 scores for each genotype was also computed. The larger the IPCA scores, either negative or positive, the more specifically adapted a genotype is to a certain environments; the smaller the IPCA scores, the more stable the genotype is over all environments studied. Stability in performance of genotypes across locations and seasons (2009 and 2010 rainfed seasons) using ASV for MTY was performed (Table 9). During 2009 season, clone CIP-395112.36 identified as stable while Gudenie was identified as the most unstable variety. Whereas during 2010 season as well as combined over seasons and locations analysis identified, CIP-396004.337 and clone Local variety as stable and unstable clones, respectively.
| Genotype | 2009 season | 2010 season | Combined over locations | ||||||||||||
|---|---|---|---|---|---|---|---|---|---|---|---|---|---|---|---|
| Genotype mean | IPCA1 | IPCA2 | ASV | RANK | Genotype mean | IPCA1 | IPCA2 | ASV | RANK | Genotype mean | IPCA1 | IPCA2 | ASV | Rank | |
| 1 | 238.9 | 0.57 | -0.32 | 3.26 | 2 | 292.7 | 4.80 | 0.49 | 32.37 | 7 | 265.8 | -4.79 | 0.18 | 16.08 | 7 |
| 2 | 130.2 | 0.62 | -0.53 | 3.59 | 4 | 177.5 | -8.53 | -0.28 | 57.52 | 11 | 153.9 | 8.28 | 2.90 | 27.95 | 11 |
| 3 | 280.2 | 0.26 | 1.98 | 2.46 | 1 | 276.7 | 3.43 | 0.82 | 23.16 | 5 | 278.4 | -3.11 | -3.28 | 10.96 | 4 |
| 4 | 314.5 | -0.60 | -4.63 | 5.76 | 5 | 361 | 0.54 | -4.04 | 5.42 | 1 | 337.7 | -0.75 | 2.63 | 3.64 | 1 |
| 5 | 329.5 | 3.56 | -3.49 | 20.61 | 9 | 340.8 | -1.71 | -4.18 | 12.23 | 3 | 335.1 | 2.08 | -1.21 | 7.08 | 3 |
| 6 | 291 | 0.60 | -0.56 | 3.48 | 3 | 278.7 | -1.06 | 7.88 | 10.63 | 2 | 284.8 | 1.39 | -4.95 | 6.81 | 2 |
| 7 | 288.8 | -5.19 | 1.59 | 29.69 | 11 | 332 | 2.88 | -4.60 | 19.94 | 4 | 310.4 | -3.44 | 4.11 | 12.25 | 6 |
| 8 | 315.5 | 2.73 | 1.96 | 15.72 | 7 | 313.2 | 3.66 | -0.63 | 24.68 | 6 | 314.3 | -3.10 | -4.04 | 11.18 | 5 |
| 9 | 123.7 | -2.28 | 1.07 | 13.08 | 6 | 167.5 | -6.48 | 1.05 | 43.72 | 9 | 145.6 | 6.02 | 3.22 | 20.49 | 9 |
| 10 | 250.4 | 3.24 | 0.14 | 18.49 | 8 | 244 | 5.16 | 2.97 | 34.94 | 8 | 247.2 | -4.49 | -5.86 | 16.17 | 8 |
| 11 | 208.4 | -7.36 | -0.36 | 42.03 | 12 | 318.1 | 6.64 | 0.48 | 44.76 | 10 | 263.2 | -7.71 | 7.31 | 26.92 | 10 |
| 12 | 149.8 | 3.86 | 3.16 | 22.25 | 10 | 161.7 | -9.33 | 0.04 | 62.93 | 12 | 155.7 | 9.62 | -1.01 | 32.35 | 12 |
Table 9: AMMI stability value (ASV) with the IPCA 1 and IPCA 2 scores, mean marketable tuber yield and ranks of 12 clones during 2009, 2010 and combined over all environments.
Conclusion
During variety releasing committee meeting, the technical committee report was in line with our submitted data. However, both candidate clones have similar merits variety releasing committee accept the release of CIP-366004.337 clone as a new variety with local name of 'Dagem' during April, 2013 meeting at Addis Ababa.
Acknowledgements
We would like to extend sincere gratitude to Mr. Wubet, Mr. Melaku and Mr. Zewuge for their unreserved technical assistance during field work and data compilation of these trials. We also thank Ethiopia Institute of Agriculture Research (EIAR) for full budget support.
References
- Horton D (1980) The potato as a food crop in the developing countries. A bulletin of the international potato centre, Lima, Peru, p: 30.
- Genstat (2013) GenStat 16th Edition (Version-16.2.0.11713). VSN International ltd.
- Kaya Y, Akcura M, Taner S (2006) GGE-biplot analysis of multi-environment yield trials in breed wheat. Turk J Agric 30: 325-337.
- Abebe T (2013) Evaluation of diversity among potato (Solanum tuberosum L.) cultivars in ethiopia based on morphological characteristics and SSR markers. Ph D Thesis, Kasetsart University, p: 201.
- Yan W, Tinker NA (2006) Biplot analysis of multi-environment trial data: principles and applications. Can J of Plant Sci 86: 623-645.
- Yan W, Kang MS, Woods S, Cornelius PL (2007) GGE biplot vs AMMI analysis of genotype by environment data. Crop Sci 47: 643-655.
- Purchase JL (1997) Parametric analysis to describe genotype x environment interaction and yield stability in winter wheat. Ph D thesis, Department of agronomy, Faculty of agriculture of the University of the Free State, Bloemfontein, South Africa, p: 223.
Citation: Worku A, Mulugeta G, Berhun B, Abebe T, Giorgis G, et al. (2018) Performance and Yield Stability Analysis of Potato Genotypes in Ethiopia. Adv Crop Sci Tech 6: 336. DOI: 10.4172/2329-8863.1000336
Copyright: © 2018 Worku A, et al. This is an open-access article distributed under the terms of the Creative Commons Attribution License, which permits unrestricted use, distribution, and reproduction in any medium, provided the original author and source are credited.
Select your language of interest to view the total content in your interested language
Share This Article
Recommended Journals
Open Access Journals
Article Tools
Article Usage
- Total views: 5887
- [From(publication date): 0-2018 - Nov 15, 2025]
- Breakdown by view type
- HTML page views: 4761
- PDF downloads: 1126