QTL Analysis in Aromatic Rice of Assam, India
Received: 19-Oct-2017 / Accepted Date: 22-Nov-2017 / Published Date: 25-Nov-2017 DOI: 10.4172/2375-4338.1000186
Abstract
The study was carried out to identify quantitative trait loci (QTLs) controlling 12 morphological traits in rice using a F2 derived from Ranjit and Kola Joha cross. A framework linkage map of 1387.9cM was developed using 102 SSR markers and other few markers linked to aroma. QTL analysis based on composite interval mapping identified 24 QTLs was for 12 traits. Among them two QTLs were identified for grain aroma each on chromosome 5 and chromosome 8, out of which the QTLs between Aro1-BAD2 is in similar position with aroma gene of Basmati rice. Most of the QTLs identified in the current study, showed a range of partial to over-dominance effects, indicating complexity of the traits under consideration. Some genomic regions were associated with more than one trait, indicating linkage and/or pleiotropic effects. Marker linked to the QTLs can be considered for use in marker assisted breeding as being confirmatory to other reports.
Introduction
Northeast India (NE) particularly Assam is a rich source of genetic diversity of rice [1]. The farmers of this region still use their traditional cultivars which not only suit to their taste but also provide crop security. The NE, India is also the home to many locally adapted aromatic and quality rice land races. Among the various classes of cultivated rice varieties, Assam has a unique class of scented rice, locally called as ‘Joha ’, which is very popular among the farmers of this region. Joha rice is primarily used in the social and religious festivals. The cultivation of few Joha rice land races in Assam in spite of the onslaught from new high yielding varieties, demonstrate its popularity and utility among the masses. Joha rice occupies a premium position in the local markets than other classes of rice and there is immense possibility for export of this class of rice. Except cooked grain elongation ratio, Joha cultivars of Assam have compatible aroma and quality as that of other scented rice of India. However, the class of aromatic rice has not been studied by researchers [2]. As a result of which basic genetic insights in the genetics of aroma and yield attributes are becoming a limiting factor for genetic improvement of Joha rice.
Lorieux et al. [3] reviewed the genetics of aroma and concluded that a single recessive gene was responsible for the production of aromatic rice plants. This single recessive fragrance gene (fgr ) was earlier identified to be linked to the RFLP clone RG28 on chromosome 8, at genetic distance of 4.5 cM [4]. Fine mapping and sequence analysis identified a betaine aldehyde dehydrogenase gene (BADH2) associated with the fragrant phenotype [5]. Though Talukdar et al. [6] reported the presence of similar gene for aroma in Joha rice based on association study using SSR markers, this results need confirmation to facilitate the breeders to deploy markers linked to aroma in a Joha rice improvement programme. There is complicacy in formulating the breeding programme for genetic manipulation of aroma in Joha rice due to limited knowledge in genetics of aroma and difficulty in objective assessment of aroma during selection programme. In such circumstances, QTL analysis is one of the best options to elucidate the underlying genetics of aroma and other traits in Joha rice and this will also facilitate marker aided selection of useful genes for aroma in the variety development programme for development of high yielding Joha rice.
Materials and Methods
The rice mapping population used in this study was a set of 96 F2 plants derived from a class between Ranjit , a high yielding variety of Eastern India developed by AAU, Jorhat, and Kola Joha , a popular aromatic rice landrace of Assam. F2 plants were grown in two numbers of blocks in Augmented RBD design along with parents Ranjit and Kola Joha . Data on individual plant basis were recorded for plant height (cm) , tiller number, time of heading (days), panicle length (cm), number of grains per plant, grain length (mm), grain width (mm), grain length/grain width ratio, decorticated grain length (mm), decorticated grain width (mm), decorticated grain length/grain width ratio, and yield per plant (g). Aroma in leaves of the mapping population was determined according to the method described by Sood and Siddiq [7]. The data were subjected to analysis of variance following Augmented design II [8]. Skewness (K3), the third degree statistics and Kurtosis (K4), the fourth degree statistics were estimated according to Snedecor and Cochran [9] to understand the nature of distribution of different traits as described by Fisher et al. [10] and number of genes controlling the traits as by Robson respectively [11].
Molecular marker analysis
DNA from each F2 plant was extracted from fresh leaves following the protocol of Plasckhe et al. [12] with slight modification. A total of 137 primer pairs were selected and primer sequences were obtained from Gramene (http://www.gramene.org). From these 102 SSR polymorphic markers were used for linkage map construction. Seven aromatic primers were selected for analyzing the genetic variability to aroma in F2 plants (Table 1). The amplification conditions were based on the procedure of Rathi and Sarma [13].
| S No. | Primer name | Chromosome No. | Forward sequence (5`-3`/) | Reverse sequence (5`-3`) | Reference |
|---|---|---|---|---|---|
| 1 | BADEX7-5 | 8 | TGTTTTCTGTTAGGTTGCATT | ATCCACAGAAATTTGGAAAC | [14] |
| 2 | Aro1 | 8 | CATCTATCCTCCTCGGGCAACA | GGCGGCGTCATATCCAACA | [15] |
| 3 | Aro7 | 8 | ATTTGCCTCCTGAGTCTG | GAGGATGGGGAAGATAAA | [15] |
| 4 | BAD2 | 8 | TTGTTTGGAGCTTGCTGATG | AGTGCTTTACAAAGTCCCGC | [16] |
| 5 | RM5474 | 3 | AAGTGTTGGTGAGCATAGC | TTTGTGTTTGGAGAGACGAG | [17] |
| 6 | RM282 | 3 | CTGTGTCGAAAGGCTGCAC | CAGTCCTGTGTTGCAGCAAG | [17] |
| 7 | RM223 | 8 | GAGTGAGCTTGGGCTGAAAC | GAAGGCAAGTCTTGGCACTG | [18] |
Table 1: List of primers linked to aroma used in association analysis and linkage mapping.
Linkage map construction and QTL analysis
Based on the marker segregation data of polymorphic SSR loci, linkage map was constructed using software Mapmaker v 3.0 [19] with a threshold of 49 cM for mapping distance and 2.5 LOD. The recombination frequencies were converted into genetic distances using Kosambi mapping function [20].
QTL mapping was done using Composite interval mapping (CIM) using the Windows QTL Cartographer 2.5 [21]. A LOD score of 3.0 was taken as criteria to define a putative QTL. The relative contribution of a genetic component (R2) was calculated as the proportion of the phenotypic variation explained (PVE). The QTLs explaining more than 20 per cent phenotypic variation were considered as major QTLs. The additive effects and R2 of the detected QTL were estimated by the Zmapqtl procedure inbuilt in the QTL Cartographer. The linkage map diagram showing the QTLs positions was generated using MapChart [22]. Average levels of dominance (h) were estimated using the ratio dominance (d)/additive effects (a) [23]. Gene action was determined on the basis of the average level of dominance by using the criteria of Stuber et al. [23]: additive (A)=0 to 0.20; partial dominance (PD)=0.21 to 0.80; dominance (D)=0.81 to 1.20; and over dominance (OD)>1.20.The naming for loci with significant additive effect followed the rules of nomenclature [24], while for the loci with non-significant additive effect and significant epistatic effect, the first letter ‘q’ was omitted contrasting with those foregoing loci.
Results and Discussion
Genetic variability among F2 population
The analysis of variance for F2 population (Table 2) of the Ranjit X Kola Joha cross revealed the existence of significant variation among F2 lines for all the characters except for plant height, grain width and yield/plant. Parents differed significantly from segregating lines which might be due to recombination of genes from both parents.
| SSR Markers | Linkage group | ||||||||||||
|---|---|---|---|---|---|---|---|---|---|---|---|---|---|
| Chromosome no | 1 | 2 | 3 | 4 | 5 | 6 | 7 | 8 | 9 | 10 | 11 | 12 | Total |
| Total marker surveyed | 15 | 9 | 10 | 9 | 14 | 12 | 10 | 19 | 10 | 8 | 12 | 8 | 136 |
| Monomorphic makers | 3 | 1 | 2 | 2 | 4 | 1 | 2 | 2 | 1 | 0 | 1 | 2 | 21 |
| Polymorphic markers | 12 | 8 | 8 | 7 | 10 | 10 | 8 | 17 | 9 | 8 | 11 | 6 | 114 |
| Percent polymorphism | 80 | 88.9 | 80 | 77.8 | 71.4 | 83.3 | 80 | 89.5 | 90 | 100 | 91.7 | 75 | 83.8 |
| Marker used for map construction | 9 | 8 | 7 | 6 | 9 | 9 | 7 | 14 | 9 | 8 | 10 | 6 | 102 |
Table 2: SSR markers used for map construction in the F2 lines of the cross Ranjit x Kola Joha.
Trait distribution pattern
In this present investigation all the traits under study showed transgressive segregation. Most of the characters showed asymmetrical distribution rather than normal distribution compared to parents in Table 2. They are positively or negatively skewed. According to Rieseberg et al. [25], transgressive segregation resulted from recombination between parental lines that possess quantitative trait loci (QTLs) with antagonistic effects (i.e. QTLs with effects that are in the opposite direction to parental differences for those traits). Transgressive segregation provides an opportunity for the production of extreme phenotypes at both above and below the species level and helps in adaptive evolution and speciation. Transgressive segregation observed in the F2 population offers scope of identifying desirable segregants to develop improved breeding lines as varieties.
The gene action for the quantitative traits in the segregating generations was found out based on the frequency distribution of traits through third and fourth order statistics viz., skewness and kurtosis. Kurtosis which is always negative or near to zero in the absence of gene interaction and positive only in the presence of gene interaction [26-28]. For a normal distribution, skewness is equal to zero in the absence of gene interaction, while it is greater and smaller than zero in the presence of complementary and duplicate gene interactions, respectively. In a frequency distribution of a segregating generation, Skewness could result when certain combinations of genes are lethal, presence of incomplete linkage of certain genes, presence of epistasis and one gene has a much larger effect than others [29]. Accordingly, complementary gene interaction might be attributed for traits plant height, no of grains/panicle, grain length/grain width, decorticated grain length/decorticated grain width and grain yield/plant in the F2 population in this study (Table 2).
Similar findings were also reported by Ashwini et al. [30] in rice, warranting intense selection is needed for those traits with complementary gene action [31]. Duplicate gene interaction with equal frequencies of positive and negative alleles was observed for traits tiller number/plant, grain length, and time of heading. The positive values of kurtosis indicates leptokurtic curve and negative kurtosis indicates platykurtic curve [32]. In this study, except grain length, remaining all the significant characters showed leptokurtic distribution. Traits showing leptokurtic distribution are usually under the control of few segregating genes and traits showing a platykurtic distribution usually represent characters that are controlled by many genes [29]. This indicated that the genetic control of grain length in the F2 mapping population might be under the control of many genes and those remaining traits showing leptokurtic distribution might be considered under the control of few segregating genes.
Negatively skewed and leptokurtic distribution are considered as an evidence for involvement of fewer number of dominant genes [31] with increasing effects, and also coefficient of skewness significantly deviates from zero indicating presence of duplicate gene interaction for inheritance of traits [33]. Maximizing the genetic gain in respect of these traits with negatively skewed distribution requires mild selection from the existing variability [31].
The results on gene interaction in this study needs to be further confirmed with more detailed genetic analyses like, diallel analysis, generation mean analysis etc. due to the exploratory nature of third degree and fourth degree statistics.
QTL mapping
The linkage map was constructed using software Mapmaker v 3.0 [19]. The molecular linkage map was consisted of 102 SSR markers and seven markers linked to aroma covering total genetic distance 1387.9 cM with an average distance of 13.6 cM between adjacent markers (Figure 1). The details of the number of polymorphic markers given in Table 3 showed that the chromosome-wise total number of polymorphic SSR marker per loci ranged from 6 to 12. Comparison of the resulting linkage map and the maps of the Chen et al. [34], Temnykh et al. [18] and McCouch et al. [35] showed that all markers were located in the expected order on the chromosomes.
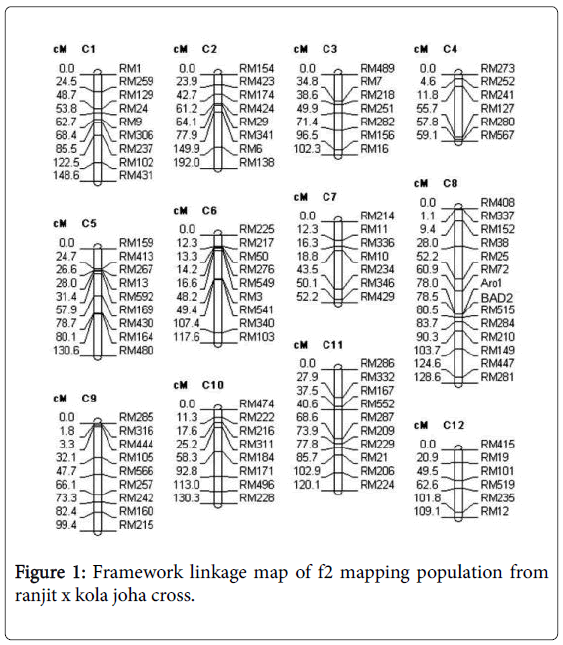
Figure 1: Framework linkage map of f2 mapping population from ranjit x kola joha cross.
| Block (ignoring Treatments) | Treatment(eliminating Blocks) | Parents | Entries (ignoring Blocks) | Plants | Parents vs. plants | Error | Range | Skewness (K3) | Kurtosis (K4) | Mean ± std.error | |
|---|---|---|---|---|---|---|---|---|---|---|---|
| df | 2 | 95 | 1 | 95 | 93 | 1 | 2 | ||||
| Plant height | 41.23 | 190.26 | 1362.94* | 189.49 | 120.01 | 5476.94** | 23.51 | 91.542 - 157.217 | 0.593* | 1.476* | 122.003 ± 1.302 |
| Tiller no. | 16.03* | 26.88** | 4.17 * | 27.19** | 27.64 ** | 8.64 * | 0.17 | 3.167 - 32.667 | -0.16 | 0.462 | 16.385 ± 0.531 |
| Panicle length/ plant | 6.11* | 8.87* | 75.40** | 8.94* | 7.56* | 70.86** | 0.11 | 17.552 - 31.537 | 0.304 | 0.176 | 25.493 ± 0.306 |
| No. of grains | 140.74 | 423.96 | 28.17 | 425.84 | 244.51 | 17687.04** | 26.17 | 94.000 - 161.500 | 0.646* | 1.075* | 131.724 ± 1.832 |
| Grain Length (GL) | 0.24 | 0.60* | 0.95* | 0.60* | 0.60* | 0.68* | 0.02 | 6.412 - 9.777 | -0.178* | -0.823 | 8.155 ± 0.084 |
| Grain width (GW) | 0.02 | 0.04 | 0.05 | 0.05 | 0.05 | 0.03 | 0.01 | 1.977 - 3.037 | -0.457 | 2.227* | 2.466 ± 0.022 |
| GL/GW Decorticated Grain Length(LDG | 0.18 | 0.2 | 0.02 | 0.2 | 0.2 | 0.38 | 0.03 | 2.780 - 4.580 | 1.178* | 1.886* | 3.333 ± 0.046 |
| Decorticated Grain Length (LDG) | 0.04 | 0.47 | 0.17 | 0.47 | 0.46 | 1.65* | 0.05 | 5.000 - 8.000 | 0.166 | -0.306 | 6.030 ± .069 |
| Decorticated Grain Width (WDG) | 0.06* | 0.04* | 0 | 0.04* | 0.04* | 0.14** | 0 | 1.467 - 2.142 | 0.347 | 1.654* | 1.991 ± 0.021 |
| LDG/ WDG | 0.24* | 0.26* | 0.01 | 0.26* | 0.25* | 1.35** | 0 | 1.881 - 4.494 | 1.066* | 1.548* | 3.050 ± 0.051 |
| Time of heading | 278.30* | 44.71 | 4.17 | 50.46 | 48.69 | 259.88 | 4.67 | 110.000 - 133.000 | -6.873* | 58.492* | 122.583 ± 1.454 |
| Yield/plant (g) | 0.04 | 0.19 | 0.15 | 0.19 | 0.11 | 7.88** | 0.02 | 20.74 - 38.95 | 0.633* | 1.104* | 2.847 ± 0.039 |
Table 3: Analysis of variance for yield and yield attributing characters for F2 population derived from Ranjit x Kola Joha cross along with third degree and forth degree statistics.
Among the traits studied, tiller number/plant, panicle length, grain width, decorticated grain length, and decorticated grain width were normally distributed while remaining traits including aroma showed skewed distribution. Thus before QTL analysis log transformation was used to normalize the data. A total of 25 QTLs affecting 12 morphological as well as grain quality traits were identified by QTL cartographer software using its composite interval mapping (CIM) function at 3.0 cut off LOD score (Table 4). The two QTLs for plant height identified each on chromosomes 1 and 10, showed a positive additive effect contributed by parent Ranjit . The QTL on chromosome 10 exhibited dominance for plant height and the QTL on chromosome 1 for the same trait showed overdominance gene action towards increased or decreased plant height.
| Characters | Chromosome | Marker Interval | QTL name | QTL Position | LOD Score | Additive effect(a) | Dominant effect(d) | Gene action (d/a) | % of variation |
|---|---|---|---|---|---|---|---|---|---|
| Plant Height | 1 | RM9-RM306 | plh_cim1-1 | 68.41 | 3.172 | 2.572 | 6.695 | OD | 17.3 |
| 10 | RM184-RM171 | plh_cim10-1 | 67.31 | 4.034 | 6.708 | -6.352 | D | 11.986 | |
| Tiller No. | 12 | RM101-RM519 | tn_cim12-1 | 49.51 | 3.284 | -1.318 | -3.302 | OD | 5.3 |
| Panicle Length | 10 | RM184-RM171 | pl_cim10-1 | 59.31 | 4.353 | 0.944 | -1.862 | OD | 9.667 |
| 12 | RM415-RM19 | pl_cim12-1 | 12.01 | 3.435 | 1.873 | 0.837 | PD | 11.43 | |
| Grain No. / panicle | 5 | RM267-RM13 | gn_cim5-1 | 26.61 | 4.33 | 5.22 | 10.81 | OD | 3.6 |
| 10 | RM184-RM171 | gn_cim10-2 | 69.31 | 3.639 | 6.39 | -16.73 | OD | 9.341 | |
| Grain Length(GL) | 9 | RM444-RM105 | gl_cim9-1 | 19.31 | 3.493 | -0.095 | 1.24 | OD | 14.501 |
| Grain Width ( GW) | 1 | RM237-RM102 | gw_cim1-1 | 105.51 | 14.597 | -0.494 | -0.008 | A | 17.671 |
| 2 | RM341-RM6 | gw_cim2-1 | 121.91 | 5.327 | 0.234 | 0.266 | D | 3.02 | |
| 5 | RM159-RM413 | gw_cim5-1 | 24.71 | 3.388 | -0.016 | 0.149 | OD | 9.162 | |
| Decorticated Grain Length(LDG) | 9 | RM444-RM105 | dgl_cim9-1 | 25.31 | 3.579 | 0.13 | 0.761 | OD | 2.3 |
| Decorticated Grain Width(WDG) | 10 | RM171-RM496 | dgw_cim10-2 | 99.81 | 3.332 | 0.096 | 0.137 | OD | 1.109 |
| LDG/WDG | 8 | RM447-RM281 | dglwr_cim8-1 | 125.61 | 3.902 | -0.293 | -0.251 | D | 5.534 |
| Time of Heading | 2 | RM341-RM6 | fl_cim2-1 | 102.91 | 10.155 | 7.152 | 6.565 | D | 11.653 |
| 3 | RM156-RM16 | fl_cim3-1 | 98.51 | 4.602 | -3.083 | 6.105 | OD | 4.179 | |
| 5 | RM169-RM430 | fl_cim5-3 | 68.91 | 5.513 | -0.31 | 10.807 | OD | 9.537 | |
| 6 | RM541-RM340 | fl_cim6-2 | 77.41 | 7.475 | 6.343 | 8.006 | OD | 9.723 | |
| 7 | RM10-RM234 | fl_cim7-1 | 32.81 | 6.527 | 6.566 | 7.68 | D | 4.797 | |
| 10 | RM184-RM171 | fl_cim10-1 | 76.31 | 4.093 | 5.538 | 8.738 | OD | 4.566 | |
| 11 | RM552-RM287 | fl_cim11-1 | 53.61 | 4.242 | -1.231 | 13.457 | OD | 3.242 | |
| Yield/Plant | 5 | RM267-RM13 | yld_cim5-1 | 26.61 | 4.33 | 0.113 | 0.234 | OD | 5.932 |
| Aroma | 5 | RM169-RM430 | aro_cim5-2 | 57.91 | 3.296 | 0.035 | 0.572 | OD | 3.084 |
| 8 | Aro1-BAD2 | aro_cim8-2 | 78.51 | 16.312 | -1.108 | -0.567 | PD | 17.687 |
Table 4: QTLs for different characters through Composite Interval Mapping (CIM) in F2 mapping population of Ranjit x Kola Joha and their genetic effects.
Rice chromosome 1 harbour the semi-dwarf gene sd-1 for plant height [36]. The QTL detected in this study on chromosome 1 explained largest amount of variation amongst the QTLs for plant height detected and its allelic contribution was from semi-dwarf variety Ranjit . The QTLs detected on chromosomes 1 in the present study might be considered as confirmation to the QTL detected by earlier reports [37,38]. So this QTL may be regarded as the same with Sd-1 . However, the allelic relationship with Sd-1 could not be explained from this study. The QTLs detected on chromosomes 1 in the present study might be considered as confirmation to the QTL detected by earlier reports [37,38]. Since, no information of QTL for plant height on chromosome 10 was reported earlier, so the QTL on chromosome 10 in this study may be considered as novel located in Joha rice warranting further investigation.
For tiller number one QTL was identified on chromosome 12. A total of 14 QTLs that significantly influenced tiller number were reported on rice chromosomes 1, 2, 4, 5, 6, 7, 8 and 10 by Bian et al. [39](2013) in Japonica rice. The QTLs for tiller number on chromosome 12 identified in this study needs further investigation, since available reports do not indicate existence of such QTL for tiller number on chromosome 12.
Two QTLs detected for panicle length on chromosomes 10 and 12 showed positive additive effect contributed by Ranjit . The QTL on chromosome 10 exhibited partial dominance gene action while QTLs on chromosome 12 exhibited overdominace. In previous research, QTLs for panicle length were reported on chromosome 8 [40,41], chromosome 9 [40-42], chromosomes 2, 4, 11, and 12 [43] chromosomes 3,6,10 [44], chromosomes 2, 8, 9, 10, 11 and 12 [38]. Thus the tqo QTLs detected in this study confirmed the presence of QTLs for tiller number on chromosomes 10 and 12 as reported by others.
Grain number per panicle is an important quantitative trait directly contributing towards yield. In this study two QTLs for grain number per panicle were identified in chromosome 5 and chromosome 10. Both the QTLs for gains per panicle showed positive additive effect which indicated the contribution of parent Ranjit to this trait and showed overdominance gene action. For grains per panicle earlier reported QTLs on chromosomes 1, 2, 3, 4, 5, 6, 9, 11, and 12 [38,40-47] in rice. The presence of QTL for grains per panicle on chromosomes 5 might be similar to that reported in available literature. Since, no information of QTL for grains per panicle on chromosome 10 was reported earlier, so the QTL on this chromosome in this study may be considered as novel located in Joha rice which needs further investigation.
The lone QTL for grain length detected on chromosome 9 in the marker interval RM444-RM105 was responsible for 14.50 per cent variation with an additive effect. Earlier, Tsunematsu et al. [48] mapped two QTLs for grain length on chromosomes 3 and 7. The presence of a QTL for grain length on chromosome 7 was detected by several workers [49-51]. However, Redona and Mackill [50] detected additional QTLs for grain length on chromosome 3. Five QTLs were identified for grain length on chromosomes 2, 3, 5, 7 and 8 by Rabiei et al. (2004) [50] in Iranian rice. However, the presence of QTL for grain length on chromosome 9 is not confirmed by available literature. Since, no information of QTL on chromosome 9 was reported, the present QTL may be considered as novel located in Assam rice.
For grain width three QTLs were detected each on chromosomes 1, 2 and 5 by composite interval mapping. The QTL on chromosome 1 had the highest the highest LOD score contributing 17 per cent to the trait variation, with a negative additive effect contributed by parent Kola Joha . Two QTLs for grain width on chromosomes 5 and 9 were detected by Tsunematsu et al. [48]. Rabiei et al. [52] detected Seven QTLs were mapped for grain breadth on chromosome 2, 3, 5, 6, 7, 8 and 9. Ya-dong et al. [53] detected six grain width QTLs of which, three were on chromosome 2, two on chromosome 5 and one on chromosome 9. Wan et al. [54] also reported the presence of QTLs for this trait on chromosomes 1, 5 and 9. Our results were confirmatory to those reported by other workers.
Single QTL was identified for decorticated grain length by composite interval mapping on chromosome 9 in the marker interval RM444-RM105 was responsible for 2.30% variation. Similarly, single QTL for decorticated grain width on chromosome 10 in the marker interval RM171-RM496 respectively. Only one QTL was detected for decorticated grain length /decorticated grain width by composite interval mapping on chromosome 8 in the marker interval RM447- RM281 was responsible for 5.534% of variation. Rabiei et al. [52] have identified two major QTLs for grain shape on chromosomes 3 and 8, which coincided with the major QTLs for grain length and grain breadth.
Seven significant QTLs for flowering time, which altogether explained for 50 per cent of variation in flowering time in the mapping population. Despite showing no difference in flowering time between parents, detection of many QTLs suggested the existence positive and negative alleles in both parents. The QTL for flowering time on chromosome 2 was a major QTL with LOD score of 10.15 for 11.65% of variation with a positive additive effect of 7 days towards reduced flowering days. The QTL on chromosome 6 has been identified between at 77.4 cM explains minor variation of 0.7%, since there is a major gap in between the RM541 and RM340. Through Association mapping in Joha rice of Assam, Talukdar et al. [6] identified eight QTLs to be associated with the time of heading on chromosomes 3, 5, 7, 8, 10 and 12, and among which the QTL linked to chromosome 3 explained the highest variation. Using F2 and BIL populations of cross Nipponbare /Kasalath (NK), eight QTLs for heading date, Hd1–Hd5, Hd7, Hd8 and Hd11, were detected [55](Yano et al., 1997). The same group later detected six more QTLs including Hd6 [56], Hd9 [57], Hd10 and Hd12– Hd14 [58]. Bian et al. [39] identified QTLs for heading time on chromosome 1, 4, 5, 6, 10 and 12. Therefore the QTLs detected for flowering time in this present study might be considered as confirmation to the QTL detected by Yano et al. [55] and Bian et al. [39].
For grain yield, single QTL identified on chromosome 5 exhibited overdominance gene action towards increased grain yield. For this trait positive additive effect was contributed by parent Ranjit . From earlier findings, QTLs for grain yield were detected on chromosome 1, 2, 3, 4, 7, 8 and 12 [59], three QTLs on chromosomes 2 and 8 [38].
In this present investigation three QTLs were identified for aroma by QTL cartographer through composite interval mapping, one on chromosome 5 and two on chromosome 8, out of which the QTLs aro_cim8-1 and aro_cim8-2 were major QTLs in the marker intervals RM38-RM25 and Aro1-BAD2 respectively. A major QTL for aroma was detected in Joha rice on chromosome 8 by Talukdar et al. [6], which has been validated by the present investigation. In this study the additive effect for the major QTL showed that the aroma was contributed from the parent Kola Joha . Amarawathi et al. [51] found single QTL for aroma in each chromosome 3, 4 and two QTLs in chromosome 8 in a set of Basmati rice cross population. These indicated the potentiality of Aro1 and BAD2 marker in MAS of Joha rice.
According to MCcouch and Doerge [60], it is necessary to sacrifice population size in favor of data quality, and this trade-off meant that only QTLs with a relatively large effect could be detected. Considering these, a population size of 94 F2 individual was considered as a prelimanry study to identify QTLs. Most of the QTLs identified in the current study, showed a range of partial to overdominance effects, indicating complexity of the traits under consideration (Table 4). In most of the cases, degree of dominance was high, suggesting the importance of dominance or over dominance effects for the respective QTLs. These high levels of dominance can be related to heterosis. Therefore, these results will provide important information for further functional analysis of genes for yield and its attributing traits and aroma in rice. Again the major QTLs identified in this study can be considered in the breeding programmes for Joha rice improvement. Some genomic regions were associated with more than one trait, indicating linkage and/or pleiotropic effects. For example on chromosome 10 there are QTLs for plant height, panicle length, grain no/panicle, time of heading or there are QTLs on chromosome 5 grain no/panicle and yield/plant. The significant correlations between these traits can be explained by these genomic regions containing pleiotropic or tight linkage QTLs [61]. Few QTLs detected in this study were identified to be previously known QTL position on different chromosomes. But, it is hard to precisely compare the chromosomal location of these QTLs because of different genetic materials and lack of common markers used for mapping, and therefore additional studies are needed to clarify the allelic relationship of these QTLs.
References
- Glaszmann JC, Fautret A, Noyer JL, Feldmann P, Lanaud C (1989) Biochemical genetic markers in sugarcane. Theor Appl Genet 78: 537-543.
- Das A, Kesari TV, Rangan L (2010) Aromatic Joha Rice of Assam- A Review. Agric Rev 31: 1-10.
- Lorieux M, Petrov M, Huang N, Guiderdoni E, Ghesquière A (1996) Aroma in rice: Genetic analysis of a quantitative trait. Theor Appl Genet 93: 1145-1151.
- Ahn SN, Bollich CN, Tanksley SD (1992) RFLP tagging of a gene for aroma in rice. Theor Appl Genet 84: 825-828.
- Kovach MJ, Calingacion MN, Fitzgerald MA, McCouch SR (2009) The origin and evolution of fragrance in rice (Oryza sativa L.). Proc Nat Acad Sci United States Amer 106: 14444–14449.
- Talukdar PR, Rathi S, Pathak K, Chetia SK, Sarma RN (2017) Population structure and marker-trait association in indigenous aromatic rice. Rice Sci 24: 45-154.
- Sood BG and Siddiq EA (1978) A rapid technique for scent determination in rice. Indian J Genet Plant Breed 38: 268-271.
- Federer WT (1956) Augmented (or hoonuiaku) designs. Hawaiian Planters’ Record LV, 2: 191-208.
- Snedecor GW, Cochran WG (1967) Statistical methods. 6th Edn, Oxford and IBH Publishing Co Pvt Ltd New Delhi, India, pp 593.
- Fisher RA, Immer FR, Tedin O (1932) The genetical interpretation of statistics of the third degree in the study of quantitative inheritance. Genetics 17: 107-124.
- Robson DS (1956) Application of K4 statistics to genetic variance component analysis. Biometrics 12: 433-444.
- Plaschke J, Ganal MW, Roder MS (1995). Detection of genetic diversity in closely related bread wheat using microsatellite markers. Theor. Appl. Genet. 91: 1001-1007.
- Rathi S and Sarma RN (2012) Microsatellite diversity in indigenous glutinous rice landraces of Assam. Indian J Biotechnol 11: 23-29.
- Sakthivel K, Sundaram RM, Rani NS, Balachandran SM, Neereja CN (2009) Genetic and molecular basis of fragrance in rice. Biotechnol Adv 27: 468–473.
- Sun SX Gao FY Lu XJ Wu XJ Wang XD, et al. (2008) Genetic analysis and gene fine mapping of aroma in rice (Oryza sativa L. Cyperales, Poaceae). Genetics Mol Biol 31: 532-538.
- Bradbury LM, Fitzgerald TL, Henry RJ, Jin Q, Waters DL (2005) The gene for fragrance in rice. Plant Biotech J 3: 363-370.
- Singh R, Singh AK, Sharma TR, Singh A, Singh NK (2007) Fine mapping of aroma QTLs in Basmati rice (Oryza sativa) on chromosomes 3, 4 and 8. J Pl Biochem Biotechnol 16: 75-82.
- Temnykh S, Cartinhour S, Park W, Ayres N, Hauck N, et al. (2000) Mapping and genome organization of microsatellites in rice (Oryza sativaL.). Theor Appl Genet 100: 697-712.
- Lander ES, Green P, Abrahanson J, Barlow A, Daly MJ, et al. (1987). MAPMAKER: an interactive computing package for constructing primary genetic linkages of experimental and natural populations. Genomics 1: 174-181.
- Kosambi DD (1944) The estimation of the map distance from recombination values. Ann Eugen 12: 172-175.
- Wang S, Basten CJ, Zeng ZB (2012) Windows QTL Cartographer 2.5. Department of Statistics, North Carolina State University, Raleigh, NC.
- Voorrips RE (2002) MapChart: Software for the graphical presentation of linkage maps and QTLs. The Journal of Heredity 93: 77-78.
- Stuber CW, Edwards MD, Wendel JF (1987) Molecular-markerfacilitated investigations of quantitative trait loci in maize. II. Factors influencing yield and its component traits. Crop Sci 27: 639-648.
- Rieseberg LH, Widmer A, Arntz MA, Burke JM (2003) Directional selection is the primary cause of phenotypic diversification. Proc Natl Acad Sci USA 99: 12242-12245.
- Pooni HS, Jinks JL, Cornish MA (1977) The causes and consequences of non-normality in predicting the properties of recombinant inbred lines. Heridity 38: 329-338.
- Choo TM and Reinbergs E (1982) Analysis of skewness and kurtosis for detecting gene interaction in a double haploid population. Crop Sci 22: 231-235.
- Kotch GP, Ortiz R, Ross WM (1992) Genetic analysis by use of potato haploid populations. Genome 35: 103-108.
- Jayaramachandran M, Kumaravadivel N, Eapen S, Kandasamy G (2010) Gene Action for yield attributing characters in segregating generation (M2) of Sorghum (Sorghum bicolor L.). Electron. J. Plant Breed 1: 802-805.
- Ashwini NR, Hittalmani S, Shashidhar, Biradar H (2011) Exploratory studies on genetic variability and genetic control for protein and micronutrient content in F4 and F5 generations of rice (Oryza sativa L.). Asian J Plant Sci 10: 376-379.
- Roy D (2000)Â Plant Breeding, Analysis and Exploitation of Variation. Alpha Science International Ltd., Pangbourne, India.
- DeCarlo LT (1997) On the Meaning and Use of Kurtosis, Psychological Methods, Copyright by the American Psychological Association, Inc 2: 292-307.
- Snape JW, Riggs TJ (1975) Genetical consequences of single seed descent in the breeding of self-pollinating crops. Heredity 35: 211-219.
- Chen X, Temnykh S, Xu Y, Cho YG, McCouch SR (1997) Development of a microsatellite framework map providing genome-wide coverage in rice (Oryza sativa L.). TAG Theoretical and Applied Genetics 95: 553-67.
- McCouch SR, Teytelman L, Xu Y, Lobos KB, Clare K, et al. (2002) Development and mapping of 2240 new SSR markers for rice (Oryza sativa L.). DNA research 9: 199-207.
- Khush GS, Kinoshita T (1991) Rice karyotype, marker genes, and linkage groups. Rice biotechnology 83-108.
- Xiao J, Li J, Yuan L, Tanksley SD (1995) Dominance is the major genetic basis of heterosis in rice as revealed by QTL analysis using molecular markers. Genetics 140: 745-754.
- Sandhu N, Jain S, Kumar A, Mehla BS, Jain R (2013) Genetic variation, linkage mapping of QTL and correlation studies for yield, root, and agronomic traits for aerobic adaptation. BMC genetics 14: 104.
- Bian J, He H, Shi H, Zhu C, Peng X, et al. (2013) Dynamic QTL detection and analysis of tiller number before and after heading in'japonica'rice. Australian Journal of Crop Science 7: 1189-1197.
- Marri PR, Sarla N, Reddy LV, Siddiq EA (2005) Identification and mapping of yield and yield related QTLs from an Indian accession of Oryza rufipogon. BMC genetics 6: 33.
- Thomson MJ, Tai TH, McClung AM, Lai XH, Hinga ME, et al. (2003) Mapping quantitative trait loci for yield, yield components and morphological traits in an advanced backcross population between Oryza rufipogon and the Oryza sativa cultivar Jefferson. Theoretical and applied genetics 107: 479-93.
- Septiningsih EM, Prasetiyono J, Lubis E, Tai TH, Tjubaryat T, et al. (2003) Identification of quantitative trait loci for yield and yield components in an advanced backcross population derived from the Oryza sativa variety IR64 and the wild relative O. rufipogon. Theoretical and applied genetics 107: 1419-1432.
- Ahamadi J, Fotokian MH, Fabriki-Orang S. Detection of QTLs influencing panicle length, panicle grain number and panicle grain sterility in rice (Oryza sativa L.). J Crop Sci Biotech 11: 163-170.
- Brondani C, Rangel P, Brondani R, Ferreira M (2002) QTL mapping and introgression of yield-related traits from Oryza glumaepatula to cultivated rice (Oryza sativa) using microsatellite markers. Theoretical and Applied Genetics 104: 1192-1203.
- Moncada P, Martinez CP, Borrero J, Châtel M, Gauch Jr H, et al. (2001) Quantitative trait loci for yield and yield components in an Oryza sativa× Oryza rufipogon BC2F2 population evaluated in an upland environment. TAG Theoretical and Applied Genetics 102: 41-52.
- Yoon DB, Kang KH, Kim HJ, Ju HG, Kwon SJ, et al. (2006) Mapping quantitative trait loci for yield components and morphological traits in an advanced backcross population between Oryza grandiglumis and the O. sativa japonica cultivar Hwaseongbyeo. Theoretical and applied genetics 112: 1052-1062.
- Deshmukh R, Singh A, Jain N, Anand S, Gacche R, et al. (2010) Identification of candidate genes for grain number in rice (Oryza sativa L.). Functional & integrative genomics 10: 339-347.
- Tsunematsu H, Yoshimura A, Harushima Y, Nagamura Y, Kurata N, et al. (1996) RFLP framework map using recombinant inbred lines in rice. Japanese Journal of Breeding 46: 279-284.
- Lin YR, Schertz KF, Paterson AH (1995) Comparative analysis of QTLs affecting plant height and maturity across the Poaceae, in reference to an interspecific sorghum population. Genetics 141: 391-411.
- Redona ED, Mackill DJ (1998) Quantitative trait locus analysis for rice panicle and grain characteristics. TAG Theoretical and Applied Genetics 96: 957-963.
- Amarawathi Y, Singh R, Singh AK, Singh VP, Mohapatra T, et al. (2008) Mapping of quantitative trait loci for basmati quality traits in rice (Oryza sativa L.). Molecular Breeding 21: 49-65.
- Rabiei B, Valizadeh M, Ghareyazie B, Moghaddam M, Ali AJ (2004) Identification of QTLs for rice grain size and shape of Iranian cultivars using SSR markers. Euphytica 137: 325-332.
- Zhang YD, Zhang YH, Dong SL, Tao CH, Zhao QY, et al. (2013) QTL mapping for grain size traits based on extra-large grain rice line TD70. Rice Science 20: 400-406.
- Wan X, Weng J, Zhai H, Wang J, Lei C, et al. (2008) Quantitative trait loci (QTL) analysis for rice grain width and fine mapping of an identified QTL allele gw-5 in a recombination hotspot region on chromosome 5. Genetics 179: 2239-2252.
- Yano M, Harushima Y, Nagamura Y, Kurata N, Minobe Y, et al. (1997) Identification of quantitative trait loci controlling heading date in rice using a high-density linkage map. TAG Theoretical and Applied Genetics 95: 1025-1032.
- Yamamoto T, Lin H, Sasaki T, Yano M (2000) Identification of heading date quantitative trait locus Hd6 and characterization of its epistatic interactions with Hd2 in rice using advanced backcross progeny. Genetics 154: 885-891.
- Lin H, Ashikari M, Yamanouchi U, Sasaki T, Yano M (2002) Identification and characterization of a quantitative trait locus, Hd9, controlling heading date in rice. Breeding Science 52: 35-41.
- Yano M, Kojima S, Takahashi Y, Lin H, Sasaki T (2001) Genetic control of flowering time in rice, a short-day plant. Plant physiology 127: 1425-1429.
- Liu T, Li L, Zhang Y, Xu C, Li X, et al. (2011) Comparison of quantitative trait loci for rice yield, panicle length and spikelet density across three connected populations. Journal of genetics 90: 377-382.
- McCough SR, Doerge RW (1995) QTL mapping in rice. Trends in Genetics11: 482-487.
- Rabiei B, Kordrostami M, Sabouri A, Sabouri H (2015) Identification of QTLs for Yield Related Traits in Indica Type Rice Using SSR and AFLP Markers. Agriculturae Conspectus Scientificus (ACS) 80: 91-99.
Citation: Sarma RN, Talukdar PR, Rathi S, Pathak K, Chetia S, et al. (2017) QTL Analysis in Aromatic Rice of Assam, India. J Rice Res 5:186. DOI: 10.4172/2375-4338.1000186
Copyright: © 2017 Sharma RN, et al. This is an open-access article distributed under the terms of the Creative Commons Attribution License, which permits unrestricted use, distribution, and reproduction in any medium, provided the original author and source are credited.
Select your language of interest to view the total content in your interested language
Share This Article
Recommended Journals
Open Access Journals
Article Tools
Article Usage
- Total views: 7352
- [From(publication date): 0-2017 - Dec 21, 2025]
- Breakdown by view type
- HTML page views: 6188
- PDF downloads: 1164