Reducing Greenhouse Gas Emissions in Rice Grown in the Mekong Delta of Vietnam
Received: 16-Jul-2018 / Accepted Date: 05-Sep-2018 / Published Date: 12-Sep-2018 DOI: 10.4172/2573-458X.1000158
Keywords: AWD; GHG emission; Mekong delta
Introduction
Rice (Oryza sativa L.) is a major food crop with more than 50 kg of rice being consumed per capita each year worldwide [1]. Much of the world rice production is found in Asia with India, China, Thailand, and Vietnam among the highest producing countries. Rice is the staple crop of Vietnam with an annual paddy production of 45.10 million metric tons and milled rice production of 29.5 million metric tons [2]. Of this total production, approximately 60-70% is grown in the Mekong Delta area where it is possible to produce three crops per year. With a growing population, a desire to develop export markets, and increasing environmental concerns, the government of Vietnam has undertaken a vigorous program to increase rice production while limiting the adverse impact this will have on the environment. To achieve this goal, several government policies were implemented since 1986 with the objective of increasing rice production area in the Mekong Delta from 1.85 million hectares in 1986 to 3.9 million hectares in 2015. This has resulted in an increase in milled rice production from 10.6 to 29.5 million tons (7% per year) over this period. To address growing concerns over the impact of rice production on the environment, coupled with possible reductions in available irrigation water, the government of Vietnam has undertaken programs that aim to address issues of greenhouse gas (GHG) emissions and diminishing water supplies. In 2015 the Viet Nam Low Carbon Rice Practice (VLCRP) project was initiated with the objectives of optimizing rice production while reducing fertilizer use and GHG emissions. Key to this program was the introduction of the 1M5R recommendation that is referred to as 1 must, 5 reductions. This program encourages farmers to use certified seed and seek reductions in fertilizer, pesticide, and water use while sowing seeds at a lower density and reduce harvest losses. A key component to this series of management changes was the implementation of alternate wetting and drying (AWD) as a management practice to reduce irrigation water use and GHG emissions. Alternate wetting and drying is a water management practice that involves flooding a field to a designated water depth than allowing the water to subside to a specific level below the soil surface, and then re-flooding the field. The number of drydowns used in this practice is dependent on the prevailing weather conditions.
When compared to maize (zia maize ) or wheat (Triticum spp), GHG emissions in rice is significantly greater when compared on a yield-scaled basis [3]. This is primarily due to significant levels of methane emissions generated while the crop is flooded. Recent research has shown that significant reductions in irrigation water use from rice fields can be achieved using the water management practice of alternate wetting and drying (AWD) [4]. At the same time it has been shown that AWD, when practiced properly, can significantly reduce methane emissions in rice fields [5-7]. Given this background, this study was initiated in the Mekong Delta of Vietnam with the objective to evaluate the feasibility of incorporating AWD water management into an on-going management package recommendation as a means of reducing GHG emissions in rice production.
Materials and Methods
Two locations in the Mekong Delta were selected for this study (Thanh Loi and Thanh Nhut): (1) Thanh Nhut village, located in Go Cong District, Tien Giang Province is about 13 km from the East Sea (the coastal area). Thanh Loi is an inland area on a fresh water alluvial plane, about 15 km from the Mekong River and 50 km in the northwest of the Can Tho city. The two sites vary in their normal cropping patterns (Table 1) and there mean annual precipitation (Figure 1). Soil samples were collected from the study fields at each site prior to the first planting (Table 2). Analysis of soil samples was carried out: soil texture (triangle method), clay content (Robinson method), Organic carbon (Walkley-black), total Nitrogen (Kjeldahl), soil pH (water extract at 1:5 ratio), and CEC (extracted at soil pH with BaCl2) [8].

Figure 1: Total annual rainfall (mm) for the Thanh Loi and Thanh Nhut locations from 2005 to 2014.
| Crop | Thanh Loi | Thanh Nhut |
|---|---|---|
| Crop 1 (DX) | Nov - Mar | Nov – Mar |
| Crop 2 (HT) | Apr – Jul | May – Sep |
| Crop 3 (TD) | Jul – Oct | Aug – Nov |
Table 1: Cropping calendar of rice production at the study areas.
| Location | pH | EC | SOM | CEC | NH4 | NO3 | TOC | NTotal | Sand | Silt | Clay |
|---|---|---|---|---|---|---|---|---|---|---|---|
| (µS/cm) | (%) | (meq/100 g) | (mg/kg) | (mg/kg) | (mg/kg) | (%) | (%) | (%) | (%) | ||
| Thanh Nhut | 5.98 | 340 | 5.40 | 19.85 | 58.51 | 3.08 | 59.04 | 0.24 | 1.94 | 48.80 | 49.02 |
| Thanh Loi | 5.30 | 249 | 8.76 | 19.90 | 57.17 | 3.60 | 57.76 | 0.33 | 4.14 | 41.47 | 54.39 |
Table 2: Soil properties at the two locations.
The study design consisted of a comparison of two base management practices or models (Tables 3 and 4). A comparison was then made between conventional (CON) management and the enhanced model using AWD water management.
| Model | Thanh Loi | Thanh Nhut | ||||
|---|---|---|---|---|---|---|
| AWD | Urea | DAP | KCl | Urea | DAP | KCl |
| Time 1 (10 DAS) | 30 | 58 | 16 | 40 | 50 | 30 |
| Time 2 (21 DAS) | 60 | 58 | 0 | 70 | 50 | 0 |
| Time 3 (45 DAS) | 45 | 23 | 40 | 0 | 70 | |
| Time 4 (75 DAS) | 15 | 23 | 20 | 0 | 0 | |
| CON | ||||||
| Time 1 (8 DAS) | 51 | 77 | 0 | 60 | 50 | 30 |
| Time 2 (21 DAS) | 67 | 54 | 20 | 90 | 50 | 0 |
| Time 3 (39 NSS) | 35 | 39 | 25 | 50 | 0 | 70 |
| Time 4 (71 NSS) | 25 | 15 | 20 | 0 | 0 | |
Table 3: Fertilizer rates and times each fertilizer was applied for each model and site.
| Seed rate (kg/ha) | Thanh Loi | Thanh Nhut |
|---|---|---|
| AWD | 120 | 120 |
| CON | 200 | 170 |
Table 4: Seed rate for each treatment at both locations.
Management common to both models
After harvest of the previous crop, rice straw was partly burned (about 60% was burnt and 40% straw remaining). After burning, the field was harrowed and puddled. Rice was sown on a saturated soil; in some cases the field was flooded with 1-2 cm of water prior to sowing. At 15 days prior to harvest the fields were drained.
Water depth above and below the soil level in all fields was measured weekly using a 10 cm diameter PVC pipe that was installed at 20 cm below the soil surface and extending to 15 cm above the soil surface. The below ground portion of the pipe was perforated to equilibrate the water depth in the pipe with that of the field.
Control model (CON)
At 8-10 DAS, the field was flooded to a depth of 5 cm depth and the first fertilizer application made. Water was allowed to subside to the soil surface (not below), and then water was pumped again to a depth of 5 cm. Second fertilizer application was made at 18-20 DAS. After the second fertilizer application, the water was allowed to subside to a water level 15 cm below the soil surface then the field was flooded to a 5 cm water level and allowed to subside to the soil surface; then pumped again. The CON model farmers carried out AWD once in the crop season. This practice is common throughout much of Vietnam.
An additional “flooded” water treatment was added to the Thanh Nhut site during the august to december growing period. This treatment was the same as the AWD model treatment but was flooded through the entire growing season.
Alternative wetting and drying model +1M5R (AWD)
Following sowing, the field was allowed to dry naturally for 5 to 10 days then, water was pumped into the field to a depth of 2-3 cm and the first fertilizer application was made. The water was maintained at this depth up to 20 days after sowing (DAS), then a second fertilizer application was made (the tiller stage of rice). After the second fertilizer application, water was pumped on to the field to a depth of 2-3 cm (wet period), then the field was dried until the water level was 15-20 cm below the soil surface (dried period). This took approximately 8-10 days. This alternate wet and dry (AWD) treatment was repeated at 15 days after full flowering. The third fertilizer application was done at 38-40 DAS (the panicle differentiation). Attention was given to ensure the field was flooded during flowering.
Greenhouse gas collection and analysis
Three seasonal plantings were made at each site (Table 1) with the fields managed as per (Tables 3 and 4). Three replications of each treatment were established at each site. The USDA Grace Net protocol was used as a reference for the collection of gas samples. After sowing, a 60 cm x 60 cm x 80 cm base was placed in the fields to support the sampling chambers (Figure 2).

Figure 2: Chambers (left) and footprints (right).
Chambers were constructed of plexiglas and placed on the base when samples were collected. The connection between the base and the chamber was sealed with water. Gas samples were collected at 0, 10, and 20 min intervals. The syringes (polypropylene, 20 mL) were immediately disposed in a cooler box, where they were kept at low temperature. Sampling was carried out weekly. Sampling for methane (CH4) commenced 1 week after plant emergence. Since nitrous oxide (N2O) emissions are not continuous, N2O samples were collected at intervals when it was expected to be emitted e.g. after fertilization and following AWD treatments as the soil dried. At this time N2O sampling was carried out daily for 5 consecutive days. Samples were kept in a covered container and sent to Can Tho University laboratory on the same day for analysis.
Gas samples were analyzed using a Shimadzu GC-14B gas chromatograph (GC) (Shimadzu Scientific). Methane was detected using a FID-detector and nitrous oxide with a ECD-detector. Both signals were recorded by an Agilent Model SS420 acquisition box. Samples were analyzed within 24 h of the sampling. The chromatograph was equipped with Porapak-Q column set at 30oC temperatures, N2 as carrier gas in flow of 30 mL min-1, injector temperature was 50oC, and ECD detector was at a temperature of 320oC.
Quality control of the GC was done via an excel program. The machine was calibrated every day before air samples were measured. Before calibration, 03 ambient air samples were measured and % RSD of these measurements was calculated to indicate the stability of the machine. Three standard concentrations (3, 67 and 134ppm) were used. The concentrations were plotted against area reading on the machine and R2 of this regression >0.95. The detection limit of this machine is 0.5ppm. During measurement, after 10 samples measured, the 67ppm standard was injected to the machine to control the stability.
Fluxes of CH4 and N2O were estimated as linear increase over time. Concentrations were converted to mass per unit volume (g N2O or CH4 L-1 using the Ideal Gas Law using the air temperature measured at the gas collection time and 0.101MPa. Fluxes were calculated as:
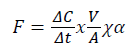
Where, F is gas flux rate for N2O (g N2O-N ha-1 d-1) and CH4 (g CH4-C ha-1 d-1), ΔC/Δt represents concentration increases or decreases in the gas chamber, V is the chamber volume, A is the surface area (ha) and χ is the conversion coefficient for elemental N and C (28/44 for N2O; 12/16 for CH4).
Seasonal CH4 and N2O emissions were converted to CO2 equivalents using 25 and 298 conversion factors for CH4 and N2O, respectively. These values were then totalled for each treatment and converted to a yield-scaled global warming potential (GWP) (kg CO2 eq Mg-1) by dividing total CO2 equivalents (CO2 eq ha-1) by the grain yield (Mg ha-1).
Seasonal gas emissions were determined by successive linear interpolation of gas emissions on the sampling days assuming that emissions followed a linear trend on days when gases were not measured. The GWP of N2O and CH4 was calculated in mass of CO2 equivalents (kg CO2 eq ha-1) over a 100-y time horizon. A radiative forcing potential relative to CO2 of 298 was used for N2O and 25 for CH4 [8]. GWPY was expressed as GWP per unit mass of rice grain (kg CO2 eq Mg grain-1) was obtained from the ratio of GWP (kg CO2 eq ha-1) and grain yield (Mg ha-1).
Statistical analysis
All statistical analyses were completed using Systat V13. Differences between management models (CON and AWD) were determined using the general linear model (GLM) procedure and the Turkey multiple pairwise comparisons at P-value <0.05. All comparisons were made individually for each location and planting date. An analysis including planting dates within location and/or across locations was also completed.
Results
Climate and soil
Total annual precipitation from 2006 to 2013 for both sites Figure 1 show an average of 2,057 mm at the Thanh Loi site and 1,340 mm at the Thanh Nhut site. Seasonal variation was greater at the Thanh Loi site than at Thanh Nhut. Both sites exhibit monsoon rainfall patterns in Figure 3a and 3b:

Figure 3: (a) Annual rainfall in the south-west of the Mekong Delta (Thanh Loi site in Can Tho) and (b) the north-east (Thanh Nhut site in Tien Giang).
There were few differences between sites in the soil sand, silt, and clay contents (Table 2). There were important differences between sites in soil organic matter (SOM) and total nitrogen (N total) with the Thanh Loi site values greater. There is evidence that high soil organic matter (SOM) levels can enhance CH4 emissions if the organic matter is poorly decomposed [7-10].
Methane emissions
Methane emissions expressed as t CO2 eqha-1 (Table 5) were significantly different for statistical comparisons between planting sites for all treatments within planting dates and planting seasons. The same result was found when comparing treatments within planting seasons and locations. Apart from the flooded treatment at Thanh Nhut during the TD planting period, methane emissions were greater at the Thanh Lou site when compared to the Thanh Nhut site. Values for the CON treatment ranged from 20.3 to 7.9 t CO2 eqha-1. Values measured at the Thanh Loi site were extremely high and may, in part, be attributed to the high soil SOM values measured at this site (Table 2). There are a small number of published articles that contain values as high as those measured at this site [11,7]. In all cases these studies have attributed the higher values as a result of there being large amounts of decomposing organic matter that are the result of a previous rice crop. Our results suggest that the farmers may have added compost to this site between plantings. The highest value (26 t CO2 eq ha-1) was in the flooded treatment at the Thanh Nhut site. This treatment was added to validate reports that under conventional management farmers generally allow their fields to dry one or two times during the season.
| Site | Crop Season | Model | CH4 (t CO2-e) | N2O (t CO2-e) | Kg CO2 eq ha-1 | Yield (t/ha) | GWP |
|---|---|---|---|---|---|---|---|
| Thanh Loi | HT | CON | 10.2 | 0.235 | 10435 | 4.8 | 2174 |
| (Apr-Jul) | AWD | 0.5 | 0.375 | 875 | 5.5 | 159 | |
| TD | CON | 20.3 | 0.057 | 20357 | 4.2 | 4847 | |
| (Aug-Dec) | AWD | 9.7 | 0.064 | 9764 | 4.7 | 2077 | |
| DX | CON | 20.1 | 0.06 | 20160 | 6.9 | 2923 | |
| (Nov-Mar) | AWD | 5.6 | 0.06 | 5660 | 7.1 | 797 | |
| Thanh Nhut | HT | CON | 7.9 | 0 | 7900 | 5.5 | 1436 |
| (May-Aug) | AWD | 0.6 | 0.024 | 624 | 5.6 | 111 | |
| TD | Flooded | 26 | 0.11 | 26110 | 4.3 | 6072 | |
| (Aug-Dec) | CON | 10.3 | 0.17 | 10470 | 4.4 | 2380 | |
| AWD | 4.5 | 0.27 | 4770 | 4.9 | 973 | ||
| DX | CON | 9 | 0.17 | 9170 | 7.9 | 1161 | |
| (Nov-Mar) | AWD | 0.9 | 0.27 | 1170 | 8.4 | 139 |
Table 5: Methane and nitrous oxide emissions, grain yield, and global warming potential (GWP) for all plantings and sites.
This result validates this practice and suggests that advising farmers to keep their fields flooded throughout the growing season would result in increased methane emissions and is in agreement with results reported by Zou et al. [12]. For both sites, methane emissions were lowest in the HT planting season when compared to the TD and DX seasons. This season is the height of the monsoon season and it was difficult to dry-down any of the fields. During this time period there is significant cloud cover most days and with this reduced radiation plants are slower to develop.
The implementation of AWD resulted in a significant reduction in methane emissions at both sites and all seasons. While this was expected, the reductions measured in this study are much higher than in other studies [11]. It is difficult to attribute these results to any specific treatment or weather conditions. They do consistently indicate that the adoption of AWD management would result in a significant reduction in methane emissions in the area where the study was conducted.
Nitrous oxide emissions
Nitrous oxide emissions ranged from 0 to 0.375 t CO2 eq ha-1. Within each site, greatest N2O emissions were with the HT planting at the Thanh Loi site and lowest at the Thanh Nhut site for the same planting. For all but the DX planting at Thanh Loi, nitrous oxide emissions were greater for the AWD system when compared to the CON system. These results are expected and in line with results reported by Wang et al., [11] and Linquest et al. [6]. Increased nitrous oxide emissions in AWD managed rice are the result of field drying before applied nitrogen fertilizers can stabilize. Results from some studies report N2O emission levels that more than offset reductions under AWD water management [10].
Global warming potential
Global warming potential expressed as kg CO2 eq Mg-1 grain integrates total GHG emissions with grain yield. A number of studies report that AWD reduces GHG emissions but also decreases grain yield [6]. Grain yields for all treatments (Table 5) indicate that grain yields increased, but not significantly, under AWD management. At both locations grain yield was highest during the DX season which is the dryer part of the year and a time when radiation is greatest. This increase in grain yields during the DX season will result in lower GWP values if GHG emissions are equivalent to the other growing seasons. It is expected that GWP values will decrease as the result of decreases in GHG emissions under the AWD treatment. The highest GWP value (6072 CO2 eq Mg-1) was from the fully flooded check treatment. The average CON treatment value, across all plantings and locations was 2487 CO2 eq Mg-1 while the same value for the AWD treatment was 709 CO2 eq Mg-1. For all plantings and locations there was a significant decrease in GWP in the AWD treatment compared to the CON treatment. For both locations, the TD planting time resulted in the greatest GWP values. For both locations, this planting time represents the wettest season and it is quite likely it was nearly impossible to fully dry the fields.
Discussion
In order to feed its growing population and continue to export rice Vietnam will need to develop rice production practices that both maintain grain yield and not continue the high rates of GHG emissions currently present. This study addressed this challenge by testing the introduction of AWD water management into the currently recommended rice management program. A series of studies were conducted from 2014 to 2016 at two locations (Thanh Loi, Thanh Nhut) in the Mekong Delta region for three planting seasons (HT, TD, DX). Greenhouse gas emissions were significantly reduced in both locations and in all plantings when AWD water management was added to the standard management recommendations. Rice grain yields in the AWD treatments were higher than in the conventional treatment resulting in a significant reduction in GWP for all plantings. These results show that by adding AWD to the current suite of recommended practices would result in an overall 72% reduction in GWP across the study regions.
References
- Government of Vietnam (2015) Planted area and production of cereals, Statistical documentation and service centre, General statistics office. Hanoi, Vietnam.
- Linquist B, Snyder R, Anderson F (2015) Water balances and evapotranspiration in water- and dry-seeded rice systems. Irrigation Sci 33: 375-385
- Carrijo DR, Lundy ME, Linquist B (2017) Rice yields and water use under alternate wetting and drying irrigation: A meta-analysis. Field Crops Res 203: 173-180.
- Lasco RD, Ogle S, Raison J, Verchot L, Wassmann R, et al. (2006) Cropland. In: 2006 IPCC guidelines for national greenhouse gas inventorient. IGES, IPCC national greenhouse gas inventories program, Japan, pp: 5.1-5.6
- Linquist B, Anders MM, Adviento-Borbe MAA, Chaney RL, Nalley LL, et al. (2014) Reducing greenhouse gas emissions, water use, and grain arsenic levels in rice systems. Glob Chang Biol 21: 407-417
- Yan X, Yagi K, Akiyama H, Akimoto H (2005) Statistical analysis of the major variables controlling methane emission from rice fields. Glob Chang Biol 11: 1131-1141
- Houba VJG, Novozamsky I, Lee JJ (1982) Comparison of soil extractions by 0.01 M CaClâ‚‚, by EUF and by some conventional extraction procedures. Plant and Soil 96: 433-437
- Ramanswamy V, Shine K, Leovy C, Wang WC, Rodhe H, et al. (1991) Radiative forcing of climate. NASA Scientific Assessment of Ozone Depletion, pp: 1-26.
- Wassermann R, Buendia LV, Lantin RS (2000) Mechanisms of crop management impact on methane emissions from rice fields in Los Banos, Philippines. Nutrient Cycling in Agroecosystems 58: 107-119
- Wang ZY, Xu YC, Li Z (2000) A four-year record of methane emissions from irrigated rice fields in the Beijing region of China. Nutrient Cycling in Agroecosystems 58: 55-63
- Zou J, Yao H, Xunhua Z, Yuesi W (2007) Quantifying direct N2O emissions in paddy fields during rice growing season in mainland China: Dependence on water regime. Atmos Enviro 41: 8030-8042
Citation: Khai NH, Tinh TK, Tin HC, Sanh NV (2018) Reducing Greenhouse Gas Emissions in Rice Grown in the Mekong Delta of Vietnam. Environ Pollut Climate Change 2: 158. DOI: 10.4172/2573-458X.1000158
Copyright: © 2018 Khai NH, et al. This is an open-access article distributed under the terms of the Creative Commons Attribution License, which permits unrestricted use, distribution, and reproduction in any medium, provided the original author and source are credited.
Select your language of interest to view the total content in your interested language
Share This Article
Recommended Journals
Open Access Journals
Article Tools
Article Usage
- Total views: 4132
- [From(publication date): 0-2018 - Jul 14, 2025]
- Breakdown by view type
- HTML page views: 3289
- PDF downloads: 843