Research Article Open Access
Spatial and Temporal Variation of Impacts of Climate Change on the Hydrometeorology of Indus River Basin Using RCPs Scenarios, South East Asia
| Gebre SL1* and Fulco Ludwig2 | |
| 1Department of Natural Resources Management, Jimma University, Ethiopia | |
| 2Department of Earth System Science, Wageningen University and Research Center, The Netherlands | |
| Corresponding Author : | Gebre SL Department of Natural Resources Management Jimma University, Ethiopia Tel: +251-471123170 E-mail: sintayehulegesse@gmail.com |
| Received November 09, 2014; Accepted December 01, 2014; Published December 10, 2014 | |
| Citation: Gebre SL, Ludwig F (2014) Spatial and Temporal Variation of Impacts of Climate Change on the Hydrometeorology of Indus River Basin Using RCPs Scenarios, South East Asia. J Earth Sci Clim Change 5:241. doi:10.4172/2157-7617.1000241 | |
| Copyright: © 2014 Gebre SL, et al. This is an open-access article distributed under the terms of the Creative Commons Attribution License, which permits unrestricted use, distribution, and reproduction in any medium, provided the original author and source are credited. | |
Visit for more related articles at Journal of Earth Science & Climatic Change
Abstract
In this study we assessed the spatio temporal impacts of climate change on the hydrometeorology of Indus River basin. A 0.5 by 0.5 degree resolution data of Coupled Model Intercomparison Phase5 (CMIP5) global climate models (GCMs) output of precipitation and temperature (maximum and minimum) and VIC (Vertical Infiltration Capacity- Macroscale hydrological model) simulation results of evaporation and total runoff at the out let of the Arabian peninsula for 2030`s (2035-2064) and 2070`s (2071-2100) under (Representative Concentration Pathway) RCP 4.5 and RCP 8.5 emissions scenarios used. Arc GIS 10.2 extension of ordinary kriging Geostatistical interpolation techniques applied for spatial analysis of precipitation, temperature (maximum and minimum) and evaporation for the River basin. Future projection results as compared to the base period (1971-2005) showed that the, average multimodal monthly precipitation decreases during winter and, spring months and increases during summer months, ranging in between -25% and +43%. Average seasonal spatial precipitation changes resulted various ranges of precipitation distribution for 2070`s of RCP 4.5, average seasonal precipitation decreases in the mid part of the basin up to -20%. Average temperature increase for both future periods (2030`s and 2070`s) and RCPs (RCP 4.5 and RCP 8.5) emission scenarios, maximum temperature change observed in the Himalayas Mountains. All GCMs except MPI projected increase of future average annual evaporation. Average Multimodal GCMs projection results showed that the, average monthly runoff increases more during summer than winter. The increase of runoff at the downstream flow is as a result of snow and glacial melt at the high elevation regions of the Indus River basin. The increase of runoff flow probably has positive impacts in meeting the water requirement of small scale irrigation schemes. Moreover, water can be stored in a reservoir during summer season and distributed to arid areas of the basin. Due to the increased amount of flow during summer, there may be high chance of flooding in plain areas of the basin, therefore a precaution measure have to be taken in order to minimize the possible risks of flooding on agricultural and human welfare of the society.
| Keywords |
| Climate; CMIP5; GCM; Indus; Kriging; RCP; Scenarios; VIC |
| Introduction |
| Climate change has a significant effect on the hydrological cycle, impacts of climate change on precipitation and temperature play a major role in disturbing the hydrological cycle [1]. The resulting change in hydrological cycle may have a direct impact on both evapotranspiration and water availability [2]. This disturbance amplifies its impacts on sectors like agriculture, industry and urban water resources development [3-5]. In this study we will investigate, future spatial and temporal impacts of climate change variation on precipitation, temperature, evaporation and runoff of Indus River basin. The Indus River basin provides major social economic benefits for millions of people living in south East Asia. For example, the agriculture sector consumes more than 95% of the river flow to ensure food security [6]. Particularly, the economic life of Pakistan considerably relies on the flow of Indus River Basin, which supports a large proportion of irrigated agricultural land and generating electric power [6]. About more than 80% of the Indus flow reaching the Punjab plains is derived from seasonal, permanent snowfields and glacial melt from Himalaya. Monsoon rainfalls and snow from the upper Himalayas significantly contribute to the direct run off in the lower tributary rivers of the Indus flow [7,8]. Therefore the precipitation at high altitude generally affects the glacial mass balance and ultimately the hydrologic regime of the basin. Currently 50-60 percent of the total average flows in the Indus system are fed by snow and glacier melt of the Hindu – Kush-Karakoram (HKK ) part of the Greater Himalayas, the remaining part is from monsoon rains on the plains [9]. Variability in the distribution and timing of snow fall and changes in snow and ice melt may be amplified by climate change which has huge influences on the basin water resources management [10]. |
| Although it is of huge importance to the wellbeing and development of the people, only a limited number of studies have been published so far about the future impacts of climate change on spatial and temporal variation of hydro-climatology of the River basin. A study done by [11], showed that there is a significant climate variation over the basin, but the report used a historical climate data and only to the extreme northern part of the basin. |
| Description of the study area |
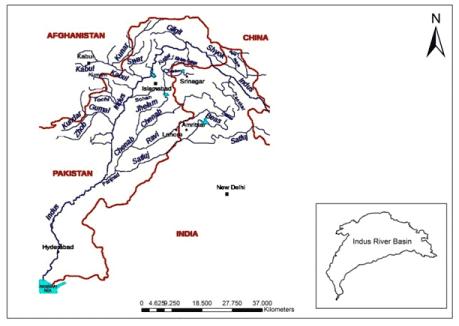
| The Indus River starts from the Tibetan Plateau (China) and it drains through India, Afghanistan and Pakistan before it entre into the Arabian Sea. The total length of the river is 3,180 km and has a total drainage area of 1,230,000 Km2 [6]. The climate of the basin is influenced by monsoon, winter monsoon (December-February), the hot period (March –May), the summer monsoon (June- August) and the autumn (September – November), which the transition period to winter season. There is a dramatic rainfall distribution variation across the basin (Figure 1). The mean annual precipitation is less than 100 mm in the lower Indus region, above the Arabian Sea (dry part), and greater than 750 mm in upper part, below the Himalaya Mountains [12]. |
| Hydrology and elevation of Indus River basin |
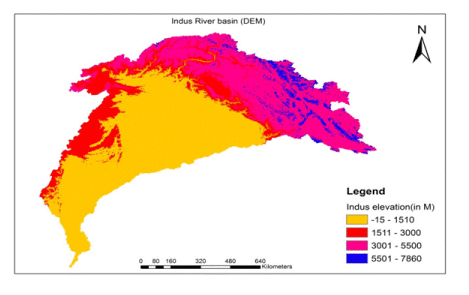
| The Indus river flow originates in the mountain head waters of the Karakoram Himalaya, western Himalaya, and Hindu Kush Mountains [6]. The runoff generated from the snow fall and glacier melt from high mountains area which contributes to flow volume of water to the central plains tributaries, where the majority of water resources development are existed and planned for construction in the future [13]. The basin has different stratification of elevations ranging from (-15-7860 meters [m]) (Figure 2). |
| Data and Methods |
| Materials and data |
| Topography data: The Advanced Spaceborne Thermal Emission and Reflection Radiometer (ASTER), Digital Elevation Model (DEM) was used to delineate the catchment boundary studied. The digital elevation data downloaded for the study area. |
| Hydrometeorology data |
| Discharge data: VIC (Vertical Infiltration Capacity-Macroscale hydrological model) model ,is a semi distributed hydrological model first described in [14], VIC simulation output data of five GCMs of (Representative Concentration Pathway) RCP 4.5 and RCP 8.5 future period of total runoff at the out let of the Arabian Peninsula and simulation output of evaporation of grid cells of the Indus River basin obtained from ESS (Earth Science System) department, Wageningen University, The Netherlands used for analysis to examine hydrological impacts of climate change under RCP 4.5 and RCP 8.5 emission scenarios. |
| GCMs climate data |
| Future climate projection from the Coupled Model Intercomparison Project5 (CMIP5), the inter comparison project launched by the international climate research community in 2010. The CMIP5 projections of climate change are driven by concentration or emission scenarios consistent with the RCPs, Representative Concentration Pathways described in [15]. The IPCC Expert Meeting in September 2007 identified a new greenhouse gas concentration scenario “Representative Concentration Pathway (RCP)” and established frameworks and development schedules for the Climate Modelling (CM), Integrated Assessment Modelling (IAM), and Impact Adaptation Vulnerability (IAV) communities for the fifth IPCC Assessment Reports in which 130 researchers and users participated [16]. According to IPCC, currently the AR5 (Assessment Report phase 5) is under finalizing stage for climate model scenario based on the representative concentration path ways (RCP). The developing of representative concentration pathways (RCPs) will help to advances in processing of coordination of new integrated socioeconomic, emissions, and climate scenarios. Each RCP includes the concentration pathways and corresponding emissions and land use pathways, which is uses as input to climate model for developing global climate projections. The new scenarios projections have near term up to 2035 and long term covers up to 2100 and an extended one up to 2300 [17]. |
| There are four different types of representation concentration path ways developed and named on based on their radiative forcing power capacity [17] (Table 1). |
| For this study we used the outputs of five different climate models (MPI-ESM-LR, IPSL-CM5A-LR, HadGEM2-ES, EC-EARTH-DMI and CNRM-CM5) of bias corrected under a midrange emissions scenario (RCP4.5) and a high emissions scenario (RCP8.5). The data series used starts from January 1, 1971 till 2100 except Hadgem which extends u to 2099. |
| Ordinary kriging |
| ArcGIS Spatial analysis of the Geostatistical tool was selected to implement the Kriging interpolation techniques. Geostatistical Analyst is an extension of ArcMap used to generate surfaces from point data. The software is powerful, immense, user-friendly package and easy for application. Surface fitting using Geostatistical Analyst involves exploratory spatial data analysis, calculation, and modelling surface properties of nearby locations, and surface estimation and assessment of results [18]. |
| There are various types of Kriging. Ordinary Kriging is the most widely used and acceptable method. The ordinary kriging interpolation method is selected. Ordinary Kriging is the best outperformed geostatic method for spatial interpolation of precipitation and temperature [19]. It assumes that there is no linear trend exists in the data, rather it model the autocorrelation using a semivariogram, which allows attribute values to be estimated on unsampled locations [18]. |
| In this study we used ordinary kriging spatial interpolation techniques using Arc GIS 10.2 application software. Spatial variation of future impacts of climate change on precipitation, temperature, and evaporation at 2030`s and 2070`s of CMIP5 under RCP 4.5 and RCP 8.5 emission scenarios analysed using ordinary kriging techniques. For temporal analysis statistical techniques applied. |
| The basic equation of semivariogram is formulated below in equation.1 [20]. |
| Where, |
| γ (h)=semivariance coefficient |
| N (h)=number of pairs of data locations of a vector h apart. |
| Z (Xi)=Point location of X at i. |
| h = distance between two points location |
| The larger the value of γ the less similar the location points. |
| The model fitted is defined by its type and model coefficients; include the nugget variance, structured variance, sill, range, and gradient. |
| Results |
| Spatio-temporal impacts of climate change on the Hydrometeorology of Indus River basin |
| The spatial and temporal impacts of climate change on hydromteorological variables for 2030`s and 2070`s under (Representative Concentration Pathway) RCP 4.5 and RCP 8.5 emissions scenarios of the CMIP5 (Coupled Model Intercomparison Project5) output for Indus River basin analysed and studied. |
| Climate change impacts on precipitation |
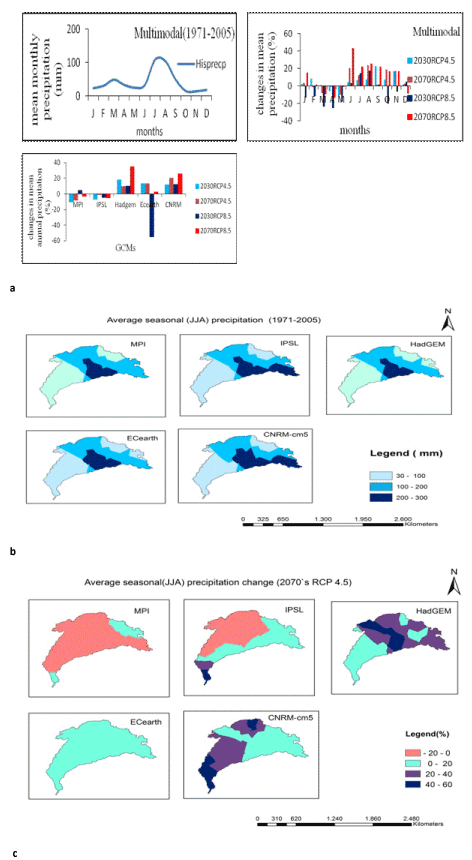
| Mean monthly precipitation change of the multimodal GCM output projection for 2030`s and 2070`s under both emission scenarios exhibited that precipitation increases during the main rainy season (summer) and decreases during winter season as compared to the base line period (1971-2005). Study done by [21], decrease in winter precipitation also observed from long years observation climate data analysis on the upper Indus basin part. The increment is more pronounced at 2070`s than 2030`s (Figures 3a and 3b). Generally, average annual precipitation change for future horizon of the five GCMs output also indicated a positive change under both RCP emission scenarios. CNRM and Hadgem showed high positive change under all periods and RCPs emissions, while MPI and IPSL projected a decrease of magnitude as compared to the base line period. |
| The spatial distribution of seasonal precipitation for the historical period shows that there is less precipitation at both extreme sides of the basin, at the very lower tip peripheral part of the basin less distribution of precipitation associated with high temperature and evaporation but at the other end part of the basin is because of the accumulation of solid snow and ice and less temperature and evaporation nature of the area. |
| Average seasonal precipitation change for 2070`s of RCP 4.5 emission scenario projection of the five different GCMs output show a positive change in major parts of the basin particularly in the mid part of the basin where there are different water development project are existed and planned in the future. However, a decrease in average seasonal precipitation projection observed almost in all part of the basin under MPI and IPSL GCMs projections, ranging from -20% to 0% as compared to the base line period (Figure 3c). A study done by [22] indicated that spatial precipitation distribution in Indus River basin is non uniform and higher summer precipitation increase in upper part and a decrease in lower part projected using Hadley Centre coupled model output of A1B emission scenarios for 2071-2098. This is result is closely similar to our findings, almost all the GCM models projected increase in precipitation at the end of the century in the upper part and a decrease in lower part of the basin. Other study done by [23] using CMIP5 output of RCP 4.5 and RCP 8.5, also indicated that in the future the upper part of the basin become wetter and wetter specially during summer season but in their report they used only the upper part of the basin so called Karakoram-Himalalya. |
| Climate change impacts on temperature |
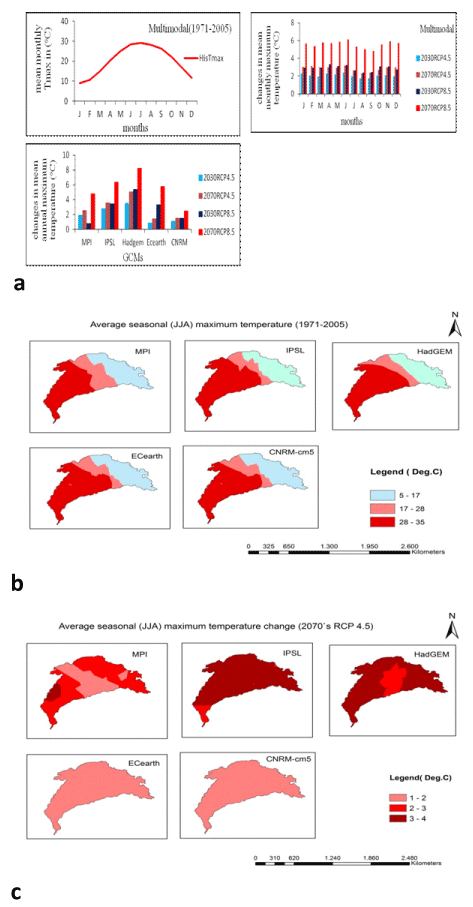
| Maximum temperature: Multimodal results of average monthly maximum temperature show a positive change, ranging from +1°C to +7°C under both future periods and RCPs. At 2070`s of RCP 8.5 the increase is more pronounced as compared to the other periods and RCP 4.5 emissions. Five GCMs output projections exhibited a positive change in average annual maximum temperature for 2030`s and 2070`s as compared to the base line period. |
| A positive seasonal (JJA) maximum temperature change observed for 2070`s of RCP 4.5 in all GCMs over the basin. Both IPSL and Hadgem GCMs projected a change ranging from +2°C to +4°C across the basin, whereas Ecearth and CNRM GCMs show similar change ranging from + 1°C to +2°C as compared to the base period 1971-2005 (Figure 4a-4c). |
| Minimum temperature |
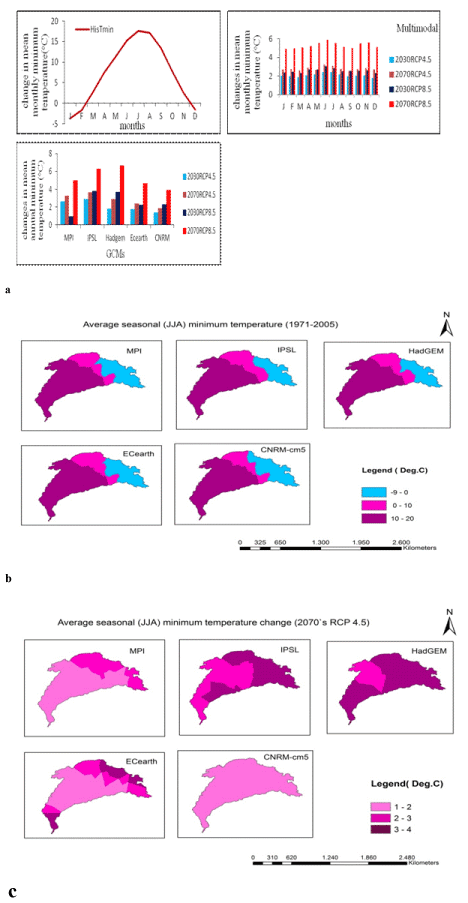
| Likewise, multimodal results of average monthly and annual minimum temperature, showed similar pattern, and changes like maximum temperature for future periods under both RCPS emission scenarios for Indus River basin (Figures 5a and 5b). |
| Average seasonal (JJA) minimum temperature of spatial change projection of the five GCMs exhibited a positive change in magnitude and direction in all parts of the basin ranging from +1°C to +4°C as compared to the base line period. High positive average seasonal minimum temperature change is expected in the northern and southern part of the basin. |
| It has been indicated indifferent studies; temperature change in the future in the Himalayas region (high elevation) is occurring three times the global average increase [24]. In Figure 5c, there will be high temperature change in Himalayas part than the southern part of the basin. More over the result presented in (Figure 5c) is in line to the IPCC assessment report, mean annual temperature increases by 3°C at mid century on the Asian mass land and by 5 °C at end of 21st century [24]. In other study [25] over the Tibetan Plateau of Himalaya using CIMP5 output of 24 GCMs using RCP 8.5 and RCP 2.6 emission scenarios, indicated that temperature will increases over the plateau in the 21st century. |
| Climate change impacts on evaporation |
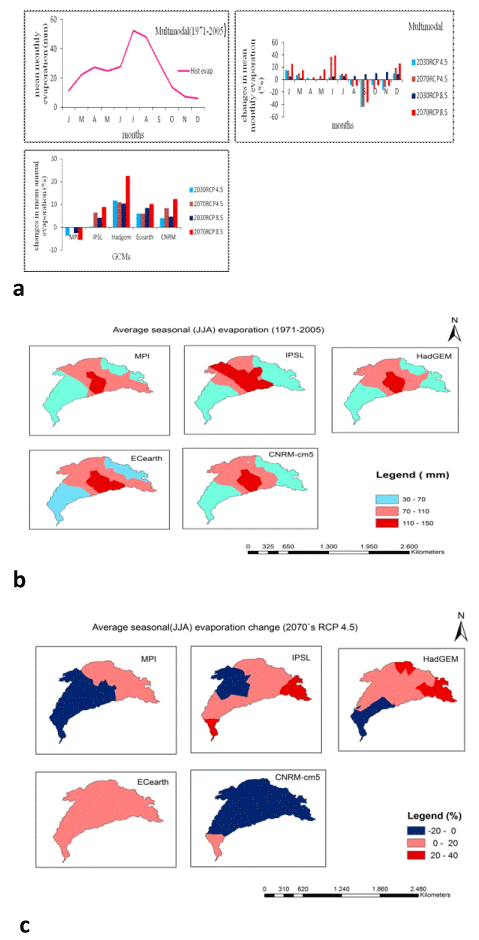
| Generally, multimodal average monthly evaporation increases during winter season and decreases during summer season in both future periods and RCPs emissions. All GCMs except MPI projected that average annual evaporation increases at 2030`s and 2070`s of RCP 4.5 and RCP 8.5 emission scenarios as compared to the base period. Maximum change observed in Hadgem GCM. |
| Average seasonal spatial distribution of evaporation during base line period (1971-2005) shows that, less seasonal evaporation observed at the lower and upper part of the basin, due to water and energy limitation respectively. Maximum evaporation rate exhibited in the central part of the region. Overall, five GCMs showed similar pattern seasonal spatial distribution of evaporation over the basin. |
| All the five GCMs projected different spatial pattern of seasonal (JJA) change of evaporation for 2070`s of RCP 4.5 as compared to the base line period (1971-2005). Ecearth GCM exhibited a positive change in all parts of the basin ranging from 0 to 20%. CNRM GCM projected more or less a decrease in evaporation in major parts of the basin (Figure 6a-6c). |
| Climate change impacts on runoff |
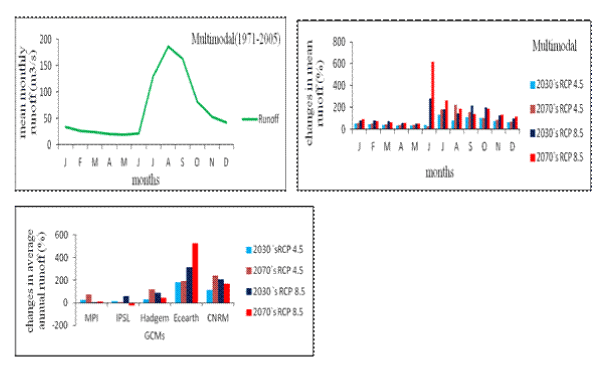
| Normally, historical multimodal simulation result of runoff at the out let of the Arabian Peninsula for the Indus River basin shows that, there is high runoff during summer season ranging on monthly average about 180 m3/s. There is less runoff during winter and spring seasons (Figure 7). |
| Average monthly runoff of multimodal GCM output projection exhibited a positive magnitude change of runoff in both future horizons and RCPs emission scenarios. Maximum changes observed during summer season (JJA) as compared to the base line period (1971 -2005). |
| All the five different GCMs projected, average annual runoff increases at 2030`s and 2070`s of RCP 4.5 and RCP 8.5 emission scenarios. Hadgem, Ecearth, and CNRM GCMs exhibited maximum change for both future periods as compared to the base line period. |
| This study finding of high increase in summer runoff is highly correlated to the rise of temperature in the upper part of the basin. A study done by [26], suggested that a 1oC mean temperature arising from climate change would result 17% of runoff in the upper River basins flow. Even the increase of summer runoff from the glacial melt may contribute a lot for the Indus Irrigation system but in the future the glacial coverage may retreat in size due to melting of temperature rise [26]. |
| Discussion and Conclusion |
| Our analyses show that climate change potentially has a significant impact on the hydro meteorological variables of the environment, due to green house gas emission in to the atmosphere. This creates warming of the globe due to the rise of temperature, which disturbs the hydrological cycle results in water resources management crises. Especially in reducing agricultural production and deteriorating environmental ecosystems. |
| Taking the average multimodal temporal precipitation projection for 2030`s and 2070`s exhibits that, average monthly precipitation increases during summer, autumn seasons and decreases during winter season under both RCPs emission scenarios. Generally Hadgem, Ecearth (except for 2030`s RCP 8.5) and CNRM GCMs models projected positive magnitude change in average annual precipitation for future period of Indus River basin. Moreover, the average seasonal (JJA) spatial precipitation distribution changes for 2070`s of RCP 4.5 shows positive increment in most of the GCM models, particularly in the Northern part of the basin. Generally, more precipitation over dominates in the future on the upper part and limited precipitation in the mid part of the basin. |
| Average multimodal GCMs analysis of temperature projection showed that, average monthly and seasonal maximum and minimum temperature increases for both future periods (2030s and 2070s) and RCPs (RCP 4.5 and RCP 8.5) emissions scenarios. All five different GCMs projection results indicated that, average maximum and minimum temperature increases in the future. Average seasonal of five GCMs spatial temperature change for 2070`s of RCP 4.5 resulted maximum increase in temperature in the Northern part of the basin (Himalayas terrain) ranging from +3°C to +4°C. |
| The change in temperature has a direct contribution to change of evaporation, average multimodal GCMs analysis shows, average monthly evaporation increases during winter and decreases during summer season. Even if temperature increases during summer season, unlikely evaporation decreases, this may be due to the large coverage of glacier and snow accumulation in the northern part of the basin, which increases the albedo of the glacier surface and limits the evaporation rate from the surface [27]. However, average annual evaporation of five GCMs except MPI GCM projected, average annual evaporation increases in the future under RCP 4.5 and RCP 8.5 emissions scenarios. |
| The changes in precipitation and temperature have a large impact on hydrological regime characteristics of flow. These effects have been noticed in different parts of the world Rivers, where flow is unpredictable and drought risks are increasing. However, this study results show that average multimodal monthly runoff increases for 2030`s and 2070 `s of RCPs (RCP 4.5 and RCP 8.5) emission scenarios. High amount of runoff flow expected during summer season. Generally, almost all five different GCMs models projected that, average annual runoff increases for future periods. The direct reason for the increase of runoff is associated with the increase of precipitation over the basin but the annual amount of precipitation is relatively low in major parts of the basin. Snow and glacier surface melt from high altitude part of the basin during summer season has a significant contribution to high runoff volume. Average flow increase may help and secure water development structures located beneath the glacier regions. On the other hand, water structures developed further away may face difficulty in getting the required flow and agricultural production may be affected [28]. Normally, the results show that, runoff increases in the future. High flow is expected during summer in snow fed and glacier melt watersheds of the basin which is vital for sustainable agricultural activity in the region through surface and underground irrigation as described in [29]. |
| The result shown in this study of climate impacts on hydro climatic variables of future projection change are similar to the result presented by [30] and [31]. The two papers used CMIP3 output results but we used CMIP5 output. The result presented in percentage change of precipitation, temperature, evaporation and runoff are in line to the global projection of future changes by IPCC (Integovemental Panel on Climate Change). |
| Climate change analysis using General Circulation Model (GCMs) have different uncertainties and give different results in different part of the world. Particularly at high elevations due to complexities nature of elevations, General Circulation Models (GCMs) are unlikely to have high degree of precision in forecasting [27]. Moreover, biases in rainfall in climate model remains very high. Because of this we use bias corrected data. This bias correction adds additional uncertainty to our results [32]. Therefore, there may be some additional uncertainty in the analysis results. |
| In conclusion, climate change has large impacts on the hydroclimatology variables of the basin, which plays great role in the hydrological cycle. Runoff increases particularly during summer. Therefore, it is very advisable to develop large capacity water schemes that can hold the incoming high floods and harvest water for dry season to support agricultural productivity to insure food security of the alarming rate increase of the population in the region. |
| This study has used different climate model projections, it is important to note that quantitative prediction contains significant uncertainties. However, the result obtained and pointed out in this research gives possible direction to develop and plan critical policies and strategies to address and manage the anticipated impacts of climate change risks on water resource schemes and agricultural productivity for better well being millions of population living in the Indus River basin. |
| Acknowledgements |
| The authors would like to thank Dr. Iwan Supit and Wietse Franssen (Wageningen University and research Center, Earth Science System department) for providing CMIP5 and VIC simulation data. |
References
|
Tables and Figures at a glance
| Table 1 |
Figures at a glance
 |
 |
 |
 |
| Figure 1 | Figure 2 | Figure 3 | Figure 4 |
 |
 |
 |
| Figure 5 | Figure 6 | Figure 7 |
Relevant Topics
- Atmosphere
- Atmospheric Chemistry
- Atmospheric inversions
- Biosphere
- Chemical Oceanography
- Climate Modeling
- Crystallography
- Disaster Science
- Earth Science
- Ecology
- Environmental Degradation
- Gemology
- Geochemistry
- Geochronology
- Geomicrobiology
- Geomorphology
- Geosciences
- Geostatistics
- Glaciology
- Microplastic Pollution
- Mineralogy
- Soil Erosion and Land Degradation
Recommended Journals
Article Tools
Article Usage
- Total views: 17029
- [From(publication date):
December-2014 - Jul 06, 2025] - Breakdown by view type
- HTML page views : 12195
- PDF downloads : 4834
