Spatial Distribution of Grain Size Characteristics and its Role in Interpreting the Sedimentary Depositional Environment, Kodaikanal Lake, Tamil Nadu, India
Received: 20-May-2014 / Accepted Date: 21-Aug-2014 / Published Date: 05-Sep-2014 DOI: 10.4172/2157-7617.1000217
Abstract
The surface sediments of Kodaikanal Lake is situated in the palani hills at an altitude of 2,285 m above sea level, the geo co-ordinates of the lake are lies between 10°14’ N latitude and 77°28’ E longitudes. In the present study determination of grain size and its deposition environment were carried out for surface sediments collected from different parts of the Lake. The study permits to infer the changes in the depositional environment during the period of infilling at the sites. The spatial distribution of Mean size of the sediments varies from medium sand to medium silt, moderately well sorted to very poorly sorted characteristics, near- symmetrical to very fine-skewed type, and falling in platykurtic to very leptokutic nature. United State Department of Agriculture (USDA) textural triangle plot expresses sediments are clustered tightly in silty sand variable, and its type ranges falls within the field of Loamy sand, sand, sandy loam and silty loam fractions. Thus, the Lake sediments are dominance of silt and sand fractions. Multivariant statistics (discriminant analysis) express that the plots fall scattered in Turbidite and Aeolian environment. The Bivariate textural plot falls in Quiet water environment. The polymodel nature of the sediments also implies that transportation by rolling, sliding, saltation and suspension processes in the Kodaikanal Lake.
Keywords: Grain size; Depositional environment; Kodaikanal Lake; Spatial distribution
6367Introduction
Grain size characteristics are fundamental role in hydrological, geomorphological and sedimentological studies [1,2]. Grain size parameter primarily related to mode of transportation and energy condition of the transportation and transporting medium. Grain size analysis is one of the important and widely used sedimentological tools to unravel the hydrodynamics condition. Grain size distribution and its properties and the statistical parameters worked out from size population are the basic requirements in the understanding of the abiotic fabric of aquatic ecosystem [3,4]. They can provide valuable clues to the sediment attribution, transport history and depositional environment [5]. The present paper focuses on the classification of grain size distribution in Kodaikanal Lake. The methods and criteria for distinguishing the depositional environments from the grain size distribution were applied by the previous workers mainly based on Folk and Ward [6]. Sahu [7] noted that every environment of deposition may be assumed to have a characteristic range of energy conditions as functions of location and time. The bivariate plots of the discriminate functions of Sahu [7] which were based on grain size parameters as well as his proposed scheme for classification of depositional environment were also employed in the interpretation of the depositional setting.
Study Area
The Kodaikanal is referred to as the princess of “Hill stations”. Kodaikanal is a city in the hills of the Taluk division of the Dindugal district in the state of Tamil Nadu, India. It is located in betweens Lake 10°14’ N latitude and 77°28’ E longitudes (Figure 1) at an elevation of 2133 m above sea level and it looks magnificent with star shaped glittering water, in the midst of evergreen lush slopes. The lake is spread over 60 acers (24 ha) and surrounded by fine tarred road of 5 km length.
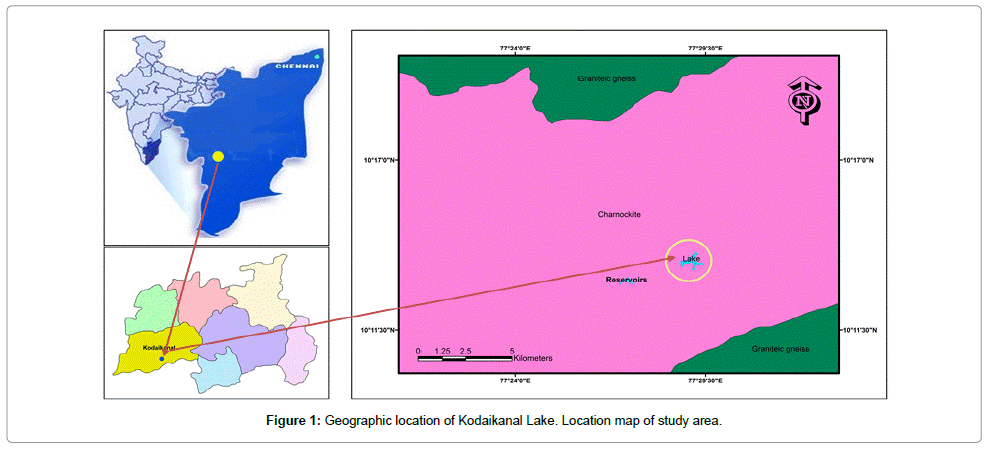
Figure 1: Geographic location of Kodaikanal Lake. Location map of study area.
Methods of Study
Sediment deposited within the Kodaikanal Lake was sampled using Van Veen grab sampler. Roughly 1 to 2 Kg (wet weight) of sediments were collected at its site (10 Locations); samples were stored in sealed Ziploc- bags with lake water. The samples locations are shown in Figure 2 along with bathymetry. The sediments were dried for 24 hours in a hot air oven at 60°C to remove the moisture before analysis. From the dried samples, 100 gm was taken by the conning and quartering method. The 100 gm of sample is then subjected to sieve analysis in ASTM sieves at half phi intervals for about 30 minutes in Ro-top sieve shaker. The sieved material in each fraction were collected and weighed. The weights of the individual fractions were tabulated for textural analysis. The silt and clay size particles were determined using the HoribaLA-300 scattering particle size distribution analyzer.
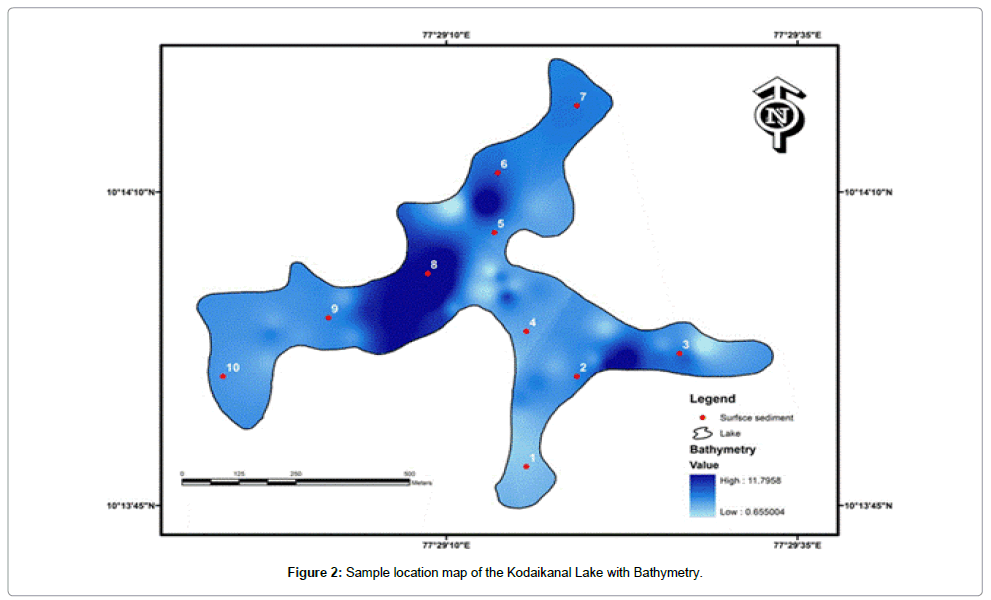
Figure 2: Sample location map of the Kodaikanal Lake with Bathymetry.
The interpolation procedure has been designed to take advantage of the types of input data commonly available and the known characteristics of elevation surfaces. It is optimized to have the computational efficiency of local interpolation methods, such as Inverse Distance Weighted (IDW) interpolation, without losing the surface continuity of global interpolation methods, such as Kriging and Spline. It is also the only Arc GIS interpolator specifically designed to work intelligently with contour inputs. In the present study IDW interpolation technique were adopted to create spatial data set for surface sediments become of its computational efficiency.
Results and Discussion
In the present study, bulk sample from surface sediment (10 No. of samples) have been analyzed to understand the spatial variation in gain size. The various textural parameters obtained through graphic and moment method are given in Table 1. Apart from the spatial distribution surface sediments, they are also serving as an excellent tool for establishing hydrodynamics of sediment depositional environment.
| S.NO. | ME-Q | MSD-Q | MCD-Q | MSK | MKU | MED-Q | M-Q | SD-Q | SK | KU | FP-Q |
|---|---|---|---|---|---|---|---|---|---|---|---|
| 1 | 3.5 | 1.92 | 2.76 | 0.39 | 1.98 | 3.06 | 3.39 | 1.92 | 0.24 | 0.72 | 0.54 |
| 2 | 3.26 | 1.67 | 2.88 | 0.61 | 2.53 | 2.84 | 3.09 | 1.65 | 0.37 | 0.84 | 0.56 |
| 3 | 3.2 | 1.68 | 2.66 | 0.57 | 2.36 | 2.72 | 3.07 | 1.65 | 0.38 | 0.73 | 0.55 |
| 4 | 4.09 | 2.05 | 1.26 | 0.15 | 1.93 | 4.25 | 3.98 | 2.06 | -0.05 | 0.71 | 0.57 |
| 5 | 3.09 | 1.72 | 3.44 | 0.68 | 2.51 | 2.49 | 2.83 | 1.77 | 0.45 | 0.85 | 0.54 |
| 6 | 3.15 | 1.56 | 2.76 | 0.73 | 2.86 | 2.73 | 2.96 | 1.53 | 0.36 | 0.85 | 0.57 |
| 7 | 1.61 | 1.36 | 10.12 | 3.99 | 20.44 | 1.33 | 1.18 | 0.67 | 0.28 | 1.16 | 0.51 |
| 8 | 2.56 | 1.64 | 5.28 | 1.2 | 3.64 | 1.97 | 2.44 | 1.63 | 0.59 | 1.09 | 0.52 |
| 9 | 5.72 | 1.52 | 0.17 | 0.05 | 2.78 | 5.68 | 5.63 | 1.53 | 0.02 | 1.04 | 2.12 |
| 10 | 6.04 | 1.47 | 0.15 | 0.05 | 2.82 | 5.95 | 5.94 | 1.5 | 0.18 | 1.03 | 2.52 |
| Min | 1.61 | 1.36 | 0.15 | 0.05 | 1.93 | 1.33 | 1.18 | 0.67 | -0.05 | 0.71 | 0.51 |
| Max | 6.04 | 2.05 | 10.12 | 3.99 | 20.44 | 5.95 | 5.94 | 2.06 | 0.59 | 1.16 | 2.52 |
| Mean | 3.622 | 1.659 | 3.148 | 0.842 | 4.385 | 3.302 | 3.451 | 1.591 | 0.282 | 0.902 | 0.9 |
Table 1: Textural parameter of Kodaikanal Lake sediment.
Mean size (Mz)
The mean size of the surface sediments ranges from 1.8 φ to 5.94 φ indicating the dominance of Medium sand to Medium silt (Figure 3a). The geographic trends in the sediment particle size correspond closely to bathymetric variations [8,9], as shown by the increasing finesse abundance towards the deepest part of the Kodaikanal Lake (Figure 3b). The pattern of distribution of mean grain size shows variation from south west to north eastern part of the Kodaikanal Lake. The distributional pattern exhibit medium sand nature in northeastern part when compare to the southwestern part, which is predominant of silt indicating the increase of energy level of current towards South west to North east directions. The dominance of finer sand and silty sediments can be also attributed to the low disturbance and low energetic condition. The finer sediment are occupying in the central part and coarser nature are distributed in the NW of the lake, while the finest sediments are restricted mostly to the deeper part of the lake, with in 14.87 m contour in Kodaikanal Lake, there appears and depth the distribution of the sand to silt-rich mixture in the Kodaikanal Lake.
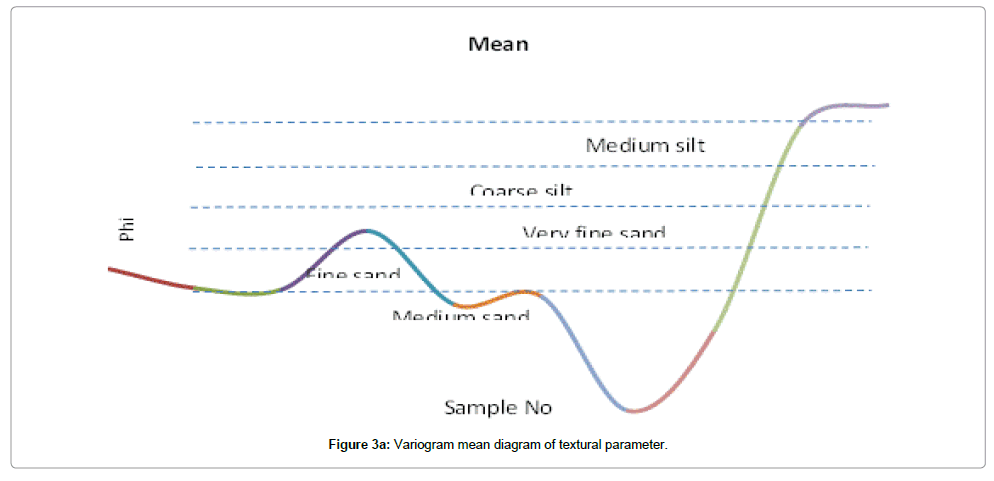
Figure 3a: Variogram mean diagram of textural parameter.
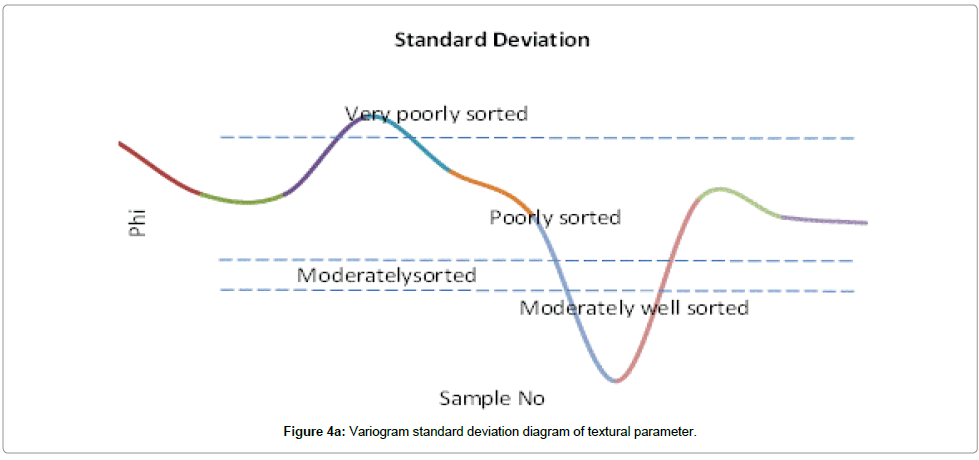
Figure 3b: Spatial distributions of mean value of surface sediment.
Standard deviation (бi)
The standard deviation values of surface sediments ranges from 0.67 φ to 2.06 φ in the variable scale of Folk and Ward [6], they are of moderately well sorted to very poorly sorted type (Figure 4a). It may be attributed to the mixture of the finer materials from tributaries and inlets and deficiency of attrition and saltation in the process. The spatial distributional pattern of standard deviation exhibits that the sediment in the North eastern part of the Lake are of moderate to moderated well sorted nature and the sorting reduced towards the south west, southeast and central part of the Lake. The addition of sediment fraction from spring valley in the lake hills result the deterioration in the sorting over these region when compared to that North eastern part of the Lake (Figure 4b).
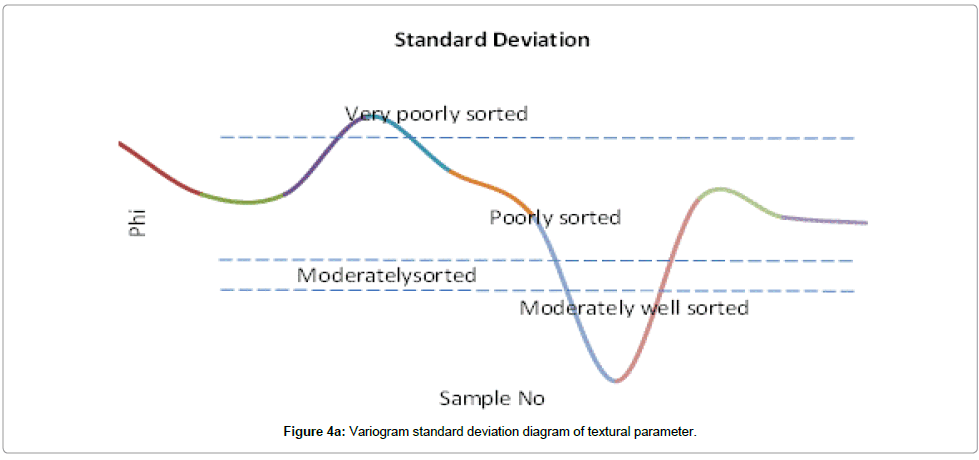
Figure 4a: Variogram standard deviation diagram of textural parameter.
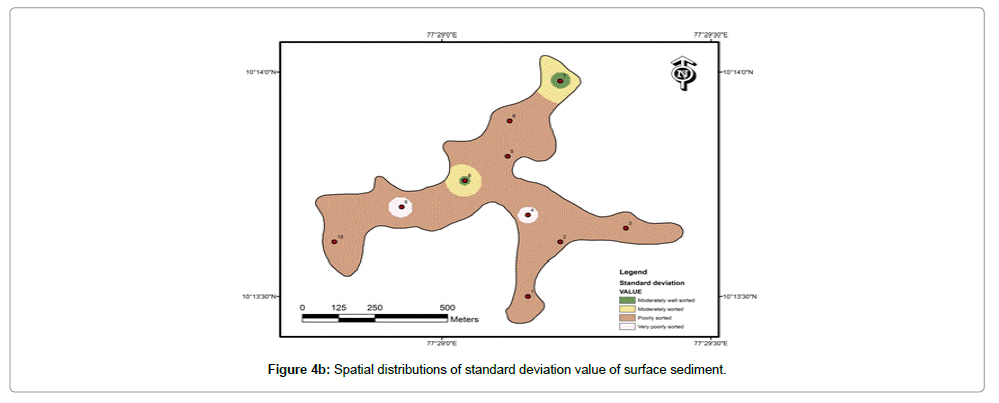
Figure 4b: Spatial distributions of standard deviation value of surface sediment.
Skewness (Ski)
The Skewness values of the surface sediments ranging from -0.05 to 0.59. These values of sediments exhibit that the surface sediment are falls in very Near-Symmetrical to very fine skewed nature (Figure 5a). This indicates addition of sub-populations in to the Lake. Spatial distribution of the grain size characteristics like finer in size with high values within the poorly sorting type and the more negatively skewed kurtosis values in the sample of central part of the Lake (Figure 5b) are indicating that the energy is increasing in the direction of transport, towards southwest from northeast direction.
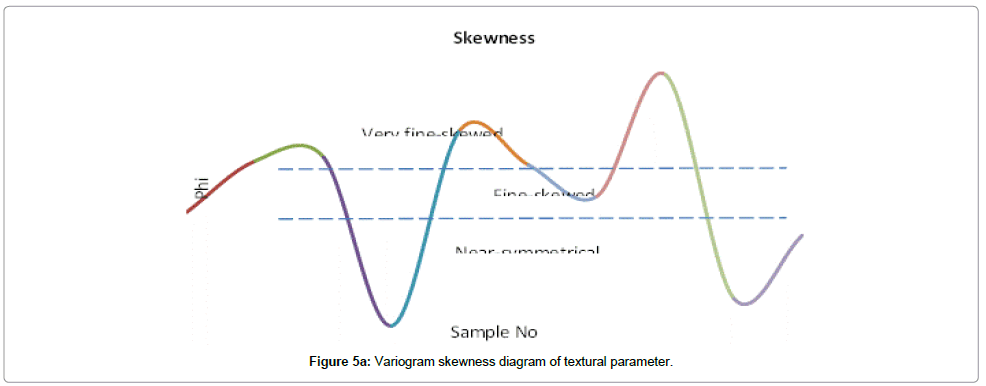
Figure 5a: Variogram skewness diagram of textural parameter.
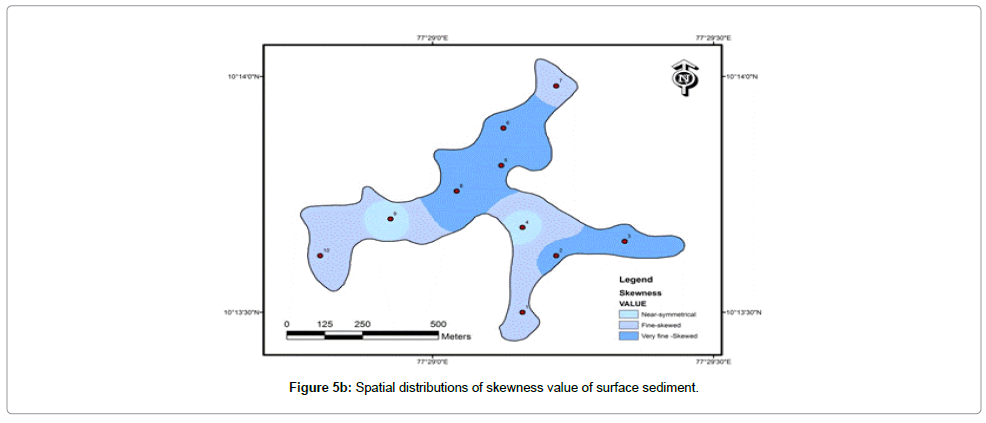
Figure 5b: Spatial distributions of skewness value of surface sediment.
Kurtosis (KG)
The kurtosis values of surface sediments ranges from 0.71 to 1.16 and falling in between platykurtic to leptokurtic type (Figure 6a). The leptokurtic values are due to the implications of poorly sorted sediments and presences of dominance of equal population of two are three modes. The presence of predominance of platykurtic type in the Sothwest and central part of the lake (Figure 6b) express that this region has less equipropotionate mixing of two (or) three modes.
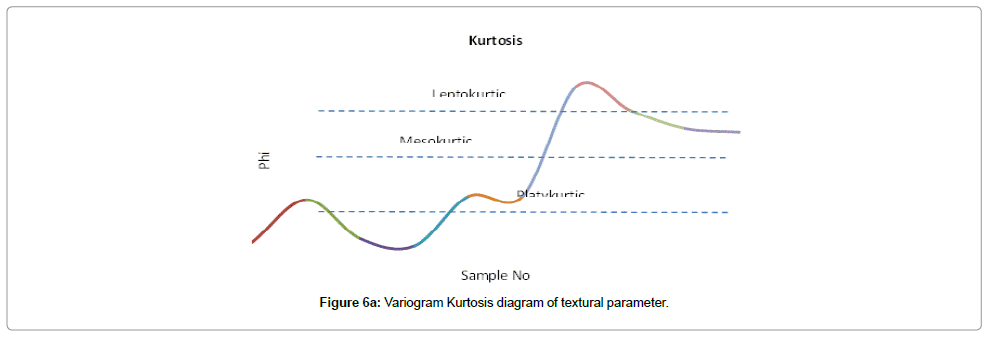
Figure 6a: Variogram Kurtosis diagram of textural parameter.
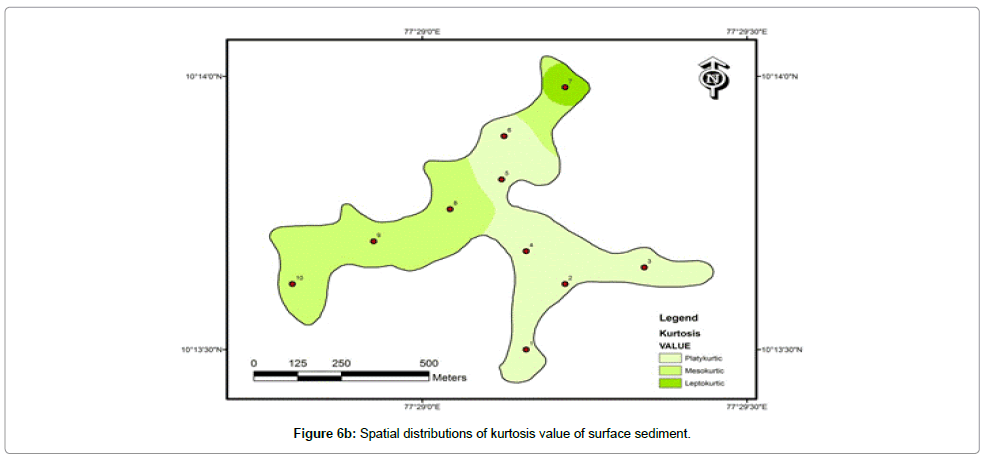
Figure 6b: Spatial distributions of kurtosis value of surface sediment.
Textural facies
In the USDA textural triangle diagram, the surface sediment were fall in four fields; Predominantly in loamy sand, two samples in the field of sand, two sample falls in sandy loam and two sample in the field of silty loam (Figure 7). It suggests that the surface sediment in to the four different sediments is classified type and the same were given the Table 2.
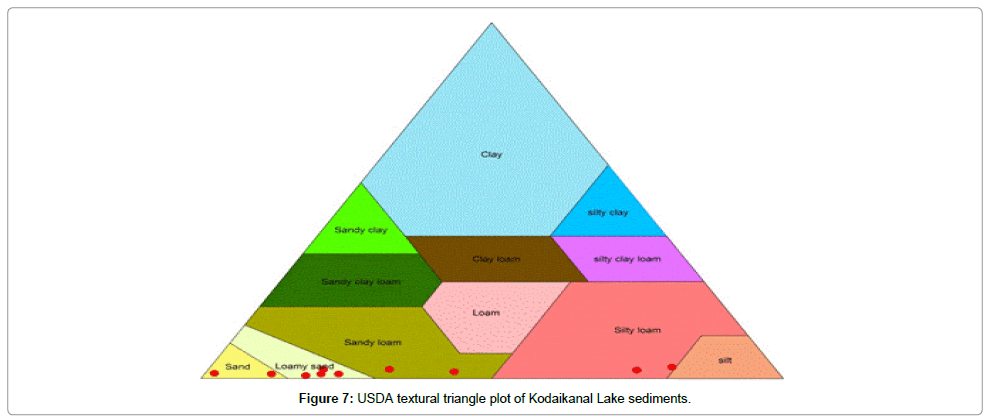
Figure 7: USDA textural triangle plot of Kodaikanal Lake sediments.
| Sample | Sand% | Silt% | Clay% | Texture |
|---|---|---|---|---|
| 1 | 69 | 31 | 0 | sandy loam |
| 2 | 79 | 21 | 0 | loamy sand |
| 3 | 78 | 22 | 0 | loamy sand |
| 4 | 58 | 41 | 1 | sandy loam |
| 5 | 79 | 21 | 0 | loamy sand |
| 6 | 82 | 18 | 0 | loamy sand |
| 7 | 97 | 1 | 2 | sand |
| 8 | 86 | 14 | 0 | sand |
| 9 | 22 | 74 | 4 | silt loam |
| 10 | 15 | 80 | 5 | silt loam |
Table 2: USDA textural triangle of sand-silt-clay percentage.
Bivariate plots
The plot of Graphic mean Vs Standard deviation (Figure 8), originally suggest by stewart’s [10] discrimination field to understand the energy process, indicates that the most of the surface sediment from Kodaikanal Lake distributed in the field of Quiet water environment, except few in Inner shelf only one sample fall in River process. The majority of sample falls in Quiet water environment.
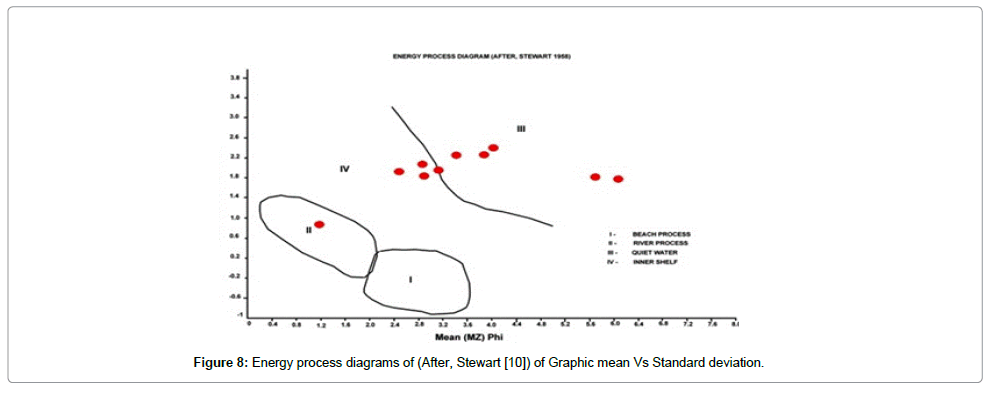
Figure 8: Energy process diagrams of (After, Stewart [10]) of Graphic mean Vs Standard deviation.
Discriminant Function Analysis
Discriminant function analysis (linear and multigrain) proposed by after Sahu [11] was applied for discriminating the depositional environment of the surface sediments. The surface sediment samples were fall scattered in Turbidite environment. An overall turbidite environment is indicated by linear discriminant function Analysis (Figure 9); suggest the sediments were transported by inequipropotional mechanism within the Lake.
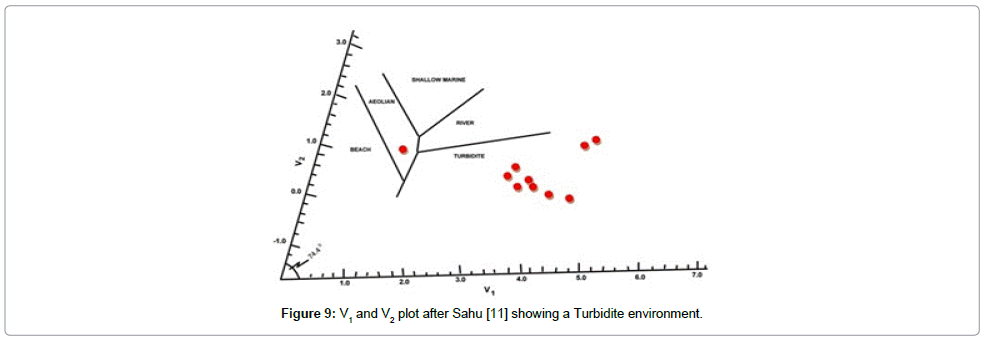
Figure 9: V1 and V2 plot after Sahu [11] showing a Turbidite environment.
CM-plots
The CM pattern represents a complete model of tractive current (depositional process) as shown by Passega [12], which consist of several segments such as NO, OP, PQ, QR and RS Indicating different modes of sediments transport. The entire surface sediment samples are scattered in the sectors PQ, QR and RS (Figure 10), the scattering is imparted due to the drastic differences in the hydrodynamic regimes prevailing in the area. The entire samples in Kodaikanal Lake surface sediment have first percentile values falling in between 200 and 1000 microns. This group reflects suspension and rolling mode of transportational history, indicating the complexity in the hydrodynamic process operating in this system [13].
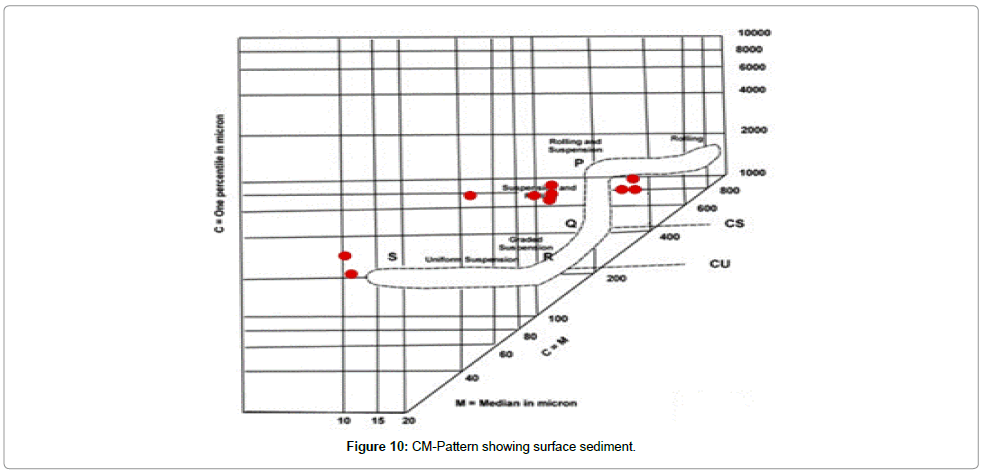
Figure 10: CM-Pattern showing surface sediment.
Conclusion
The study permits to infer the changes in the depositional environment during the period of infilling at the sites. The variation in grain size and textural characteristics in three different parts of the Kodaikanal Lake is related to the hydrodynamics. The transportational history reflects the suspension and rolling mode of transportation, also indicating the complexity in the hydrodynamic processes operating in this system. High energy deposits compose the basal sediments at each site. The sediment in the Turbidite environments, exhibits inequipropotional transportation of sediments under complex hydrodynamic process within the Kodaikanal Lake.
Acknowledgements
Authors would like to acknowledge the Department of Science and Technology (DST) Government of India for providing funds for this study. We are also thankful to the anonymous reviewer for his valuable comments to improve the quality of the paper.
References
- Friedman GM, Sanders JE (1978) Principle of Sedimentology.Wiley New York.
- Goudie A (1981) Geomorphological Techniques. (Edn) George Ailen and Unwin, Boston.
- Allen JRL, Duffy M J (1998) Temporal and spatial depositional patterns in the Severn estuary, South-western Brita in: Intertidal studies at spring-neap and seasonal scales, 1991-1993. Mar Geol 146: 147-171.
- Bhat MS, Chavadi VC, Hegde VS (2002) Morphological and textural characteristics of Kudle beach, Karnataka, central West coast of India. J GeolSoc India 59: 125-131.
- Blott SJ, Pye K (2001) Gradistat: A grain size distribution and statistics package for the analysis of unconsolidated sediments. Earth Surf Process Landforms 26: 1237-1248.
- Folk RL, Ward WC (1957) Brazos river bar: A study in the significance of grin parameters. J Sediment Petrol 27: 3-27.
- Sahu BK (1964) Depositional mechanism from the size analysis of clastic sediments. J Sed Petro 34: 73-83.
- Vijaykumar V, Vasudevan S, Pruthiviraj T (2013) An Assessment of morphometric characteristics of coastal lakes of Cuddalore district, Tamilnadu, South east coast of India by using GIS. IntJrAdv Res 1: 233-238.
- Pruthivraj T, Vasudevan S, Balamurugan P, Singhal RK, Selvaganapathi R, et al. (2013) Spatial distribution and Temporal variations in the Textural Characteristics of The Veeranam lake sediments, Cuddalore district, Tamil Nadu.Int J Recent Sci Res 4: 949-955.
- Stewart HB (1958) Sedimentary reflections of depositional environment in San Miguel Lagoon, Baja California, Mexico. American Association of Petroleum Geologists, Mexico.
- Sahu BK (1983) Multigroup discrimination of Depositional environments using size distribution statistics. Indian J earth Sci 10: 20-29.
- Passega R (1964) Grain size representation by CM pattern as a geological tool. J Sediment Petrol 34: 830847.
- Stokes S, Cambell SN, Healy TR (1989) Textural procedures for the environmental discrimination of late neogene coastal sand deposits, south west Auckland, Newzealand. SedGeol 61: 135-150.
Citation: Balamurugan P, Vasudevan S, Selvaganapathi R, Nishikanth CV (2014) Spatial Distribution of Grain Size Characteristics and its Role in Interpreting the Sedimentary Depositional Environment, Kodaikanal Lake, Tamil Nadu, India. J Earth Sci Clim Change 5: 217. DOI: 10.4172/2157-7617.1000217
Copyright: ©2014 Balamurugan P, et al. This is an open-access article distributed under the terms of the Creative Commons Attribution License, which permits unrestricted use, distribution, and reproduction in any medium, provided the original author and source are credited.
Select your language of interest to view the total content in your interested language
Share This Article
Recommended Journals
Open Access Journals
Article Tools
Article Usage
- Total views: 17045
- [From(publication date): 10-2014 - Jul 15, 2025]
- Breakdown by view type
- HTML page views: 12225
- PDF downloads: 4820