Statistical Analysis of Electric Vehicle Adoption in Trinidad and Tobago
Received: 27-Aug-2018 / Accepted Date: 10-Sep-2018 / Published Date: 14-Sep-2018 DOI: 10.4172/2576-1463.1000216
Keywords: Solar energy; Charging infrastructures; Statistical analysis
Introduction
Electric Vehicle (EV) is an alternative fuel vehicle that relies on electricity as energy resource. As such a large share of the automobile market will mean that there is a robust energy mix driving the cars of the future. EV is environment friendly, with zero tail-pipe emissions, but it relies on various sources of electricity generation. For EV to be ‘green’, the electricity should be generated from renewable energy sources.
Majority of today’s vehicles, power generators and plant machineries uses internal combustion engines. Due to the vast utilization of internal combustion engines in the modern world, there are growing concerns over the impact of the exhaust emissions from internal combustion engines on human health and the welfare of the environment [1]. These vehicles are powered via the burning of fossil fuels. Fossil fuels are considered as non-renewable resources since they take millions of years to form. However, their reserves are being exhausted faster than they are being generated and if this trend continues, the supply would run out within the next century.
The burning of fossil fuels releases carbon dioxide (CO2) emissions, a powerful greenhouse gas which vastly contributes to air pollution. Air pollution is a major environmental concern since it increases the risk for asthma and other respiratory diseases. Furthermore, the greenhouse gases traps heat in the atmosphere which makes the Earth warmer thereby significantly influencing climate change and global warming.
In an effort to reduce the greenhouse gases on the environment nearly 80 percent of the global auto market is pushing toward a phaseout of petroleum cars and adoption of electric vehicles. In July 2018, the UK government unveiled plans to halt the production of new petrol and diesel cars from 2040. Scotland’s target is eight years ahead of the rest of the UK.
France has also said it will ban sales of petrol and diesel cars by 2040. Meanwhile, Norway, which has the highest per capita number of all-electric cars in the world, wants to do it by 2025 [2]. Other countries such as the Netherlands and Germany are looking at similar initiatives. India, which is facing an air pollution crisis, says it wants to sell only electric cars within the next 13 years. Oslo proposed making its center car-free by 2019-six years before a country-wide ban goes into effect. And the mayors of Paris, Mexico City, Madrid and Athens have committed to stopping the use of diesel vehicles in order to improve air quality. When Paris banned cars with even-numbered plates for a day in 2014, pollution dropped by up to 30% [2].
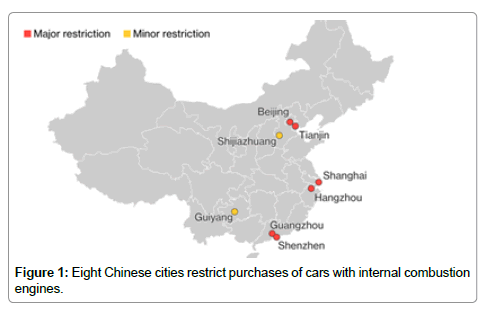
Many Chinese cities are set to add restrictions on fossil-fuel vehicles as the country fights air pollution and highway congestion. Sales in Beijing, Shanghai, Shenzhen, Tianjin, Hangzhou and Guangzhou are increasing by two to four times the national average, and purchases by individuals versus governments and car-sharing services are at a higher level than elsewhere as shown in Figure 1. This study carried out a research on the adoption of electric vehicles in Trinidad and Tobago. Even though electric vehicles require the burning of gasoline to produce the electricity needed to drive it, they are emissions free and alternative energy can also be utilized to power the vehicle.
Barriers to electric vehicle adoption
Within the last few years, interest has been focused on the effects of gasoline/diesel and its impact on the environment. The U.S. Energy Information Administration (2017) stated that the burning of gasoline and diesel produces carbon dioxide, a greenhouse gas, which results in the effect of global warming and climate change. With gasoline/ diesel being the main type of fuel used for powering vehicles today, an Alternative approach such as the Electric Vehicle (EV) must be considered [3].
EVs are 100% Eco-friendly since they are driven by electrical motors. They produce no toxic harmful gases onto the environment making it a great alternative to the Gasoline/Diesel powered automobiles. The modern day EV has key advantages over the conventional gas/diesel powered vehicles, which include smoother and quieter operation, low operating costs, faster acceleration and the ability to refuel at your own home [4].
However, several obstacles counteract the advantages of the EV that make the gasoline/diesel vehicle the most prevalent option between the two. Barriers to the implementation of EVs include Vehicle cost, limited Driving range, lengthy battery charging time and the need for a charging infrastructure at home, the workplace and public areas [4]. The authors also further discussed that the disposal of the battery will pose as a threat to the adoption of the EV since the owner of the vehicle may have to pay to properly dispose of the battery.
Similarly, Jim Motavalli described that along with all the other factors listed above, uncertain government supports also plays a role in hindering the adoption of EVs. Motavalli stated that State incentives are a big help that will subsequently encourage automobile customers to consider the option of purchasing the EV. Along with these factors, an additional barrier includes, cost of battery and maintenance. The author, similar to those listed above, agreed that Government incentives do affect the sales of the EV. In addition to that, they discussed that the experienced driver focuses on the cost and replacement of the battery as well as the maintenance of the vehicle [2].
Additionally, with the above factors also taken into consideration, Tsang et al. mentioned that safety concerns also hinder the up growth of the electric vehicles [5]. They stated that Electrical safety is a concern since the batteries used for the operation of the EV are Lithium-ion batteries which could act as a potential hazard when overheated or short-circuited. Another safety concern is the absence of engine noise. For an EV, the induction motor replaces the conventional engine but is considered as very quiet compared to the engine. The authors claims that the absence of the noise from the engine acts as a safety hazard for pedestrians, especially to the physically impaired. These factors listed above confines the adoption of the Electric Vehicle. In an effort to secure its adoption in the future, each factor will be thoroughly researched in the hope of providing recommendations that will be made to satisfy and motivate the customer in purchasing the EV.
How do countries/cities support electric vehicles?
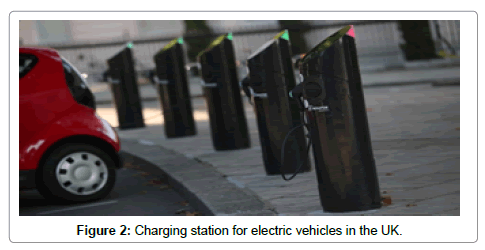
In an effort to reduce the greenhouse gases on the environment, many governments are undertaking certain actions in the hope of encouraging the adoption of electric vehicles in their respective Country/City. In the United Kingdom, the Department of Transport (DfT) assigned £400 million (equivalent to TT$ 3.6 billion) for the expansion of the sustainable vehicles, also known as green vehicles [6]. This included reducing the total cost of the vehicle by providing subsides, hence encouraging automobile customers to consider it as an option since in some cases, the total cost of the electric vehicle can fall below the cost of traditional vehicles. This package also includes funding for the development of the recharging infrastructure with the aim of promoting electric vehicle adoption as shown in Figure 2. In addition, EV owners are exempted from the annual ownership tax for their vehicle.
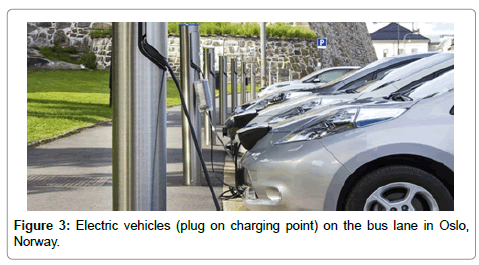
Norway however, offered somewhat different incentives compared to the UK. Norway offered many incentives of which the major ones included exemptions from registration tax and VAT, reduced annual vehicle fee, free vehicle charging and free use of roads for which there was a cost to non-electric vehicle owners [7]. Another key indirect incentive was the access to bus lanes. With the exemption of traditional vehicle owners, EV users had the option of using the bus lane, which was restricted only to buses at certain times of the day to help speed up public transportation as shown in Figure 3. EV users now benefited in faster transport to their destinations. Norway has been ranked as one of the top selling countries of electric cars due to these generous incentives, making it a very effective approach in encouraging EV adoption.
Table 1 below demonstrates that the numbers of EVs are increasing which indicates that the incentives listed are working in a positive manner in encouraging EV adoption.
| Year | units | % Growth |
|---|---|---|
| 2011 | 5,641.00 | |
| 2012 | 10,066.00 | 78.40 |
| 2013 | 17,709.00 | 75.90 |
| 2014 | 28,868.00 | 63.00 |
| 2015 | 38,598.00 | 33.70 |
| CAGR: 2011-2015 | 61.70 |
Table 1: Total number of electric vehicles in Norway.
In addition, grants are offered to persons who switch from diesel cars to electric vehicles. The European Union (EU) aims to achieve a 40% decrease in emissions and hopes that by offering these bonuses that it will accomplish its goals by 2030 [8]. Although this approach is different, it influences persons to switch to electric vehicles in order to benefit from the grants and rewards. This method is considered as effective since data obtained shows that Europe has made significant increase in the number of registered electric vehicles from less than 200,000 in 2012 to approximately 500,000 in 2016.
As shown in Table 2, between the periods 2012-2016, a large increase in the number of EV can be observed which indicates that the incentives offered are working in encouraging persons to make the switch from conventional vehicles.
| Year | units | % Growth |
|---|---|---|
| 2012 | 1,67,990.30 | |
| 2013 | 2,46,888.00 | 47.00 |
| 2014 | 2,81,655.00 | 14.10 |
| 2015 | 4,20,573.00 | 49.30 |
| 2016 | 4,99,480.00 | 18.80 |
| CAGR: 2012-2016 | 31.30 |
Table 2: Number of hybrid and electric units in Europe.
In the United States of America, most states also offer a number of tax exemptions, reduction in vehicle registration fee and also special tax credits. A number of states offer incentives such as tax credits which depend on the size of the electric vehicle and the capacity of its battery. However, this tax credit is limited to 200,000 units sold per qualified manufacturer [9].
In addition to this, special loans, vehicle vouchers and vehicle lane exemptions are also offered. The High Occupancy Vehicle (HOV) lanes are widely available across the United States which aims at transporting persons more efficiently as shown in Figure 4. However, Electric vehicles can only access these lanes only if a certain number of persons are in the vehicle.
Table 3 shows that even though the number of EV fluctuates for a given period, it can generally be noted that the number of EV is gradually increasing.
| Year | units | % Growth |
|---|---|---|
| 2012 | 4,87,480.00 | |
| 2013 | 5,92,232.00 | 21.50 |
| 2014 | 5,70,475.00 | 3.70 |
| 2015 | 4,98,426.00 | 12.60 |
| 2016 | 5,04,060.00 | 1.10 |
| CAGR: 2012-2016 | 0.80 |
Table 3: Number of electric vehicles in the United States.
China, in a similar manner also offers tax credits and subsidies for purchasing electric vehicles. Moreover, China has placed restrictions on license plates for both diesel and gas powered vehicles which forces consumers to look at alternative vehicles such as the electric vehicle. In recent years, China also added rebate programs to encourage the purchase of electric vehicles [10]. China is one of the leading countries of electric vehicle use and it can be noted that these incentives listed played a crucial part in allowing the country to make the switch from traditional vehicles.
Table 4 illustrates that within the past five years, the number of EVs has significantly increase by an average of 100,000 which implies that the incentives are effective in stimulating EV adoption.
| Year | units | % Growth |
|---|---|---|
| 2012 | 14,930.00 | |
| 2013 | 21,905.00 | 46.70 |
| 2014 | 1,19,963.00 | 447.70 |
| 2015 | 2,07,071.00 | 72.60 |
| 2016 | 336.000.0 | 62.30 |
| CAGR: 2012-2016 | 117.80 |
Table 4: Number of electric vehicles in China.
In conclusion, it was observed that government incentives play a crucial part in the adoption of electric vehicles. Although some countries offered different incentives than others and had different methods of encouraging people to make the switch to electric vehicles, it was generally seen that the number of electric vehicles increased in all countries that offered government assistance. These methods will be analyzed and looked at in an effort to offer the best recommendations to the Trinidad and Tobago government on promoting electric vehicle use.
Benefits of using electric vehicles
Electric vehicles offer a wide range of benefits to both the user of the vehicle and the environment. It can be noted that even though gas is required to produce electricity in many countries, the consumers still benefit significantly using electricity to power their vehicles than the traditional way of using gasoline or diesel.
As stated above, a benefit of electric vehicles include gas not being required to power the vehicle. Although there are electric vehicles that use gas (hybrids), this project is solely based on Plug-in Electric Vehicles (PEV) which exclusively runs on electricity alone. In a few countries, alternative energy sources are used to power the EV but the majority of countries that utilize EVs produce their electricity by means of a gas powered turbine. With this being said, consumers who use electric vehicles will see an increase in their electricity bill but the electric vehicle will be cheaper to run compared to traditional vehicles [11]. In some countries, free charging is offered as seen in Norway [7]. This greatly benefits the consumer since they would incur no charges on refuelling their electric vehicle.
Another benefit includes lower maintenance of an EV compared to standard vehicles. An electric vehicle has less moving parts than the regular petrol/diesel vehicles. This therefore means that the average electric vehicle owner will experience a greater savings since the EV would not require frequent maintenance. There is one cost that the EV owner would not be spared off which is the cost of replacing the lithiumion battery used to power the EV. However, investigations proved that the minimum battery life of an electric vehicle is four (4) years and the maximum is twelve (12) years [12]. Therefore, the EV user would only be charged a fee of replacing the battery for a minimum of every 4 years.
The electric vehicle also provides great benefits towards the environment. EVs significantly reduce the amount of emissions that contribute to climate change [11]. Gasoline and Diesel powers vehicles emit a great amount of Carbon Dioxide onto the environment, the result of which includes global warming and climate change. These emissions also increase air pollution and severely deteriorate the health of the average person. Internal Combustion engine also include pollutants such as carbon monoxide, carbon dioxide and nitrous oxides. Carbon monoxide hinders the ability of the blood to carry oxygen and can cause permanent damage to the nervous system. The EV remarkably reduces the amount of emissions on the environment and if renewable energy is used to produce the power required for the EV, the greenhouse gases will be reduced even further.
Electric vehicles provide key benefits essential for both the consumer and the environment. These benefits will positively affect the lives of Trinbagonians if electric vehicle is to become the most popular mode of transport throughout the twin islands.
The problem of motor vehicle emissions
According to the United Nations Environment Programme (UNEP) Emission Country Profile Report for 2013, Trinidad and Tobago ranked 2nd among the world with the highest carbon dioxide emissions per capita. From the report, it was observed that the total emissions from consumption of liquid fuels were approximately 3.7 million tonnes in 2008, almost all of which were generated from motor vehicles. In addition, the report claimed that Greenhouse Gas Emissions (GHGs) have expanded by 278% from the period 1990 to 2006 [13].
Methodology
This study seeks to discover the main factors affecting electric vehicle adoption in Trinidad and Tobago. Additionally, it explored whether different characteristics impact purchasing of an electric vehicle. The required sample size to derive estimates within 8% margin of error from a population of 1,353,895 is 150.
The measurement instrument
The questionnaire was developed after a review of the literature pertaining to electric vehicle adoption. The questionnaire comprised of twelve (12) questions each designed to collect sufficient information on the factors affecting electric vehicle adoption and the main characteristics that influence the purchase decision of an electric vehicle.
Data collection method
An interview was conducted with several automobile industries and professional individuals associated with the electric vehicle to gather a better understanding about electric vehicle operation and to determine the factors affecting its widespread adoption throughout Trinidad and Tobago. These factors were used to generate the questionnaire where a pilot test was conducted using 10 questionnaires to determine any flaws or weaknesses that may affect the validity of the study. The questionnaire was self-administered and distributed via google docs on February 2018.
Methods of data analysis
A. Cross-tabulations were used to examine the nominal and scale variables to assess whether there exist any relationships between the variables.
B. Principal Component Analysis or Factor Analysis was used to evaluate the 14 factors that affected electric vehicle adoption to determine which was the most important (Table 5) .
| Data | Sample Frequency | Sample Percentage (%) | ||
|---|---|---|---|---|
| Gender | Male | 102 | 68 | |
| Female | 48 | 32 | ||
| Age | 17-24 | 95 | 63 | |
| 25-30 | 18 | 12 | ||
| 31-40 | 24 | 16 | ||
| 41-50 | 11 | 7 | ||
| 51-60 | 1 | 1 | ||
| 60+ | 1 | 1 | ||
| Monthly Income | $0-5000 | 83 | 55 | |
| $5001-10,000 | 37 | 25 | ||
| $10,001-20,000 | 23 | 15 | ||
| >$20,000 | 7 | 5 | ||
| Profession | Field Staff | 88 | 59 | |
| Office Staff | 51 | 34 | ||
| No response | 11 | 7 | ||
| Education Level | Primary School | 2 | 1 | |
| Secondary School | 22 | 15 | ||
| A‘Levels | 64 | 43 | ||
| Undergraduate University | 60 | 40 | ||
| Postgraduate University | 2 | 1 | ||
| Knowledge on EV | Yes | 129 | 86 | |
| No | 21 | 14 | ||
| Benefits of EV | Yes | 107 | 71 | |
| No | 33 | 22 | ||
| No response | 10 | 7 | ||
| Purchase of EV | Yes | 100 | 67 | |
| No | 48 | 32 | ||
| No response | 2 | 1 | ||
| Purchase of EV due to renewable energy | Yes | 132 | 88 | |
| No | 18 | 12 | ||
| Charging of an EV | Home | 131 | 45 | |
| Work place | 75 | 26 | ||
| Public charging Stations | 83 | 29 | ||
| Factors Affecting EV adoption | High cost of EV | Strongly Agree | 42 | 28 |
| Agree | 35 | 23 | ||
| Neutral | 35 | 23 | ||
| Disagree | 21 | 14 | ||
| Strongly Disagree | 19 | 12 | ||
| High cost of replacement parts | Strongly Agree | 50 | 33 | |
| Agree | 42 | 28 | ||
| Neutral | 31 | 20 | ||
| Disagree | 17 | 11 | ||
| Strongly Disagree | 12 | 8 | ||
| High operating costs | Strongly Agree | 25 | 16 | |
| Agree | 26 | 17 | ||
| Neutral | 43 | 28 | ||
| Disagree | 37 | 24 | ||
| Strongly Disagree | 21 | 14 | ||
| High Cost and Availability of Insurance | Strongly Agree | 27 | 18 | |
| Agree | 38 | 26 | ||
| Neutral | 45 | 30 | ||
| Disagree | 23 | 15 | ||
| Strongly Disagree | 16 | 11 | ||
| Lack of qualified Technicians | Strongly Agree | 64 | 42 | |
| Agree | 35 | 23 | ||
| Neutral | 32 | 21 | ||
| Disagree | 6 | 4 | ||
| Strongly Disagree | 15 | 10 | ||
| Lack of replacement parts | Strongly Agree | 39 | 26 | |
| Agree | 47 | 31 | ||
| Neutral | 37 | 24 | ||
| Disagree | 16 | 10 | ||
| Strongly Disagree | 13 | 9 | ||
| Lack of operational knowledge | Strongly Agree | 37 | 24 | |
| Agree | 42 | 27 | ||
| Neutral | 30 | 20 | ||
| Disagree | 26 | 17 | ||
| Strongly Disagree | 18 | 12 | ||
| Lack of charging infrastructure | Strongly Agree | 61 | 40 | |
| Agree | 34 | 22 | ||
| Neutral | 33 | 22 | ||
| Disagree | 10 | 7 | ||
| Strongly Disagree | 14 | 9 | ||
| Lack of government support | Strongly Agree | 58 | 38 | |
| Agree | 28 | 19 | ||
| Neutral | 37 | 24 | ||
| Disagree | 17 | 11 | ||
| Strongly Disagree | 12 | 8 | ||
| Long charging time | Strongly Agree | 27 | 18 | |
| Agree | 28 | 18 | ||
| Neutral | 58 | 38 | ||
| Disagree | 28 | 19 | ||
| Strongly Disagree | 11 | 7 | ||
| Refuel locations | Strongly Agree | 44 | 29 | |
| Agree | 47 | 31 | ||
| Neutral | 38 | 25 | ||
| Disagree | 11 | 8 | ||
| Strongly Disagree | 11 | 7 | ||
| Short driving range | Strongly Agree | 19 | 13 | |
| Agree | 40 | 26 | ||
| Neutral | 42 | 28 | ||
| Disagree | 29 | 19 | ||
| Strongly Disagree | 21 | 14 | ||
| Low Speed | Strongly Agree | 17 | 11 | |
| Agree | 22 | 15 | ||
| Neutral | 55 | 36 | ||
| Disagree | 33 | 22 | ||
| Strongly Disagree | 24 | 16 | ||
| Safety | Strongly Agree | 26 | 17 | |
| Agree | 22 | 14 | ||
| Neutral | 54 | 36 | ||
| Disagree | 26 | 17 | ||
| Strongly Disagree | 24 | 16 |
Table 5: Data collected from the questionnaire.
Discussion and Analysis
Gender and purchase of an electric vehicle
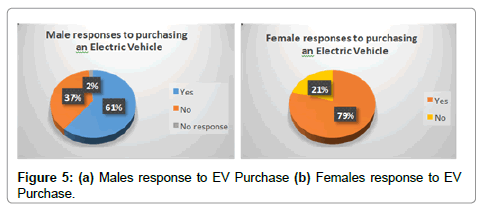
Crosstab analysis was conducted to evaluate the pattern of association between gender and purchase of an electric vehicle as shown in Table 6a. It was observed that female respondents were more likely (79.2%) to purchase an electric vehicle than male respondents (60.8%) as shown in Figures 5a and 5b. Conversely, male respondents were more likely (37.3%) to not purchase an electric vehicle when compared to their female counterparts (20.8%). Therefore, females are more likely to purchase an electric vehicle.
| Respondent's sex | Total | ||||
|---|---|---|---|---|---|
| Male | Female | ||||
| Purchase of an E.V | Yes | Count | 62 | 38 | 100 |
| % within Respondent's sex | 60.80% | 79.20% | 66.70% | ||
| No | Count | 38 | 10 | 48 | |
| % within Respondent's sex | 37.30% | 20.80% | 32.00% | ||
| No response | Count | 2 | 0 | 2 | |
| % within Respondent's sex | 2.00% | 0.00% | 1.30% | ||
| Total | Count | 102 | 48 | 150 | |
| % within Respondent's sex | 100.00% | 100.00% | 100.00% | ||
Table 6a: Purchase of an E.V and Respondent's sex Crosstabulation.
A 2 × 2 chi-square test shown in Table 6b was used to evaluate whether there was a significant relationship between gender and purchase of an electric vehicle. The results reveal that there is not a significant relationship between gender and purchasing of an electric vehicle, X2(2, N=150)=5.346, p=0.069.
| Value | df | Asymptotic Significance (2-sided) | |
|---|---|---|---|
| Pearson Chi-Square | 5.346 | 2 | 0.069 |
Table 6b: Chi-Square Tests.
Hence, Gender does not influence purchase decision of an electric vehicle.
Gender and knowledge on electric vehicle
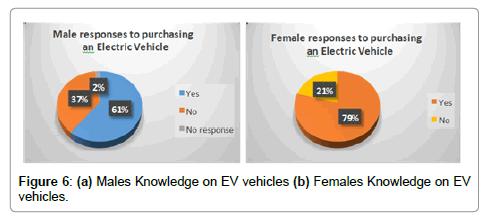
Crosstab analysis was used to assess the relationship between gender and knowledge of an electric vehicle as shown in Table 7a. It was discovered that males (88.2%) were more likely to know about the electric vehicle compared to female respondents (81.3%). Conversely, Female respondents (18.8%) were more likely to not know about the electric vehicle in comparison to the male respondents (11.8%) as shown in Figures 6a and 6b. Therefore, males are more likely to know about the electric vehicle.
| Respondent's sex | Total | ||||
|---|---|---|---|---|---|
| Male | Female | ||||
| Knowledge on E.V | Yes | Count | 90 | 39 | 129 |
| % within Respondent's sex | 88.20% | 81.30% | 86.00% | ||
| No | Count | 12 | 9 | 21 | |
| % within Respondent's sex | 11.80% | 18.80% | 14.00% | ||
| Total | Count | 102 | 48 | 150 | |
| % within Respondent's sex | 100.00% | 100.00% | 100.00% | ||
Table 7a: Knowledge on E.V and Respondent's sex Crosstabulation.
Using a 2 × 2 chi-square test as shown in Table 7b, a test was done to determine if there was a statistically significant relationship between gender and knowledge on an electric vehicle. The sample included 150 respondents of which 129 knew about the electric vehicle while 21 did not. These frequencies were significantly different X2(1, N=150)=1.323, p=0.250. Therefore, knowing about an electric vehicle is not influenced by gender.
| Value | df | Asymptotic Significance (2 sided) | Exact Sig. (2 sided) | Exact Sig. (1 sided) | |
|---|---|---|---|---|---|
| Pearson Chi-Square | 1.323a | 1 | 0.25 |
Table 7b: Chi-Square Tests.
Age and purchase of an electric vehicle
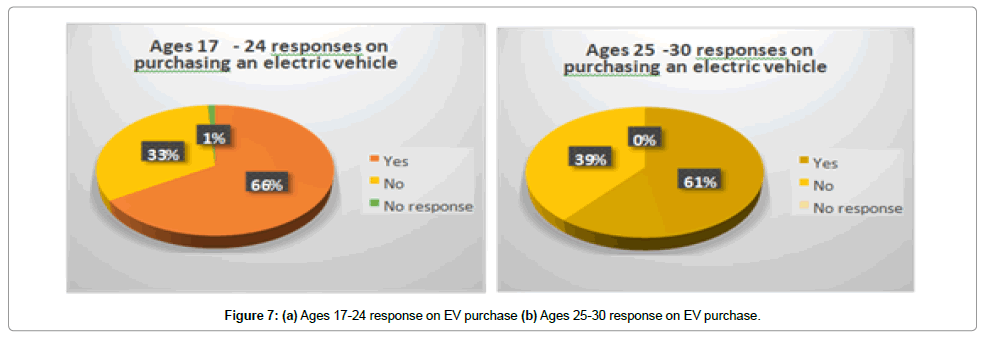
To assess the pattern of association between age and purchasing of an electric vehicle, a crosstab analysis (Table 8a) was conducted where it was observed that respondents within the age of 31-40 (79.2%) were more likely to purchase an electric vehicle followed by respondents within the age of 17-24 (66.3%), followed by respondents within the age of 25-30 (61.1%) and lastly respondents within the age of 41-50 (54.5%) as shown in Figures 7a-7d.
| Respondent’s Age | Total | ||||||||
|---|---|---|---|---|---|---|---|---|---|
| 17- 24 | 25-30 | 31-40 | 41-50 | 51-60 | 60+ | ||||
| Purchase of an E.V | Yes | Count | 63 | 11 | 19 | 6 | 1 | 0 | 100 |
| % within Respondent's age | 66.30% | 61.10% | 79.20% | 54.50% | 100% | 0.00% | 66.70% | ||
| No | Count | 31 | 7 | 4 | 5 | 0 | 1 | 48 | |
| % within Respondent's age | 32.60% | 38.90% | 16.70% | 45.50% | 0% | 100% | 32.00% | ||
| No Response | Count | 1 | 0 | 1 | 0 | 0 | 0 | 2 | |
| % within Respondent's age | 1.10% | 0.00% | 4.20% | 0.00% | 0.00% | 0.00% | 1.30% | ||
| Total | Count | 95 | 18 | 24 | 11 | 1 | 1 | 150 | |
| % within Respondent's age | 100% | 100% | 100% | 100% | 100% | 100% | 100% | ||
Table 8a: Purchase of an E.V and Respondent's age Crosstabulation.
A 3 × 6 chi-square test as shown in Table 8b, was used to evaluate whether there was a statistically significant relationship between age and purchase of an electric vehicle. The relation between these variables were quite insignificant X2(10, N=150)=8.067, p=0.622. Hence, age has no influence on purchasing an electric vehicle.
| Value | df | Asymptotic Significance (2 sided) | |
|---|---|---|---|
| Pearson Chi-Square | 8.067a | 10 | 0.622 |
Table 8b: Chi-Square Tests.
Monthly income and purchase of an electric vehicle
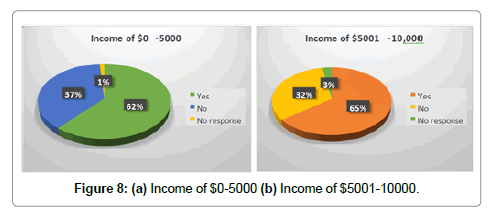
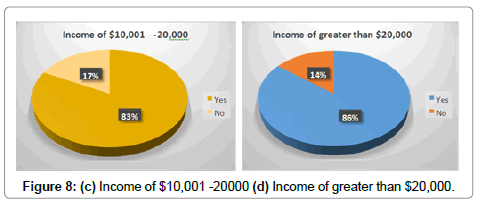
Cross tab analysis was performed to analyze the relationship between monthly income and purchase of an electric vehicle as shown in Table 9a. It was discovered that respondents with a monthly income of greater than $20,000 (85.7%) were more likely to purchase an electric vehicle followed by respondents with a monthly income of $10,001- 20,000 (82.6%), followed by respondents with a monthly income of $5001-10,000 (64.9%) and lastly followed by respondents with a monthly income of $0-5000 (61.4%) as shown in Figures 8a-8d.
| Monthly Income | ||||||||
|---|---|---|---|---|---|---|---|---|
| $0-5000 | $5000-10,000 | $10,001- 20000 | Greater than $20000 | Total | ||||
| Purchase of an E.V | Yes | Count | 51 | 24 | 19 | 6 | 100 | |
| % within Income | Monthly | 61.40% | 64.90% | 82.60% | 85.70% | 66.70% | ||
| No | Count | 31 | 12 | 4 | 1 | 48 | ||
| % within Income | Monthly | 37.30% | 32.40% | 17.40% | 14.30% | 32.00% | ||
| No response | Count | 1 | 1 | 0 | 0 | 2 | ||
| % within Income | Monthly | 1.20% | 2.70% | 0.00% | 0.00% | 1.30% | ||
| Total | Count | 83 | 37 | 23 | 7 | 150 | ||
| % within Income | Monthly | 100.00% | 100.00% | 100.00% | 100.00% | 100.00% | ||
Table 9a: Purchase of an E.V and Monthly Income Crosstabulation.
Conversely, respondents with a monthly income of $0-5000 (37.3%) were least likely to purchase an electric vehicle followed by respondents with a monthly income of $500110,000 (32.4%), followed by respondents with a monthly income of $10,001-20,000 (17.4%), and followed by respondents with a monthly income of greater than $20,000 (14.3%).
A 3 × 4 chi-square test was used to assess whether there was a statistically significant relationship between monthly income and purchasing of an electric vehicle. As can be seen by the frequencies cross tabulated in Table 9b, there is no significant relationship between monthly income and purchasing of an electric vehicle, X2(6, N=150)=5.511, p=0.480. Therefore, there is no significant relationship between monthly income and purchasing of an electric vehicle.
| Value | df | Asymptotic Significance (2 sided) | |
|---|---|---|---|
| Pearson Chi-Square | 5.511a | 6 | 0.48 |
Table 9b: Chi-Square Tests.
Education and purchase of an electric vehicle
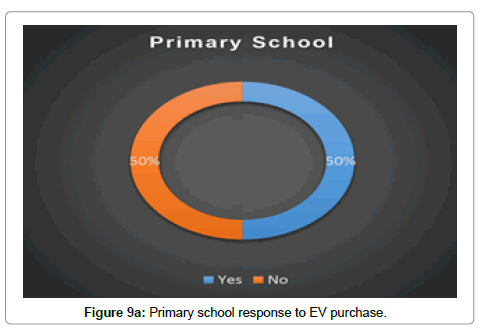
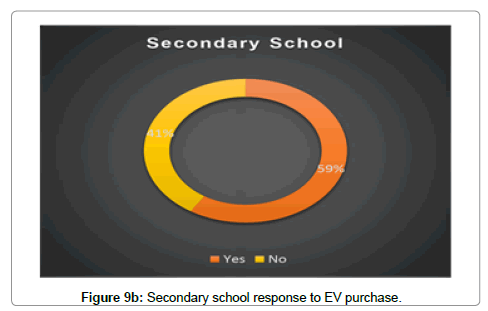
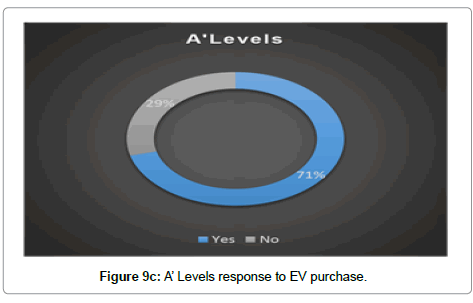
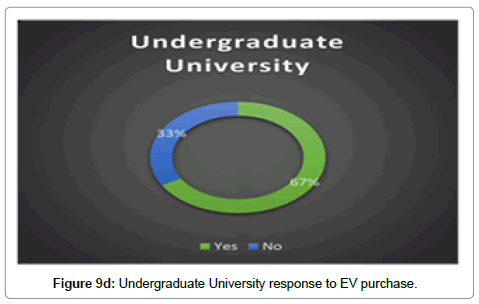
Crosstab analysis (Table 10a) was conducted to assess the pattern of association between education and purchasing an electric vehicle. The results show that post-graduate university respondents (100%) were more likely to purchase an electric vehicle, followed by A’ levels respondents (68.8%), followed by undergraduate university respondents (66.7%), followed by secondary school respondents (59.1%), and lastly followed by primary school respondents (50.0%) as shown in Figures 9a-9e. Therefore, the higher the level of education, the more likely a person to purchase an electric vehicle.
| Level of education | ||||||||
|---|---|---|---|---|---|---|---|---|
| Primary school | Secondary School | A'Levels | Undergraduate University | Post graduate University | Total | |||
| Purchase of an E.V | Yes | Count | 1 | 13 | 44 | 40 | 2 | 100 |
| % within Level of education | 50.00% | 59.10% | 68.80% | 66.70% | 100.00% | 66.70% | ||
| No | Count | 1 | 9 | 18 | 20 | 0 | 48 | |
| % within Level of education | 50.00% | 40.90% | 28.10% | 33.30% | 0.00% | 32.00% | ||
| No response | Count | 0 | 0 | 2 | 0 | 0 | 2 | |
| % within Level of education | 0.00% | 0.00% | 3.10% | 0.00% | 0.00% | 1.30% | ||
| Total | Count | 2 | 22 | 64 | 60 | 2 | 150 | |
| % within Level of education | 100.00% | 100.00% | 100.00% | 100.00% | 100.00% | 100 | ||
Table 10a: Purchase of an E.V and Level of education Crosstabulation.
A 3 × 5 chi-square test shown in Table 10b was used to evaluate whether there was a statistically significant relationship between level of education and purchasing of an electric vehicle. From the results, it was observed that there was not a statistically significant relationship between the level of education and purchasing of an electric vehicle, X2(8, N=150)=5.057, p=0.751. Hence, education does not impact purchasing of an electric vehicle.
| Value | df | Asymptotic Significance (2-sided) | |
|---|---|---|---|
| Pearson Chi-Square | 5.057a | 8 | 0.751 |
Table 10 (b): Chi-Square Tests.
Profession and purchase of an electric vehicle
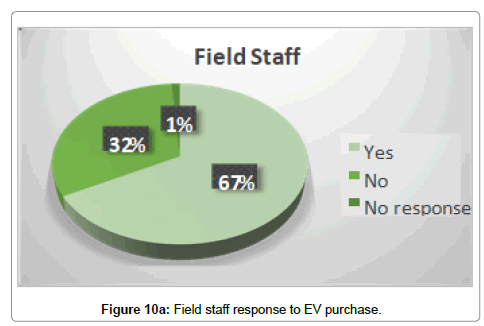
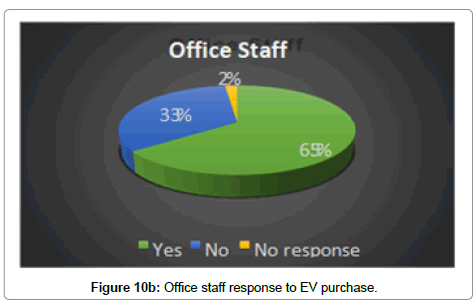
The crosstab analysis was used to determine the pattern of association between profession and purchase of an electric vehicle as shown in Table 11a. It was observed that field staffs (67.0%) were more likely to purchase an electric vehicle than office staff (64.7%). Conversely, office staffs (33.3%) were more likely to not purchase an electric vehicle compared to field staff (31.8%) as shown in Figures 10a and 10b. Therefore, field staffs are more likely to purchase an electric vehicle.
| Respondent's profession | |||||||
|---|---|---|---|---|---|---|---|
| Field Staff | Office Staff | No response | Total | ||||
| Purchase of an E.V | Yes | Count | 59 | 33 | 8 | 100 | |
| % within profession | Respondent's | 67.00% | 64.70% | 72.70% | 66.70% | ||
| No | Count | 28 | 17 | 3 | 48 | ||
| % within profession | Respondent's | 31.80% | 33.30% | 27.30% | 32.00% | ||
| No response | Count | 1 | 1 | 0 | 2 | ||
| % within profession | Respondent's | 1.10% | 2.00% | 0.00% | 1.30% | ||
| Total | Count | 88 | 51 | 11 | 150 | ||
| % within profession | Respondent's | 100.00% | 100.00% | 100.00% | 100.00% | ||
Table 11a: Purchase of an E.V and Respondent’s profession Crosstabulation
A 3 × 3 chi-square test shown in Table 11b was used to determine if there was a statistically significant relationship between profession and purchasing of an electric vehicle. The results reveal that the relationship was not significant, X2(4, N=150)=0.521, p=0.971. Hence, profession does not influence purchasing of an electric vehicle.
| Value | df | Asymptotic Significance (2sided) | |
|---|---|---|---|
| Pearson Chi-Square | .521a | 4 | 0.971 |
Table 11b: Chi-Square Tests.
Factor analysis
The 14 items obtained as the main factors affecting electric vehicle adoption in Trinidad and Tobago were subjected to a Principal Component Analysis (PCA) using SPSS version 24. Prior to performing PCA, the suitability of data for factor analysis was assessed. The Kaiser- Meyer-Olkin value was 0.850, exceeding the recommended value of 0.5 as shown in Table 12a (IBM Knowledge Center n.d.). Bartlett‘s test of Sphericity [14] reached statistical significance (p=0.000), supporting that factor analysis is suitable for the data (IDRE n.d.)
| Kaiser-Meyer-Olkin Measure of Sampling Adequacy | 0.85 | |
| Bartlett's Test of Sphericity | Approx. Chi-Square | 894.601 |
| df | 91 | |
| Sig. | 0 | |
Table 12a: KMO and Bartlett’s Test.
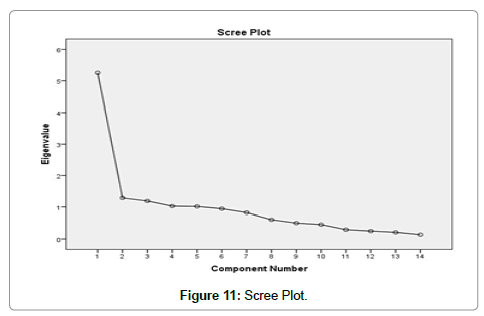
Principal Component Analysis revealed the presence of three (3) components explaining 37.531%, 9.17% and 8.49% of the variance respectively as shown in Table 12b. An inspection of the Scree Plot shown in Figure 11, revealed a clear break after the eight component. Using Cattell‘s scree test, it was decided to retain three components for further investigation [15].
| Initial Eigenvalues | Extraction Sum of Squared Loadings | Rotation Sums of Squared Loadings | |||||
|---|---|---|---|---|---|---|---|
| Component Total | % of Variance | Cumulative % | Total | % of Variance | Cumulative % | Total | |
| 1 | 5.254 | 37.531 | 37.531 | 5.254 | 37.531 | 37.531 | 4.864 |
| 2 | 1.284 | 9.174 | 46.706 | 1.284 | 9.174 | 46.706 | 1.363 |
| 3 | 1.189 | 8.491 | 55.197 | 1.189 | 8.491 | 55.197 | 3.222 |
| 4 | 1.027 | 7.334 | 62.53 | ||||
| 5 | 1.015 | 7.25 | 69.78 | ||||
| 6 | 0.944 | 6.744 | 76.524 | ||||
| 7 | 0.824 | 5.888 | 82.412 | ||||
| 8 | 0.608 | 4.342 | 86.754 | ||||
| 9 | 0.503 | 3.592 | 90.346 | ||||
| 10 | 0.455 | 3.253 | 93.599 | ||||
| 11 | 0.295 | 2.108 | 95.707 | ||||
| 12 | 0.252 | 1.797 | 97.504 | ||||
| 13 | 0.212 | 1.512 | 99.016 | ||||
| 14 | 0.138 | 0.984 | 100 | ||||
Table 12b: Total Variance Explained.
To aid in the interpretation of these three components, the component matrix was used which revealed a number of strong loadings. Each factor had a few high loadings and a larger number of low loadings Table 12c.
| Component | 1 | 2 | 3 |
|---|---|---|---|
| High Cost of E.V | 0.627 | 0.579 | |
| High Cost of Replacement Parts | 0.809 | ||
| High Operating Costs | 0.504 | 0.463 | 0.53 |
| High Cost and Availability of Insurance | 0.489 | ||
| Lack of qualified technicians | 0.845 | ||
| Lack of replacement parts | 0.851 | ||
| Lack of operational knowledge | 0.713 | ||
| Lack of charging infrastructure | 0.823 | ||
| Lack of government support | 0.738 | ||
| Long charging time | 0.637 | ||
| Refuel locations | |||
| Short Driving Range | 0.431 | 0.332 | |
| Maximum speed that can be achieved | |||
| Safety | 0.351 | 0.654 |
Table 12c: Component Matrix.
Detailed inspection of the three components disclosed that the 14 factors that affect electric vehicle adoption can be divided into the following subgroups:
• Support Systems
• Electric Vehicle Costs
• Safety
From the data collected and the principal component analysis conducted, it was observed that the three factors listed above are predominantly responsible for preventing electric vehicle adoption in Trinidad and Tobago.
Charging infrastructure
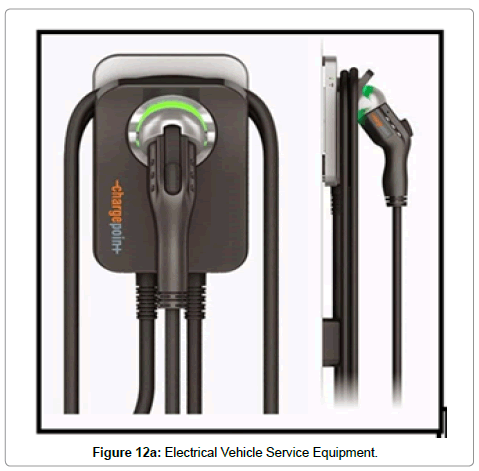
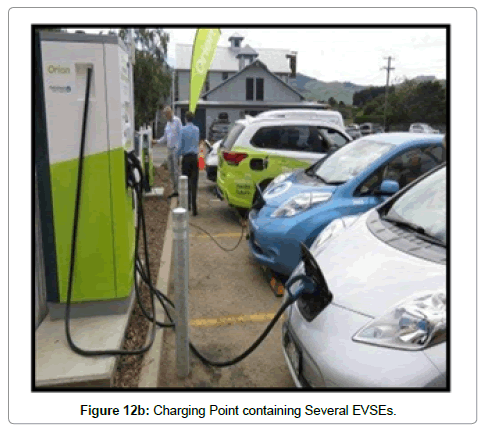
The allocation of Electric Vehicle Supply Equipment (EVSE) as shown in Figure 12a is essential to the adoption of EVs. The sole purpose of the EVSE is to safely deliver the electricity to the vehicle charging system. A charging station comprises of several charging points, each of which contains a set of charging equipment as shown in Figure 12b. Given that a high electric current is necessary to charge an EV, the EVSE contains protection devices to ensure a secured, risk-free charging process. It also encompasses several safety features to prevent mishaps such as driving the vehicle with the power cord attached to an outlet.
The EVSE are categorized into three classes (Northeast Utilities):
• Level One (120 Volts)
• Level Two (240 Volts)
• Level Three (3 phase) -DC Fast Charging (DCFC)
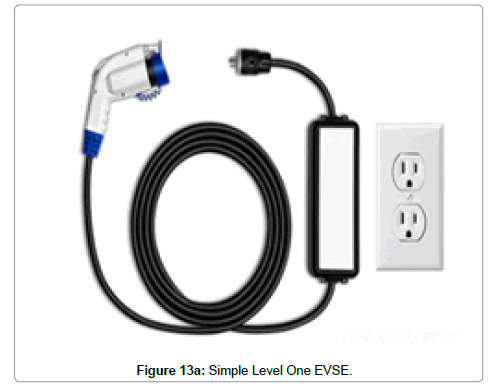
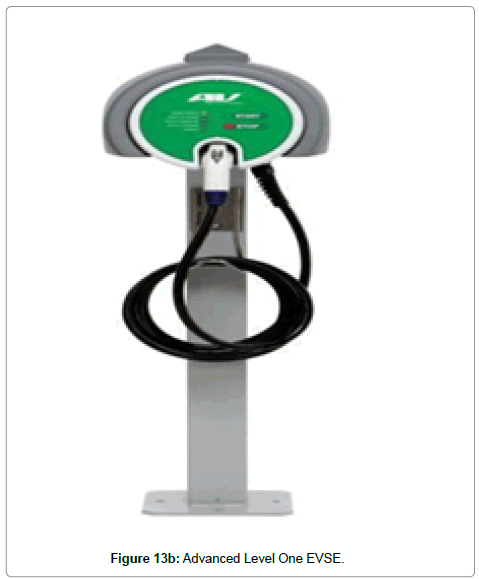
Level one (120 volts): Level One charging EVSE utilizes the standard 120-volt current found in household-type sockets. This is accomplished using the power equipment that is provided with the vehicle. This system makes it possible for customers to recharge their vehicle without any major electrical upgrades. This type of system is also quite effective for businesses that desire charging availability for electric vehicles since the installation of this system is simple as installing 120 volt outlets. The main advantage of this system is the low installation cost of the system. However, the disadvantage is that the charging time is very slow. In general, EV‘s employing this charging method would obtain an average of 5 miles or 8 kilometres per hour of charge. The lowest price Level One EVSE is a simple plug-in cord set connection as shown in Figure 13a which on average costs US $300 (EV Solutions n.d.). The Level One pedestal unit with access control and cable management as shown in Figure 13b can cost up to US $1500. This variation in price is due to the access control that allows for the variation in power as needed.
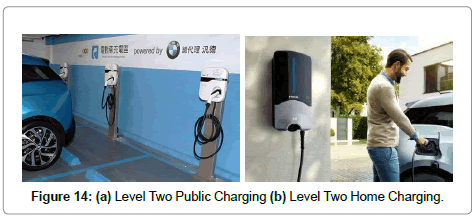
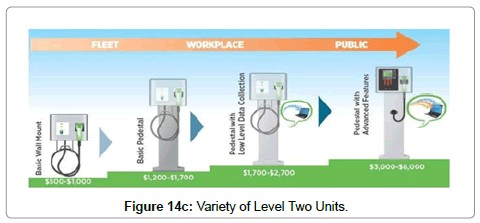
Level two (240 volts): Level Two charging EVSE operates on 240- volt power which allows for faster charging of the EV. This system is the most common home and public charging technique as illustrated in Figures 14a and 14b. This category of EVSE requires the installation of electrical wiring capable of conducting higher voltage power. The main advantages of this system includes faster charger time compared to level one since with this system, EV‘s would get between 10 and 20 miles per hour of charge. Regardless, installation costs are higher than level 1. The price of this system ranges from US $500 - $6000 (EV Solutions).
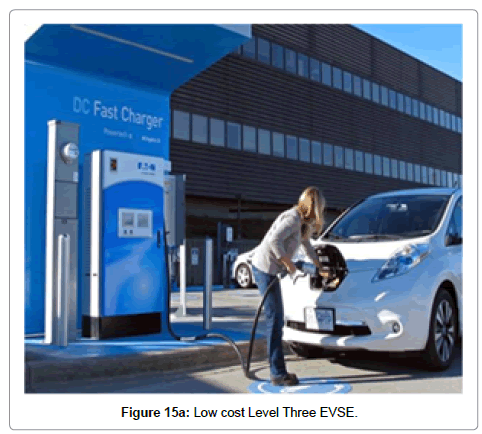
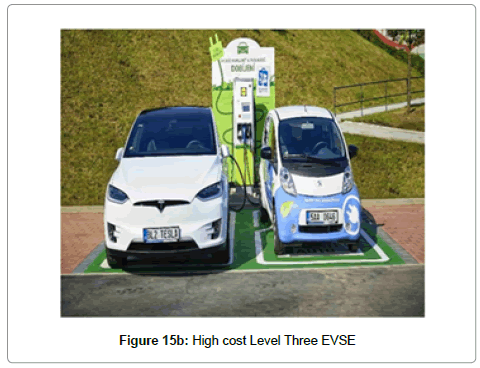
Level three (3 phase): Level Three charging EVSE provides fast charging for compatible vehicles with a charge of 80% within 20-30 minutes. This system requires more power than the average household requires and hence is recommended for charging stations, street side charging and commercial users. The main advantage of this system is the reduced charging time. However, the equipment cost is much higher than both level one and two charging. Prices of this system vary from approximately US $10,000 to $40,000 (EV Solutions) with $10,000 being the cost of the system with the lowest power (25-50 kW), low charging amperage and only one charging port as shown in Figure 15a. The highest price DCFC possesses high power (50 kW+) with high charging amperage and comprises of multiple charging ports, allowing several vehicles to recharge at once as shown in Figure 15b.
Table 13a compares the different type of EVSE where it displays the power required for each EVSE, the power delivered to the EV being recharged and the length of time it takes to recharge a 24 Kwh battery. Table 13b illustrates the cost range of all three EVSE systems as discussed above.
| EVSE Type | Power Supply | Charge Power | Charging time (Approx.) for a 24kWH Battery |
|---|---|---|---|
| Level 1 (AC charging) | 120VAC 12A to 16A (single phase) | ~1.44kW to ~1.92kW | ~17 Hours |
| Level 2 (AC charging) | 208~240VAC 15A~80A (Single/Split Phase) | ~3.1kW to ~19.2kW | ~8 Hours |
| Level 3 (combo charging system or DC Charging) | 300 to 600 VDC (Max 400A) (Poly Phase) | From 120kW upto 240kW | ~30 Minutes |
Table13a: Types of EVSEs.
| EVSE Type (single port) | EVSE Unit Cost Range |
|---|---|
| Level 1 | $300-$1,500 |
| Level 2 | $400-$6,500 |
| DCFC | $10,000-$40,000 |
Table 13b: Cost range of EVSEs
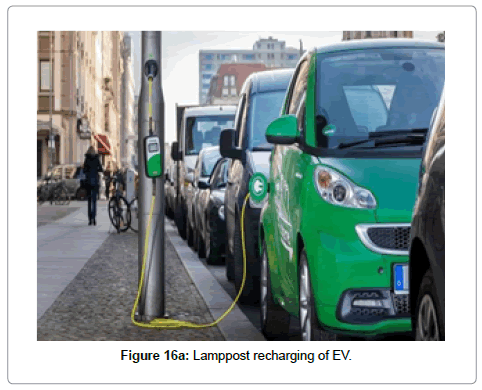
The Simple Socket is another means by which the electric vehicle can be recharged as illustrated in Figure 16a. This a straightforward and convenient method that converts existing street lamps into charging stations with the simple installation of a socket into the post. In Germany, a company by the name of Ubitricity developed the Simple Socket which when used with a Smart Cable, allows for the immediate recharging of the vehicle [16].
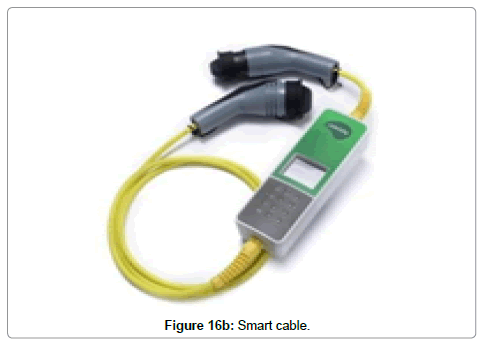
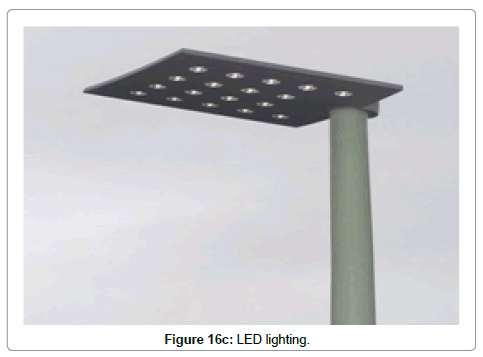
Figure 16b displays the Smart Cable, which functions as an electricity meter. This device communicates data with Ubitricity to initiate charging from the lamppost then transfers the usage data back to the server. In turn, Ubitricity bills the customer for the power consumed [17]. To reduce the energy consumption of the light pole itself, the company equipped the lamppost with LED lighting as demonstrated in Figure 16c. Thus, this results in more energy available to power the EV.
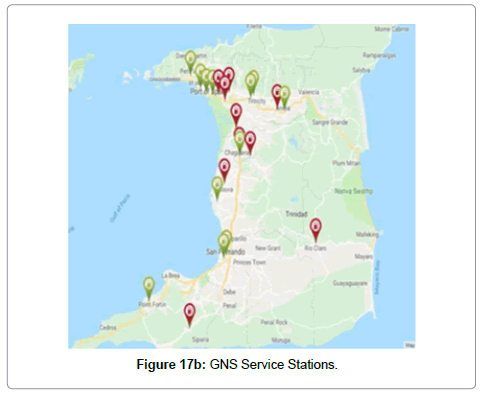
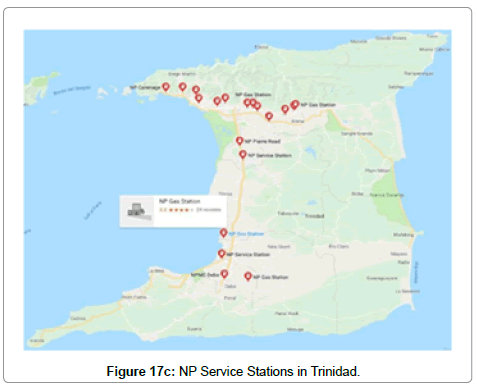
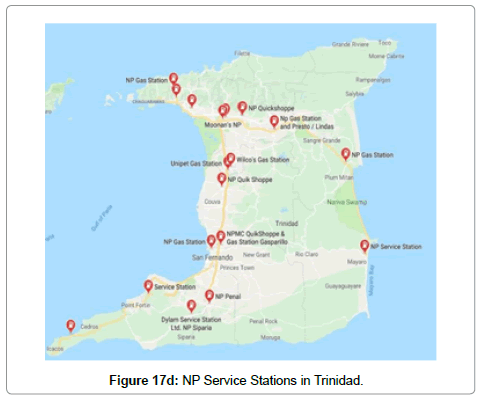
To promote the adoption of electric vehicles in Trinidad and Tobago, the above methods must be considered when examining the options to recharge the electric vehicle. Gasoline/Diesel vehicles dominate the nation roads today, with a small percentage being CNG driven vehicles. Figures 17a-17e illustrates the service stations for these vehicles. However, it can be observed that there currently exists no electric vehicle charging stations in Trinidad and Tobago. The development of the EV charging infrastructure is critical for the adoption of EVs since it is the key component required for powering the vehicles. The charging methods listed above can be applied in Trinidad and Tobago since the power supply requirements of each EVSE can be easily fulfilled. However, charging infrastructures need to be developed to achieve the EV user need of recharging at locations convenient to him.
Tables 14a and 14b illustrates an estimated minimum and maximum cost respectively of the EVSE systems in TT dollars. This conversion was accomplished using a local company Inbound Shipping Estimator. Using the respective shipping and handling rates as well as the corresponding VAT and Duty Tax. The respective weights of the systems were also taken into considerations where the Level One, Two and Three weights were found to be approximately 5.5 lbs, 10 lbs and 590 lbs respectively [9]. It must be noted that these values do not include installation of the system.
| EVSE Type | Cost |
|---|---|
| Level One | $3,383 |
| Level Two | $4,580 |
| Level Three | $126,591 |
[US to TT conversion (April 2018): 1 US dollar=6.75 TT dollars]
Table 14a: Minimum cost of EVSE in TT dollars.
| EVSE Type | Cost |
|---|---|
| Level One | $15,995 |
| Level Two | $68,688 |
| Level Three | $441,880 |
Table 14b: Maximum cost of EVSE in TT dollars.
The cost of the EVSE may vary between the minimum and maximum costs listed above. This cost can seem very high for first time users willing to purchase an electric vehicle. Businesses willing to install these systems may also become hesitant in purchasing it due to its high cost. These prices exclude installation, which thereby means an increase in the total cost of these systems. Table 15 represents a list of government incentives, funding, initiatives and infrastructure in different countries which aids in reducing the total cost of the EVSE system [16]. With the implementation of any of these actions undertaken by these countries, the cost of the EVSE system would be reduced [18].
| Japan | Singapore | UK | US | Hong kong | |
|---|---|---|---|---|---|
| Government Incentives | Subsidise 50 percent of cost; subsidy increased to 67 percent if the life plan of local govt. or highway agencies is followed | -- | Subsidise 75 percent of the cost, capped at £900 | Tax credit of up to US $1000 for individuals and US $30,000 for commercial buyers | Grant concessions on Gross Floor Areas (GFA) for " EV charging- enabled" car parks in new buildings |
| Government Funding | ¥100.5 billion to expand charging infrastructure to ~12,000 charging points | -- | £37 million of funding for charging infrastructure; another 32 million mainly for a DC quick charging network | 230 million for the "EV project",EVSE deployment is part of the project | -- |
| Government Initiatives | collobaration with Toyota, Nissan, Honda and Mitsubishi announced, agreeing to support the goal of installing 4,000 DC quick EVSE and 8,000 semi-quick EVSE, and build a convenient and accessible charging network | Electric vehicles (Evs) Test-Bed programme to examine issues relevant to policies regarding roll-out of Evs. Awarding of "Green Mark" points by the Building and Construction Authority to buildings which allocate charging facilities | "Plugged-in-places" (PIP) fund to support EV charging infrastructure. Require all publicly-accessible govt-funded EVSE to be placed on a freely-accessible national dataset used by websites, apps and Sat-Nav developers to communicate EVSE lactions to drivers | The "EV project" collects and analyses data to characterise vehicle use and evaluate the effectiveness of charge infrastructure. Workplace Charging challenge, aiming to achieve a tenfold increase in the number of US employers offering workplace charging | A pilot scheme to enable electric taxi suppliers to install quick chargers at car parks administered by the Transport Department. Replace 100 standard EVSE with semi-quick EVSE. |
| Government-built infrastructure | Fund 4,000 DC quick EVSE and 8,000 semi-quick EVSE | Install 68 standard EVSE and 3 DC quick EVSE in the Evs Test-Bed programme | Fund>5,500 charging points in "Plugged-in Places" Programme | Fund 11,846 semi-quick and 87 DC quick EVSE in the "EV Project" | Install~500 standard EVSE and 100 semi-quick EVSE at government car parks |
Table 15: Government support of EVSE in several countries.
The government of Trinidad and Tobago aims at increasing the usage of alternative vehicles by providing a range of incentives that reduces the total cost of the electric vehicle [18]. These incentives are exceptionally significant in attracting new vehicle owners since the reduction in total cost results in savings for the owners of the vehicle.
However, no focus was done on developing the charging infrastructure essential for powering the EV. This acts as one of the main factors affecting EV adoption since the potential EV users cannot rely on their charging system when travelling long distances. The EVSE built onto the electric vehicle charging system can be plugged in at any 120-volt electrical outlet to recharge the vehicle but may take several hours to be fully recharged. In addition, these systems may be considered expensive for first time EV users. Charging stations must be developed to permit users to recharge their vehicles in a short space of time. The DC Fast Charging allows for a short and effective recharging time but requires the government’s intervention for it to become reality. With tax incentives and funding, the total cost of the EVSE systems can be remarkably reduced, thereby encouraging persons to consider the switch to electric vehicle adoption.
For example, from Table 15 above, it can be seen that Japan offers a 50% subsidy of the total cost of the EVSE. If the government of Trinidad and Tobago follows the initiative undertaken by the Japanese government, a significant decrease can be observed in EVSE costs, hence allowing for a greater chance of EV adoption. The following Tables 16(a) and 16(b) illustrates the cost of the EVSE system in Trinidad and Tobago with a 50% subsidy.
| EVSE Type | Cost |
|---|---|
| Level One | $1,692 |
| Level Two | $2,290 |
| Level Three | $63,296 |
Table 16a: Minimum cost of EVSE in TT dollars.
| EVSE Type | Cost |
|---|---|
| Level One | $7,998 |
| Level Two | $34,344 |
| Level Three | $220,940 |
Table 16b: Maximum cost of EVSE in TT dollars.
Maintenance and service
The maintenance and servicing of an automobile is critical to the life of the vehicle. However, unlike a gasoline/diesel vehicle, the electric vehicle comprises of an electric motor and battery pack. This motor is unlike any automobile engine, which therefore means the servicing and maintaining of the electric vehicle would differ from that of the gasoline/diesel car.
In the United States of America, Institutions offer training in the field of servicing and maintaining EVs [16]. The Electric Vehicle Centre of America offers the Certified Electric Vehicle Technician (CEVT) certificate program for the repair and maintenance of the electric vehicle. Another institution, The National Alternative Fuels Training Consortium (NAFTC) also provides a similar program on electric vehicles, which covers a basic understanding of electric vehicles, troubleshooting, electric drive vehicle infrastructure training and electric drive vehicle automotive technician training (National Alternative Fuels Training Consortium). In addition to this, the US Department of Energy developed an EV Infrastructure Training Program, which educates and accredits electricians on the installation of an EV Infrastructure [9].
In other countries, programmes have been developed to determine whether a technician meets the standard for servicing an electric vehicle. In the United Kingdom, the Automotive Technician Accreditation (ATA) for electric vehicles was established to ensure the technicians possess the skills required to service and maintain the electric vehicle.
The ATA offers training to technicians on the servicing of an EV as shown in Figure 18. However, their key purpose is to evaluate the technician skills and abilities to determine if their knowledge and abilities meet a professional standard [19].
In Trinidad and Tobago, there currently exists no courses on the servicing and maintaining of an electric vehicle. The lack of EVs present in the country has not encouraged technicians to study a programme based on EV servicing and hence there are only a few persons qualified to repair/service an electric vehicle. In order to successfully promote EV growth, there must be courses developed to educate and train technicians to successfully diagnose and restore an electric vehicle to optimal working condition.
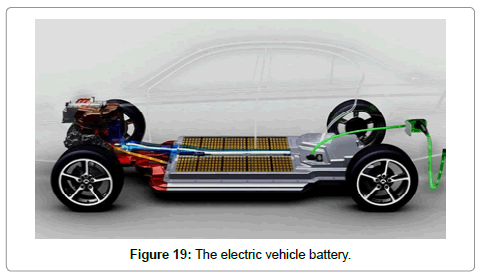
The electric vehicle comprises of a high-voltage energy block which demands compatible equipment that utilizes distinctive software to diagnose it [16]. The battery in an electric vehicle lasts for approximately eight (8) years after which they need to be replaced. Proper training must also be taught to technicians for the safe removal of these batteries since the battery in electric vehicle is located under the vehicle, unlike the traditional automobile as shown in Figure 19. Conventional automobiles place heavy demand on mechanical vehicle parts, which require maintenance to keep the parts working in optimal state. However, EVs have high demands on electrical power systems.
Therefore, technicians must be trained to facilitate these demands from the EVs. Courses similar to the Certified Electric Vehicle Technician certificate program as offered in different states in America can greatly impact the knowledge of an EV onto technicians in Trinidad and Tobago. In addition to this, programmes such as the one in the United Kingdom will allow for validating the skills and abilities of the technicians before certifying them as technicians that can successfully maintain and repair an EV.
<
Conclusion
The aim of this study was to determine the main factors affecting electric vehicle adoption in Trinidad and Tobago. This was done by utilizing the SPSS software for statistical analysis where Crosstabulations were executed to determine traits affecting electric vehicle adoption and Principal Component Analysis was conducted to determine the main factors affecting EV adoption. The analysis conducted displayed that no human factors such as age and gender influences the purchase decisions of an electric vehicle. The main factors determined from the principal component analysis included Support Systems, Costs associated with the electric vehicle and Safety.
Support systems includes the charging infrastructure of the EV, Government Incentives and the provision of proper maintenance and servicing systems. Currently there exists no charging infrastructure for the EV which is one of the major reasons of little adoption of the EV today. The government has provided incentives which reduce the total cost of the electric vehicle however this would not be fully utilized until charging infrastructures are developed throughout Trinidad and Tobago. The incentives offered by the government include the removal of taxes on the vehicles which significantly reduces the total cost of the vehicle. However, no concern was placed on the cost of the EVSE systems. These systems are quite expensive and therefore should be evaluated so as to provide incentives to reduce its cost. There is currently a lack of technicians available to service and maintain the EVs. Programmes must be developed to educate technicians on the proper procedures and equipment to use when conducting service and repairs on these vehicles.
From the Principal Component Analysis, high costs act as another factor which affects EV adoption. It must be noted that during the data collection phase of this project, automobile car dealers pointed out that high costs remain as a factor to EV adoption since people are unaware of the existence of the incentives imposed on EVs. This was tested on the questionnaire where the results revealed high costs as a factor affecting electric vehicle adoption. The employment of incentives can only be considered effective when the population of Trinidad and Tobago is aware of its presence. From the cost-analysis done, the results showed that electric vehicles are cheaper than conventional vehicles and also cheaper to maintain. The main problem is not associated with the cost of the vehicle but rather the population not being aware of its presence. Therefore, advertisements or other techniques should be implemented to ensure that more people become aware of its availability.
Safety was determined as another factor of EV adoption. It was concluded that Type Approvals are essential in validating the electrical systems in an EV, by comparing it to certain specifications before licensing the vehicles. This procedure should be employed in Trinidad and Tobago to ensure the vehicle is electrically sound for use on the roadways.
The renewable energy that was determined as most feasible to power the electric vehicle was Solar Energy. This form of energy can be utilized in Trinidad and Tobago due to the natural weather conditions that comprises of mostly sunny days. This is a great form of renewable energy due to the wide availability of energy from the sun and with the proper incentives and programs in place, can become a great source of powering EVs.
References
- Adeyanju AA, Manohar K (2017) Biodiesel production and exhaust emission analysis for environmental pollution control in Nigeria. Am J Engg Res 6: 80-94.
- Motavalli J (2010) The electric car revolution will soon take to the streets. Yale School of Forestry and Environmental Studies Publisher, NewYork.
- https://www.afdc.energy.gov/uploads/publication/evse_cost_report_2015.pdf
- National Research Council of the National Academies (2015) Overcoming barriers to deployment of plug-in electric vehicles. The National Academies Press.
- Tsang F, Pedersen J, Wooding S, Potoglou D (2012) Bringing the electric vehicle to the mass market-a review of barriers, facilitators and policy interventions (WR-775) (Working Paper). RAND Europe’s Direct Investment Programme.
- Heidrich O, Hill GA, Neaimeh M, Huebner Y, Blythe PT, et al. (2017) How do cities support electric vehicles and what difference does it make?. Tech Forecast Soc Change 123: 17-23.
- Kolhe ML, Madusha TC (2017) The scenario of electric vehicles in Norway. In electric vehicles: prospects and challenges. pp: 317-339.
- http://naftc.wvu.edu/?s=electric+vehicles&sitessearch=http%3A%2F%2Fnaftc.wvu.edu%2F
- She ZY, Sun Q, Ma JJ, Xie BC (2017) What are the barriers to widespread adoption of battery electric vehicles? A survey of public perception in Tianjin, China. Transport Pol 56: 29-40.
- Larminie J, John D (2003) Electric vehicle technology explained. John Wiley and Sons Ltd, USA.
- Natkunarajah N, Scharf M, Scharf P (2015) Scenarios for the return of lithium-ion batteries out of electric cars for recycling. Procedia CIRP 29: 740-745.
- Bartlett MS (1950) Tests of significance in factor analysis. British J Psych 3: 77-85.
- Cattell RB (1966) The screen test for the number of factors. Multivariate Behav Res 1: 245-276.
- Hong Kong Privy Council (2014) An Industry Study on Electric Vehicle Adoption in Hong Kong.
- https://www.curbed.com/2017/6/22/15855130/ubitricity-electric-car-charginglamp-posts
- https://www.finance.gov.tt/wp-content/uploads/2017/10/revisedBUDGET-STATEMENT-2018-BOOKLET-faw1.pdf
- https://martectraininguk.files.wordpress.com/2015/01/martec_hybrid_trifoldinside_proof.jpg
- Lebeau P, Macharis C, Van Mierlo J, Lebeau K (2013) Electric vehicles for logistics: a total cost of ownership analysis. Proceedings of the BIVEC-GIBET Transport Research Days 307-318.
- Emir F (2013) Selecting renewable energy sources for small islands using analytical hierarchy process (AHP).
Citation: Adeyanju AA, Manohar K, Ramnath A (2018) Statistical Analysis of Electric Vehicle Adoption in Trinidad and Tobago. Innov Ener Res 7: 216. DOI: 10.4172/2576-1463.1000216
Copyright: © 2018 Adeyanju AA, et al. This is an open-access article distributed under the terms of the Creative Commons Attribution License, which permits unrestricted use, distribution, and reproduction in any medium, provided the original author and source are credited.
Select your language of interest to view the total content in your interested language
Share This Article
Recommended Journals
Open Access Journals
Article Tools
Article Usage
- Total views: 7949
- [From(publication date): 0-2018 - Nov 14, 2025]
- Breakdown by view type
- HTML page views: 6791
- PDF downloads: 1158

