Research Article Open Access
Towards Energy Efficiency and Sustainability in Academic Institutions: The Case of the University of Swaziland (UNISWA), Mbabane Campus
Alfred Francis Murye1* and Musa Gcina Sibandze21University of Swaziland, Department of Environmental Health Science, PO Box 369, Mbabane, H100, Swaziland
2Matsapha Town Council, Environment and Public Health Department, PO Box 1790, Matsapha, M200, Swaziland
- *Corresponding Author:
- Alfred Francis Murye
PhD, University of Swaziland, Department of Environmental Health Science
PO Box 369, Mbabane, H100, Swaziland
Tel: +26876049394
E-mail: amurye@gmail.com
Received date: October 27, 2017; Accepted date: April 19, 2016; Published date: April 22, 2016
Citation: Murye FA, Sibandze MG (2017) Towards Energy Efficiency and Sustainability in Academic Institutions: The Case of the University of Swaziland (UNISWA), Mbabane Campus. Innov Ener Res S1:003. doi: 10.4172/2576-1463.S1-003
Copyright: © 2017 Murye AF . This is an open-access article distributed under the terms of the Creative Commons Attribution License, which permits unrestricted use, distribution and reproduction in any medium, provided the original author and source are credited.
Visit for more related articles at Innovative Energy & Research
Abstract
An exploratory study was carried out at the UNISWA, Mbabane campus to describe the use of energy at the campus. It followed both quantitative and qualitative approaches to data collection and analysis. The campus frequently experience power cuts and surges which interrupt work and studies. Although there is a standby generator on the campus, the situation remains dire as such generator only supply a few buildings on the campus and sometimes it does not automatically turn on. The study was intended to assist UNISWA in identifying energy efficient appliances and practices in order to cut down its electricity consumption and save money. A purposive convenience stratified random sampling was used to draw a sample of 47 participants to the study from a total population of 600 (academic and non-academic staff, students and grounds men and women). This allowed a 10% margin of error and 85% confidence level and a 40% response distribution. Questionnaires and an observation checklist were used to collect data. A Watt-hour meter was used to measure the ratings of the appliances. The study found that 65% of the energy appliances used are not efficient and only 35% of the appliances are efficient. The campus is not also using energy efficiency practices as some of the respondents left electric appliances such as fans and heaters running when they leave offices (41.7%) and (16.7% respectively. If this continues unabated, the campus will continue spending on wasted energy at a substantial cost of E315 656.37 per annum. In conclusion, the UNISWA Mbabane campus is not using its energy efficiently. The study recommends that UNISWA needs to improve its energy use by reverting to energy efficient appliances and practices in order to reduce cost to the institution. It should also put in place an energy use monitoring system that can quickly identify pit holes in energy use and also conduct a full study on energy efficiency for all its campuses in order to achieve a sustainable energy future for the institution.
Keywords
Energy; Sustainability; Efficiency; Electricity; Appliances; UNISWA; Mbabane
Introduction
Energy efficiency as an important energy resource management tool
The famous Australian biophysicist Alfred Lotka proposed in the 1920s that the evolution of ecosystems is shaped by how efficiently various species of life appropriate the energy in the environment. Energy efficiency is the measure of how much useful work is accomplished by a particular input of energy into a system. The useful work could be the utilization of the amount of energy for heating, cooling equipment and lighting that is required to maintain comfortable conditions in a building [1-5].
The general increase in the quality of life of individuals has been possible because of substantial increase in the amount of energy they consume. However, the growth in the consumption of energy is always accompanied by a number of environmental challenges such as air pollution, oil spills, resource depletion, acid rain and global warming. In fact, the processes of energy production from-its mining, refining, transportation, consumption and polluting by-products, accounts for much of the human impacts on the environment [1,3]. Therefore, energy efficiency offers a powerful and cost-effective tool for achieving a sustainable energy future for humanity as people are unarguably embedded in a system of energy production and consumption [1,2]. Improvements in energy efficiency can reduce the need for investment in energy infrastructure, cut fuel costs, increase competitiveness and improve consumer welfare [5]. At the same time, environmental benefits can be achieved through the reduction of greenhouse gases emissions, land degradation due to mining and waste disposal, water pollution and air pollution. Improved energy efficiency can also profit and guarantee an energy secure future for all by decreasing the reliance on imported fossil fuels [6]. Improving energy efficiency can make a real difference as it saves money, reduces carbon emissions and decreases a country's dependence on foreign energy supplies [7].
Energy efficiency measures such as replacing incandescent bulbs with compact fluorescents and upgrading to high efficiency appliances can reduce monthly energy bills up to 30% [8]. The International Energy Agency is committed to promoting the “Three E’s” of balanced energy policy making – energy security, economic development and environmental protection and, provides a list of short actions that can be adopted to save energy [6]. These are: purchase energy-efficient products and operate them efficiently, incorporate more day lighting into homes using energy-efficient windows and skylights, purchase energy-efficient electric systems and operate them efficiently, incorporate passive solar design concepts into house designs, which include using energy efficient windows. Properly insulate and air seal buildings. Select an energy-efficient heating system that doesn't use electricity and purchase an energy-efficient electric water heater and operate it efficiently [1,6,3] or select an energy-efficient water heater that doesn't use electricity.
Energy efficiency in buildings
By buildings, this paper refers to residential, commercial, institutional and public structures. Opportunities to minimize energy requirements through energy efficiency and passive renewable energy in buildings encompass building design, building materials, heating, cooling, lighting and appliances [5]. Commercial buildings include, but not limited to, a wide variety of building types such as offices, hospitals, schools,
Police stations, places of worship, warehouses, hotels, libraries and shopping malls [4] are different commercial activities and all have unique energy needs but, as a whole, commercial buildings use more than half their energy for heating and lighting [9]. In commercial buildings the most common fuel types used are electricity and natural gas [10].
Occasionally commercial buildings also utilize another source of energy in the form of locally generated group or district energy in the form of heat and/or power [5]. This is most applicable in situations where many buildings are located close to each other such as in big cities and university campuses, where it is more efficient to have a centralized heating and cooling system which distributes energy in the form of steam, hot or chilled water to a number of buildings [4,11].
Energy efficiency standards for appliances
Standards are set for minimum energy efficiency of products either at the manufacturing, sale, or installation stage. When buying any electric or energy consuming appliance one needs to ask the following two questions: Does the appliance save energy? Is it energy efficient? Worldwide, there are different energy standard ratings or labels. For instance, some countries have their own country standards and some countries follow the standards set out by other countries. Swaziland for example utilizes standards set by the USA. The USA uses the Energy Star standard for appliance efficiency which stipulates the following:
• Saving energy – Increased efficiency reduces overall power use as well as the need to build more large power plants.
• Saving money – More efficient appliances and equipment mean lower energy cost and a reduced overall demand which helps lower power rates for every appliance
• Creating jobs – Businesses add jobs to meet increased demand for energy efficiency. Consumers spend savings from lower utility bills on other beneficial things thus bolstering the economy.
• Fighting global warming – Improved efficfiency reduces carbon emissions.
• Protection of public health – Air pollution is a by-product of most power plants, which cause public health problems such as asthma.
Saving electricity in building
To save electricity in buildings, [12,13,5] give some tips on how to save electricity in commercial buildings. These are:
• Use natural lighting where possible (e.g., windows, skylights) and where it's not possible, use fluorescent lighting.
• Use ceiling fans where practical so you can raise the AC temperature.
• Turn off anything that's not being used.
• Turn off computers and other equipment at night if no shifts are running. If employees can't be counted on to turn off equipment, put them on timers. This will save not only on the equipment that's turned off, but AC costs will go down because you won't be paying to remove the heat generated by the unused equipment.
• Don't cool the building too much at night when no shifts are running.
Estimating appliance electronic energy use
According to Harper [1], energy is a physical variable that can be measured variously as Calories, KiloWatt-Hours, Horsepower, British Thermal Units, Joules, etc. Almost every device one can plug into the wall has a label or engraving that tells how much energy it uses [8]. If one is trying to decide whether to invest in a more energy-efficient appliance, one may want to estimate the appliance’s energy consumption. The Swaziland Electricity Corporation (SEC) uses the below conventional formula for determining the cost of electricity supplied to a client. (Wattage × Hours Used per Day) ÷ 1000=Daily KiloWatt-hours (kWh) consumption (1 KiloWatt (kW)=1000 Watts). Therefore, the best way to compare the cost of running different appliances is to look at their power consumption, which is a measure of how much power they use in Watts. Table 1 below presents the typical values for the Wattage of some devices one would find at home or academic institutions of higher learning [14-16].
| Device | Rating | Efficiency standard |
|---|---|---|
| Toaster | 800-1500 W | Energy star |
| Microwave | 600-1500 W | Energy star |
| Dishwasher | 1200-1500 W | Energy star |
| Washing machine | 500 W | Energy star |
| Vacuum cleaner | 200-700 W | Energy star |
| Iron | 1000 W | Energy star |
| Electric mower | 1500 W | Energy star |
| Clothes dryer | 4000 W | Energy star |
| Ceiling fan | 10-50 W | Energy star |
| Table fan | 10-25 W | Energy star |
| Hair blow dryer | 1000 W | Energy star |
| Electric shaver | 15 W | Energy star |
| Laptop computer | 20-50 W | Energy star |
| Laptop computer | 80-150 W | Energy star |
| TV (19" colour) | 70 W | Energy star |
| Fridge/Freezer | 500 W | Energy star |
| 25" colour TV : | 150 W | Energy star |
| Electric kettle | 2000 W | Energy star |
| Power shower | 240 W | Energy star |
Table 1: Different Wattage values for some electric appliances.
Energy in Swaziland
Swaziland relies mainly on imported electricity as the Swaziland Electricity Corporation (SEC) produces only about 10% of its electricity domestically. The country imports 80% of its electricity from ESKOM in South Africa and 10% from Electricidade de Mozambique (Swaziland Energy Regulatory Authority [13,14]. Swaziland was selfsufficient in electricity generation until 1973 when it began to experience a short fall due to the growing demand; hence the first 132 kV ESKOM line was built. Thereafter two ESKOM feeders were built as a result of increasing demand. The diminishing power capacities in the Southern African region will dramatically increase electricity prices in Swaziland which will impact negatively on the country’s economy.
According to Ministry of Natural Resources and Energy [17], for the past 30 yrs or so, Swaziland has been importing power from the SADC region. This was due to the low tariffs as a result of excess generation capacity that was available in South Africa. However, due to increased demand for electricity that has resulted in load shedding in that country, the demand and cost of electricity in Swaziland has also sky rocketed due to increased cost for importation. Consequently, the MNRE together with SEC has embarked on a feasibility study aimed at developing a sizeable thermal power station in the country for own use and for export purposes. The MNRE together with SEC have also embarked on the demand side management program, which seeks to encourage efficient ways of utilizing electricity efficiently such as the use of energy efficient bulbs and the use of solar water heaters. Swaziland’s reliance on South Africa for its energy supply may soon come to an end as government has given the SEC the go ahead to establish a 300 MegaWatt thermal power plant to meet the country’s demand, which currently stands at approximately 200 Megawatts.
Electricity tariffs in Swaziland
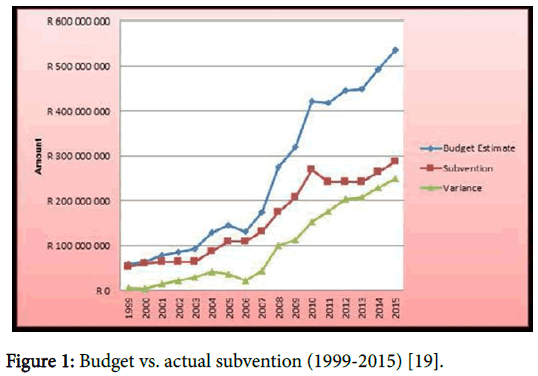
The current price of electricity is set to increase by 15% in April 2017 following an impending rise in tariffs from Swaziland’s main source, South Africa’s ESKOM. Accordingly this would translate to consumers getting only 69 units per E100 (Swazi currency Emalangeni). Since Swaziland sources the bulk of its electricity from South Africa’s ESKOM, the proposed tariff hike would affect the country’s electricity prices. This hike would adversely affect the electricity consumers-including UNISWA which is already hard hit by the global economic meltdown which started in 2008, the cut in the Southern African Customs Union (SACU) revenue to Swaziland as of 2011 and the declining Government subvention fund which is meant to contribute up to 60% (Figure 1) of the university’s annual budget [18,19].
Figure 1: Budget vs. actual subvention (1999-2015) [19].
The UNISWA Mbabane Campus, like the other campuses do experience frequent power cuts due to load shedding. In an effort to remedy the situation, a stand-by generator was bought and installed to cater for instances of power cuts. However this has not completely solved the problem since the generator supplies only a portion of the campus and the other buildings remain without electricity. In addition, the generator uses fuel which is an extra cost to UNISWA and is also a source of environmental E is the Swazi currency Emalangeni pollution. These problems require a concerted energy efficiency practice among the stakeholders.
The main purpose of this paper was to solicit strategies that would help alleviate energy cost by UNISWA through energy efficiency practices. The specific objectives were to identify and classify all energy appliances used at the Mbabane campus; establish the energy use practices on the Mbabane campus; determine the cost of electricity consumption incurred by UNISWA at the Mbabane campus; and recommend strategies for reducing energy consumption to reduce cost of electricity due to UNISWA.
Methodology
This study was exploratory and descriptive in design and followed both quantitative and qualitative approaches. The study was conducted at the UNISWA Mbabane Campus which comprises of three student dormitory blocks, a kitchen and dining hall, library, lecture rooms and the administration building. The study targeted all the electricity appliances in the campus and all the users of electricity on the campus. A simple purposive convenience stratified random sampling was used to draw the human participants to the study. All the electricity appliances in use on the campus were included in the study. Table 2 shows the sample size.
| Type of entity | Population | Sample | Percentage |
|---|---|---|---|
| On-campus students | 235 | 24 | 10.20% |
| UNISWA staff | 28 | 16 | 57.10% |
| Kitchen staff | 18 | 7 | 38.90% |
| Total | 281 | 47 | 16.70% |
Table 2: The sample size.
A Raosoft sample size calculator was used to draw a sample of 47 participants from a total population of 600 target population comprising academic and non-academic staff (Academic and nonacademic staff comprised of teaching, administrative, secretaries and store men), students and grounds men and women. This gave a 10% margin of error, 85% confidence level and 40% response distribution [20]. Each group of participants made up a strata and a study sample was selected in each strata. The data was collected using face to face interview schedules and a Watt-hour meter was used to measure the ratings of the different electric appliances. Experts from SEC and MNRE were used to review the data collection tools and attest to their content reliability and validity.
The collected data were checked daily by the researchers for any discrepancies so as to address them immediately. The instruments were pre-tested at the Luyengo campus so as to detect possible flaws. The data was checked to ensure completeness and accuracy. The researchers identified a clear procedure to handle and store them in a safe place where it was only accessed by the researchers. The quantitative data was subjected to narrative and statistical analysis using a computer software Statistical Package for Social Sciences (SPSS) version 20.0 [20]. The data was presented in form of pictograms, frequencies, percentages and figures. Permission to carry out the study was sought from the relevant authorities. And the confidentiality and anonymity of the respondents was maintained.
Results and Discussion
Identification and classification of all energy appliances
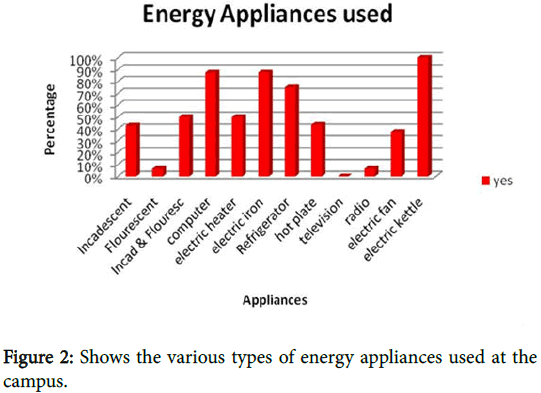
The researchers divided the respondents into three strata; students, academic and non-academic staff and kitchen staff. Figure 2 shows the different types of energy appliances used at the Mbabane campus. The researchers classified these appliances into energy efficient or nonenergy efficient. The data found that, electric kettles (98%) were the most available and commonly used appliances on the campus. Computers (87.5%), electric irons (87.5%) and refrigerators (75%) were also used.
The researchers found no television being used in both the dormitories and offices except one television screen that was in the lecture hall and used only when there is a documentary or any other video to be shown to students during lectures. However, it was reported that it is rarely used. Radio systems (6.3%) and fluorescent lamps (6.3%) were also found to be in use. Due to the shifts between winter and summer, electric heaters (50%) were also found to be in use, especially in cold days. Much as it is illegal to cook in the Dormitories hot plates were also found to be in use by 43.8% of the students. The researchers also observed usage of incandescent lamps (43.8%) despite their inefficiency. It was surprising to find that fluorescent lamps comprised only 6.3%.
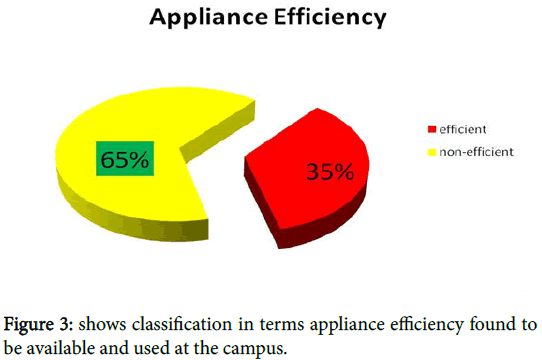
Figure 3 gives a general classification of all the appliances found at the Mbabane campus. The researchers found that 35% of the energy appliances were energy efficient and 65% of them are non-energy efficient. The implication of this is that, the campus is
Consuming more electricity than it would if it were to revert to using energy efficient appliances. This claim is supported by Harper and also Miller who put it clearly that using energy efficient appliance saves money for the consumer. This means that the non-efficiency of the appliances is impacting adversely on the cost to the university as a result of unsustainable energy consumption.
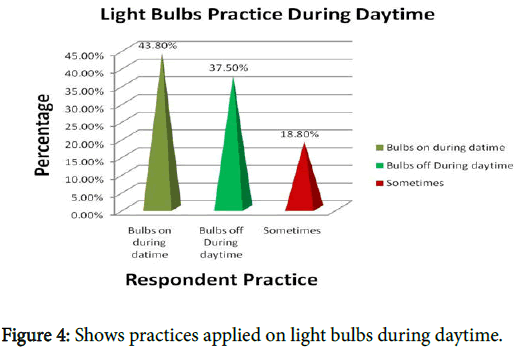
The respondent’s energy use practices were obtained from the way they used the different appliances. These were subdivided into, energy practice on light bulbs (both during daytime and night); practices on computer use; practice on electric heater use; practice on electric iron use; and practice on electric fan use (Figure 4). It transpired that, 43.8% of the respondent showed that they switched their light bulbs on during the day whilst 37.5% switched their lights off during daytime and 18.8% said sometimes they do switch off their lights during day time. The implication of this finding is that a lot of energy is being wasted during the day when the light bulbs are switched on. It is good practice to use natural lighting during the day as put forward by and also who claim that such a practice saves energy and reduces cost [5,12].
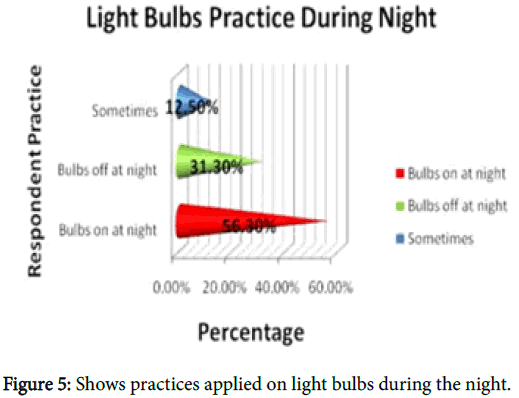
Further discussion with the respondents on the use of light bulbs during night time, Figure 5 revealed that, 56.3% of the respondent left the light bulbs on at night, 31.3% of the respondent said they switched off their light bulbs at night when they go to sleep and 12.5% of the respondents said they switch off their lights sometimes and sometimes they leave them on. It is a waste of energy when one switches on lights in rooms that are not occupied or being used. This definitely brings in unnecessary costs as supported by previous studies [3,21].
Figure 6 shows the diverse types of energy use practices on the different energy appliances. Figure 6 shows that 75% of the respondents switched off their computers when not in use, 25% disconnected their computers when not in use, 37.5% kept their heater on even if they are not in their rooms and 31.3% kept their fans running even if they are out their rooms. Again these are energy wasting practices that need to be changed if UNISWA is to achieve a sustainable energy future and reduce cost.
Practices amongst the academic, non-academic and kitchen staff on the use of energy appliances
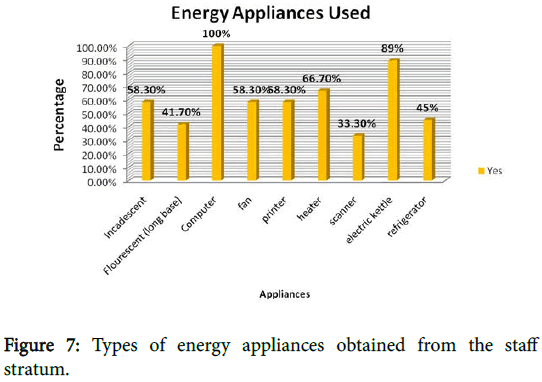
Figure 7 shows the different energy appliances used by staff at the Mbabane campus. It shows that, the most widely used energy appliance is the computer (100%), followed by the electric kettle (89%). Incadescent lighting is also widely used in the offices (58.3%) compared to the flourescent lighting (41.7%). According to Miller [3], flourescent light bulbs are 80% more efficient as compared to the incadescent light bulbs which uses 20% of the energy for producing light and 80% of the energy is wasted as heat.
Figure 8 shows how the respondents used energy during the working days. It shows that, 75% of the respondents live their lights on during the daytime and 20% indicated that their lights remain off during the day. This is an indication of bad energy use practice as the staff mainly relied on electricity other than natural lighting [12,21,3,5]. However, 5% of the respondents showed that they switch on their lights occasionally – a practice that was reported to be influenced by the daily weather conditions. If it is cold and cloudy, they switch on the lights as the visibility in such conditions is poor.
Observations in the offices revealed that respondents who had refrigerators in their offices kept them running day and night. All offices checked during the study did not disconnect their computers, printers and scanners from the sockets. Every electric appliance that is connected to the socket will continue using some amount of energy which is wasted as heat even if they are switched off.
Practices amongst the kitchen (refectory) staff on the use of energy appliances
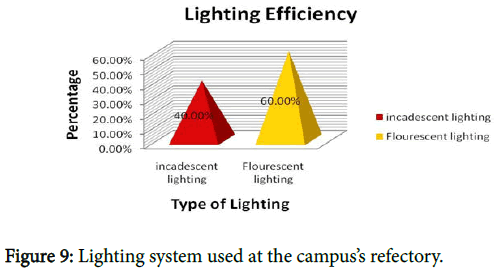
Data obtained from the kitchen showed that the main types of lighting appliance used are the fluorescent bulb (60%) and the incandescent bulbs (40%) (Figure 9).
The data under the kitchen strata comprised of light bulbs in the whole building. Other types of the energy appliances that are in use include a cold room, refrigerators, microwaves electric pots, electric kettles and deep freezers.
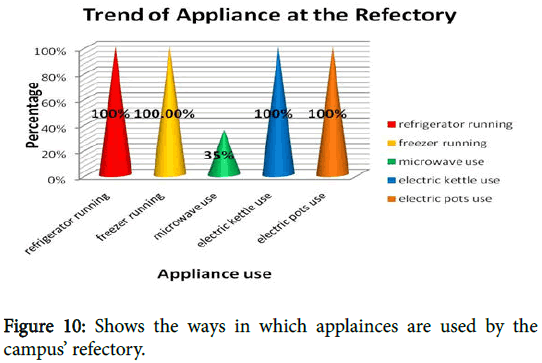
The researchers investigated practices of using the appliances and the findings are presented in Figure 10. Figure 10 shows that most of the appliances (refrigerators, freezers, electric kettles and electric pots) are used full time at 100% usage. The researchers also investigated the practices of using light in the kitchen. It was explained to the researchers that, the kitchen lights are always kept light as a matter of regulation.
Determining the cost to UNISWA emanating from energy consumption at the Mbabane campus
The cost of electricity depends on where one lives, how much one uses and how one uses it. SEC the electric supplier measures how much KiloWatt-hours (KWh) of electricity one uses. This can be calculated using the formula, (Wattage × Hours Used per Day) ÷ 1000=Daily KiloWatt-hour (KWh) consumption.
(1 KiloWatt (kW)=1000 Watts)
SEC charges electricity in Emalangeni (E) per the amount of KWh used. As of the 2016/2017 tariffs, institutions of higher learning such as UNISWA were charged at a rate of E1.7402 cents per KWh. For all the appliances used, the following calculations were made per type of appliances per annum.
Incandescent bulbs switched on 24hours a day for the whole year
From the formula (Wattage × Hours Used per Day) ÷ 1000=Daily KiloWatt-hour (KWh) (1 kiloWatt (KW)=1000 Watts). All the incandescent bulbs had a rating of 100Watts each. Therefore one single incandescent light bulb consumes (100 Watts × 24 hours/day × 365 days/yr) ÷ 1000=876 KWh × E1.7402 cents/KWh=E1524.42/yr.
Fluorescent bulbs switched on 24 hours a day for the whole year
The fluorescent light bulbs used at the campus are the 11 Watts type. Therefore, each fluorescent light bulb consumes (11 Watts × 24 hours/day × 365 days/yr) ÷ 1000=96.36 KWh × E1.7402 cents/ KWh=E167.69/yr. However, the researchers noted that the campus mainly use the incandescent light bulbs as compared to the fluorescent light bulbs-a very inefficient lighting system which is costing the campus an extra E1524.42-E167.69=E1356.73/bulb/yr.
Incandescent lamps switched on for 8 hours (Assuming that UNISWA staff and students are at work or class and or study for eight hours a day) a day for the whole year
(100 Watts × 8 hours/day × 365 days/yr) ÷ 1000=292KWh × E1.7402 cents/KWh=E508.14/yr for a single bulb. Of those interviewed, under the student stratum, 75% of the respondents use incandescent light bulbs which make up to 15 respondents of the 20 that were interviewed. Each room consisted of 3 light bulbs; hence, the students’ hostels had a total of 45 incandescent bulbs. This resulted to a cost of E508.14/yr × 45 incandescent bulbs=E22866.23/yr for the students who switched on their incandescent light bulbs for 8 hours a day.
Cost that would accrue to the campus if it were to use fluorescent light bulbs and switch them on for 8 hours a day for one year
The cost for one bulb would be (11 Watts × 8 hours/day × 365 days/yr) ÷ 1000=32.12 KWh × E1.7402=E55.90/yr. For the 45 bulbs, it would cost the campus (E55.90 × 45 fluorescent bulbs)=E2515.29/yr. This means the campus is consuming an extra E20350.94/yr on using the inefficient incandescent light bulbs which are switched on for eight hours per day which would have been saved if it were to resort to using fluorescent light bulbs and practice energy efficient use practices. This would give UNISWA an 89% saving for lighting at the Mbabane campus.
Costs emanating from UNISWA staff stratum
The researchers observed that 9 out of the 16 respondents that were interviewed used the incandescent light bulbs and 7 used the fluorescent light bulbs. These would result to the following costs:
Light bulbs switched-on for 8 hours/day
(100 Watts × 8 hours/day × 365 days) ÷ 1000=292 KWh × E1.7402=E508.14/bulb/yr. This results in an annual cost of E4573.25/yr for the 9 bulbs from the 9 respondents. If the 9 respondents were to switch to using fluorescent light bulbs for 8 hours/day, the cost would be (11 Watts × 8 hours/day × 365 days) ÷ 1000=32.12 KWh × E1.7402 cents/yr=E55.70/bulb/yr. This would result to an annual cost of E503.06 cents for the 9 respondents and E389.90 for the 7 respondents who use incandescent and florescent light bulbs respectively. Therefore, if the 9 respondents would use fluorescent bulbs, the campus would save an extra E4070.20 from them per annum – a saving of 89%. This would definitely make a substantial amount of saving if the whole campus population was to be taken into consideration.
Costs emanating from kitchen stratum
The researchers observed that the kitchen employees leave the lights on for 24 hours. Four incandescent light bulbs were found in use in the kitchen and toilets. These contributed a cost of (100 × 24 × 365)/1000 × 1.7402=E1524.42 per bulb per yr. This makes an annual total of E6097.66 for the four bulbs. If the 4 incandescent light bulbs were to be replaced by the fluorescent light bulbs, they would cost the campus (55.70/yr × 4 fluorescents lamps)=E222.80/yr. Therefore, the campus would save E6097.66-E222.80=E5874.86/yr-an 89% cost saving. The use of the 5 electric pots having a 4000 Wattage rating each for a period of 14 hours a day (as reported by the respondents) is costing the campus (4000 Watts × 14 hours/day × 365 days) ÷ 1000=20440 KWh × E1.7402 cents/KWh=E35569.69/yr/electric pot. For the 4 pots, the campus would pay 35569.69 × 4=E142278.75/yr. According to the United States Energy Information Administration [22], there are energy efficient electric pots that have 2500 Watts that can perform the same task as the electric pots having 4000 Watts. Therefore, if the campus would switch to the energy efficient 2500 Watts pots, it would be paying (2500 Watts × 14 hours/day × 365 days) ÷ 1000=12775 KWh × E1.7402 cents/KWh=E22231.06/yr for each electric pot. For the 4 pots, the campus would pay only (E22231.06 × 4 pots)=E88924.22/yr. This would be a mega saving of E142278.75-88924.22=E53354.53/yr from cooking alone.
Costs emanating from computer use
Thirty six of the respondents indicated that they leave their computers on for 24 hours daily. Each personal computer (PC) has a rating of 200 Watts and each monitor has a rating of 118 Watts. These would cost the campus (200 Watts+118 Watts × 24 hours/day × 365 days) ÷ 1000=2785.65 KWh × E1.7402 cents/KWh=E4847.64/yr/ computer. Therefore the thirty six respondents who leave their
Computers on for 24 hours cost the campus E4847.64 × 36=E174515.05 per annum from their computers. If these respondents were to use their computers on an average eight hours a day, they would accrue a cost of only [(200 Watts+118 Watts) × 8 hours × 365 days]/1000=928.56 KWh × 1.7402=E1615.88 per annum per computer which translates to 36 × 1615.88=E58171.68 per annum. This would result to an annual saving of E174515.05-E58171.68=E116343.37 for the campus.
Conclusion
The researchers concluded that the UNISWA Mbabane campus is not using its energy efficiently and needs to improve it in order to minimize costs to the institution emanating from electricity use. There is a need to fully adopt energy efficiency measures by campus which will not only benefit UNISWA but also the environment. Implementing the energy efficiency technique will reduce the need for generating vast amounts of electricity whilst UNISWA enjoys the use of electricity at very minimum costs. This would translate into UNISWA saving funds that can be channelled to other projects of the university.
Recommendations
The researchers recommend that UNISWA adopt energy efficiency practices and technology as follows:
• It should replace all the incandescent light bulbs with the energy efficient fluorescent light bulbs.
• It should encourage staff and students to turn off equipment and lights when not in use and pull them off from the sockets.
• UNISWA should develop a strategic approach to energy management. This should include developing an energy policy, awareness campaigns on efficient energy use technologies and practices, energy use management (including identification of potential energy savings and investment opportunities) and monitoring and evaluation of progress towards an energy efficient future.
• UNISWA should purchase only energy efficient appliances.
• UNISWA should invest in a long-term commitment to promote energy efficiency in the university as a whole.
References
- Harper CL (2012) Environment and Society: Human Perspectives on Environmental Issues. 5th edn. Boston: Prentice Hall.
- OECD/IEA (2015) Energy Efficiency Market Report, Paris: International Energy Agency.
- Miller TG, Spoolman SE (2016) Living In the Environment. 18th edn. Stamford: National Geograpic Learning & Cengage Learning.
- Elsadig KE (2005) Energy efficiency in commercial buildings. University of Strathcylde, Scotland.
- UNDP, (2010) Promoting energy efficiency in buildings: Lessons learnt from international experiences, New York: United Nations Development Programme.
- International energy Agency (2010)
- Delaware Energy Office (2010)
- Aurora Energy (2007) Save energy and money.
- Anderson B (1977) Solar energy: Fundamentals in building design. McGraw-hill Higher Education, Boston.
- Johnson K (1992) Energy conservation in the built environment: Session 1-experiences with energy saving measures in existing buildings.
- McVeigh JC (1997) Sun Power: An introduction to the application of solar energy. Pergamon Press, Oxford.
- Bluejay M (2011) Saving electricity. USA, New York.
- Swaziland Energy Regulatory Authority (SERA) (2013). SERA’S Decision on the Swaziland Electricity Company (SEC) application for Tariff increase for the financial year.
- Renewable Energy and Energy Efficiency Partnership (2008) Renewable energy and energy efficiency portfolio standards
- www.energysavers.gov/yourhome/appliances
- www.energystar.gov/index.cfm
- Ministry of Natural Resources and Energy (2010) Electricity goes up 25%
- http://www.observer.org.sz/news/85918-electricity-goes-up-15.html
- Mhlanga SV, Dlamini MD, Sukati CWS, Zamberia AM, Murye AF, et al. (2016) UNISWA Strategic Plan 2016-2021. UNISWA, Kwaluseni.
- Microsoft, 2010. Microsoft SPSS version 10, Boston: Microsoft Office.
- Cunningham PW, Cunningham MA (2010) Environmental Science A Global Concern. 8th edn. McGraw-Hill International Editiion, Boston.
- US Energy Information Administration (USEIA) (2012). Annual Energy Review 2011
Relevant Topics
- Advanced Photovoiltoic Cells
- Advanced Photovoiltoic Panels
- Advanced Photovoiltoic Systems
- Advanced Photovoiltoic Technologies
- Alternative Energy
- Biomass Energy
- Coal Energy
- Energy Management
- Environmental Policy
- Green Energy
- Hydro Electric Energy
- Hydrogen Energy
- Hydropower Energy
- Photovoltoics
- Renewable Energy and Research
- Renewable Geothermal Energy
Recommended Journals
Article Tools
Article Usage
- Total views: 3208
- [From(publication date):
specialissue-2017 - Aug 15, 2025] - Breakdown by view type
- HTML page views : 2296
- PDF downloads : 912
