Research Article Open Access
Study of the Effect of Magnetic Microspheres on Some Biophysical Parameters of Human Blood (In vitro Study)
Abdelrahman T Hereba, Mohamed A Elblbesy* and Mamdouh M ShawkiBio-Medical Physics Department, Medical Research institute, Alexandria University, Egypt
- Corresponding Author:
- Mohamed A. Elblbesy
Bio-Medical Physics Department, Medical Research Institute
Alexandria University, Egypt
Tel: +2-0124380086
Fax: +2-03-4283719
E-mail: mimizizo@yahoo.com
Received date: December 14, 2011; Accepted date: April 12, 2012; Published date: April 14, 2012
Citation: Hereba AT, Elblbesy MA, Shawki MM (2012) Study of the Effect of Magnetic Microspheres on Some Biophysical Parameters of Human Blood (In vitro Study). J Biotechnol Biomater 2:135. doi:10.4172/2155-952X.1000135
Copyright: © 2012 Hereba AT, et al. This is an open-access article distributed under the terms of the Creative Commons Attribution License, which permits unrestricted use, distribution, and reproduction in any medium, provided the original author and source are credited.
Visit for more related articles at Journal of Biotechnology & Biomaterials
Abstract
Magnetic microspheres have many bio-medical applications, but they have contact with the blood before reaching to their target place in many cases, so the study of the effect of these microspheres on the blood can lead to optimization of the use of these microspheres. Five groups of normal blood samples were incubated with 10 mg magnetic chitosan microspheres for 1, 3, 6, 12, and 24 hours (h) respectively, then each group was compared to control group samples. The results showed that increase in hemoglobin conductivity with the time of incubation, no change in red blood cells osmotic fragility, no change in hemoglobin absorbance spectrum. Decrease in blood pH at 24 h, no change in neither hemoglobin electrophoretic patterns or in the blood components ultra structures. These results indicated no obvious toxicity of the magnetic microspheres on blood for incubation time up to 24 h, but on the other hand there are some changes especially at 24 h of incubation, so it is safer to avoid the remaining of the microspheres inside the body for more than 24 h.
Keywords
Magnetic microspheres; Blood; Chitosan
Introduction
Microsphere is a term used for small spherical particles, with diameters in the micrometer range (typically 1μm to 1000 μm (1mm)). Microspheres are sometimes referred to as micro particles [1].
Microspheres can be manufactured from various natural and synthetic materials. Glass microspheres, polymer microspheres and ceramic microspheres are commercially available. Chitosan is a hetero polysaccharide which is bio-compatible, bio-degradable polymer; many magnetic and non-magnetic microspheres can be made from it [2].
Magnetic microspheres offer many important applications in biology and medicine for many reasons; firstly they can be coated by many biological molecules to make them interact or bind to a biological entity [3]. Secondly they have magnetic character which means that they obey coulomb’s law and can be directed by an external magnetic field to any position inside the biological tissues, by this way microspheres coated with an anticancer drug or radioactive isotope can be directed through the body to the tumor area to destroy it without effect on the normal tissues [4]. Thirdly these microspheres can be used to transfer the energy from outside source into another source; for example they can transfer the thermal energy induced by external timevarying magnetic field to the tumor area which leads to destruction of the tumor tissues in hyperthermia treatment or at least as enhancement agent for chemotherapy that moderate degree of tissue heating give better results for tumor tissues destruction in combination of chemotherapy [5]. Many other bio-medical applications for magnetic microspheres can be available.
The magnetic component of the magnetic microspheres in general is magnetite, Fe3O4, a proven biocompatible iron oxide [6] which is FDA-approved and used clinically as MRI contrast agent [7]. Various procedures have been used to prepare magnetite particles, where the synthesis conditions are crucial in determining the final physicochemical properties in terms of particle size, shape, composition, and magnetic properties [8,9]. The most common synthesis of magnetite nanoparticles is based on Elmore’s co-precipitation of ferrous (Fe2+) and ferric (Fe3+) ions under basic conditions [10] and has been perfected by Massart [11].
Because the main use of the magnetic microspheres is inside the body, blood-biomaterials interactions should be studied which mean every interaction between an artificial thing and the blood, which determines the effects on the material by the blood and on the other hand the effect of this material on the blood, organs, or tissues. Such interactions are influenced by the flow conditions, the contact duration, the surface area, and the implant site [12]. This interaction should be studied specially some studies found chitosan microspheres can shorten the clotting time and induce the adhesion and activation of platelets. But the shortening of clotting time by chitosan microspheres may be related to not only platelet aggregation, but also erythrocyte aggregation [13].
In this present work, we evaluated the changes that may be induced by chitosan magnetic microspheres incubation with human blood In vitro at different time of incubations.
Materials and Methods
Preparation of magnetic microspheres [14] 1% weight/ weight (W/W) chitosan (SHIN ERA TECHNOLOGY CO., LTD, China) was dissolved in acetate buffer at pH 4.5 containing 2 mL of magnetic fluid [15] (35% weight/ volume (W/V)) ferrous sulfate solution mixed with 54% W/V ferric chloride solution, stirred and heated to 550C, then 36% W/V sodium hydroxide solution was added. The mixture was stirred for 30 minutes, and then 5 g of polyethylene glycol-10000 was added, the temperature was raised to 800C and maintained for 30 minutes, the mixture was then neutralized while cooling using 0.1 M HCl). The dissolved chitosan was added drop wise in 20 mL 0.1 M NaOH solution. The microspheres that formed were washed with deionozed water.
Chitosan microspheres were soaked in 1, 3 and 5% Glutaraldehyde solutions consequently for 2 hours, then washed with deionized water, the microspheres then dried in oven at 700C overnight.
Characterization of the prepared microspheres [16] the size, morphology and surface topography of the microspheres were examined using scanning electron microscope (SEM) (JEOL, JSM- 6360 LA Japan) after coating with gold (SPI-module TM sputter coater, Japan). The degree of magnetism of the microspheres was evaluated using vibrating sample magnetometer (VSM-9600-IDSM-LDG-USA).
Blood: One heparin zed blood sac from one donating person (500 mL) obtained from and analyzed by the blood bank, Medical Research Institute, Alexandria University, Egypt. Blood donation was completely voluntarily. The blood bank tested the blood sample against infectious viruses and confirmed that the blood is safe to work with as well as all its components are in the normal range.
To study the effect of the prepared microspheres on the blood, the blood sac was divided into six groups, each of 8 samples with equal volumes (10 mL).10 mg from the prepared magnetic microspheres was mixed with each sample in the first five groups, incubated in shaking water bath (OSB-1000A, made in Taiwan) stirred gently, and kept at 370C during all the experiments. The incubation times for these groups were 1, 3, 6, 12, 24 h respectively, while the last group served as control without mixing with microspheres. The microsphere concentration (10mg/10mL blood) was chosen depending on previous studies [17]. At the end of the incubation time of each group, the blood was filtered from the microspheres by decantation, and the blood was examined for the following parameters:
The conductivity of the hemoglobin for each sample was determined. 25 μL of whole blood completed to 2.5 mL with Drabkin’s reagent (Otsuka pharmaceutical company, Egypt) to ensure complete hemolysis, the mixture was centrifuged at 2000 rpm (220V, 50 Hz, 50 W, made in China) for 15 minutes to separate the hemoglobin supernatant from the cells’ remains. The conductivity of the hemoglobin for each sample was measured using LCR bridge [18] (FLUKE PM3603, Germany) at frequency range from 2.5 KHz to 1 MHz, the measuring cell consists of two platinum squares (1cm* 1cm) and the distance between each square is 1cm.
The absorbance intensity of the hemoglobin solution for each sample was measured using UV/visible spectrophotometer (JENWAY, 6305, USA) in wavelength range from 450- 700 nm [19].
The effect on RBCs membranes was measured by applying osmotic fragility test. Series of NaCl (Otsuka pharmaceutical company, Egypt) concentrations from 0 gm% to normal saline (0.9 gm%) was prepared. 25 μL whole blood was added to 2 mL of each NaCl concentration, left for 30 minutes in the dark, centrifuged at 2000 rpm for 15 minutes, the supernatant absorbance was measured at 450 nm [20].
The pH of each sample was measured using pH meter (HI 255 combined meter, pH/mV, and HANNA instrument, made in Romania).
A sample from each group was applied for cellulose acetate electrophoresis, after the peak formation, each peak was scanned to determine the concentration percent of hemoglobin A1 (HbA1) and hemoglobin A2 (HbA2) in the peak [21]. This experiment was performed in triplet.
The ultra structures of three samples from each group were examined under the transmission electron microscope (TEOL100CX TEM) for any abnormalities [22].
Statistical analysis: The data analysis was performed using the SPSS- 10 package (release 3, SPSS Inc., Chicago III) running on MCROVAX 3500. ANOVA test was used to compare between the means of the different parameters of the samples of the studied groups. A difference was considered significant at probability (p< 0.05).
Results
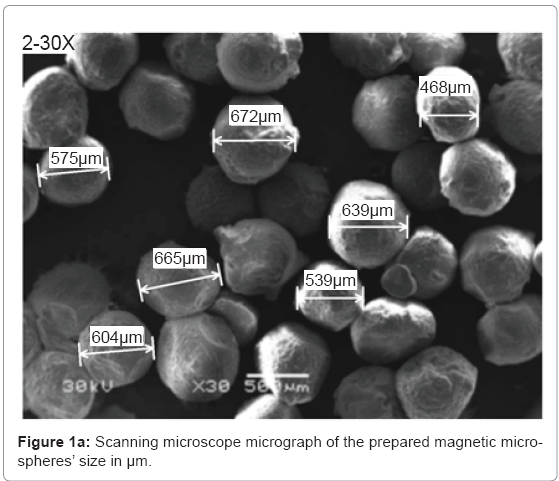
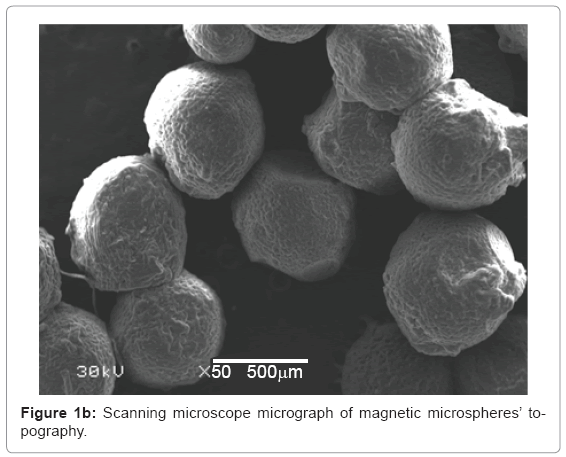
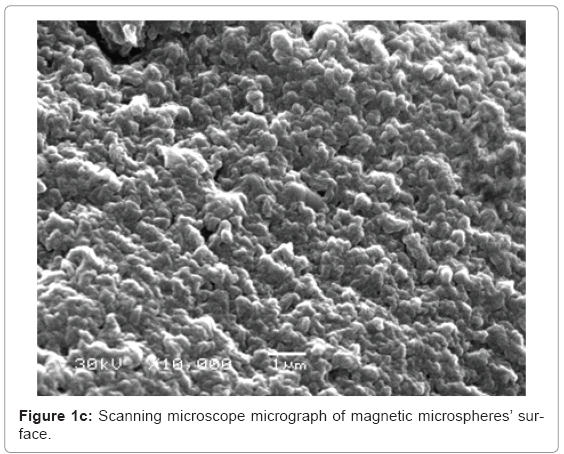
Characterization of the microspheres: Figure 1a-1c show the scanning electron microscope results about the size, morphology and surface topography of the prepared magnetic particles respectively. The formed microspheres are not hollow, and the size ranges from 400-675 μm (Figure 1a), with non uniform spherical surface (Figure 1b) and rough surface (Figure 1c) that the microspheres loss their shape upon drying and regain them upon swelling.
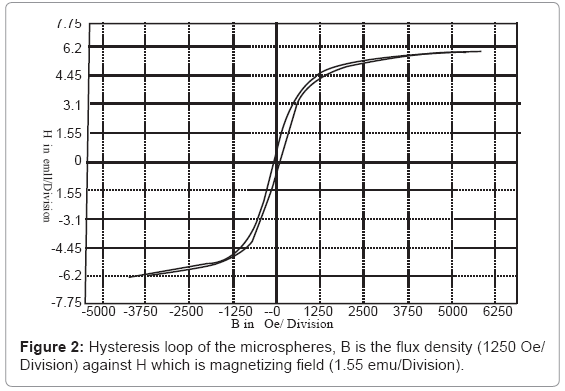
Figure 2 shows the hysteresis loop of the microspheres, in which the internal area of the hysteresis loop represents the capability of magnetic energy storage of magnetic materials. For the prepared microspheres, the saturation magnetization was 6.205 electromagnetic unit/gram/division (emu/g/division), coercivity was 76.05 Oersted (Oe), and retentivity was 1.099 emu/g. In which the maximum field was 5000 Oe.
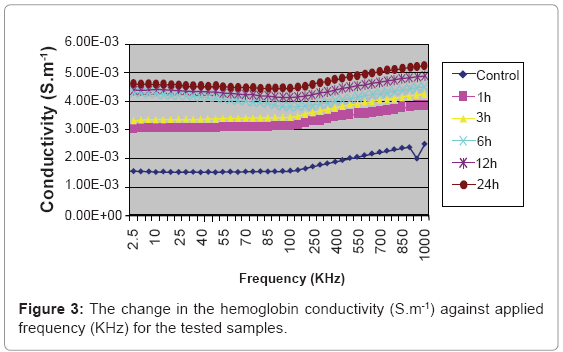
The result of the effect of the magnetic microspheres on the hemoglobin conductivity is shown in Figure 3.
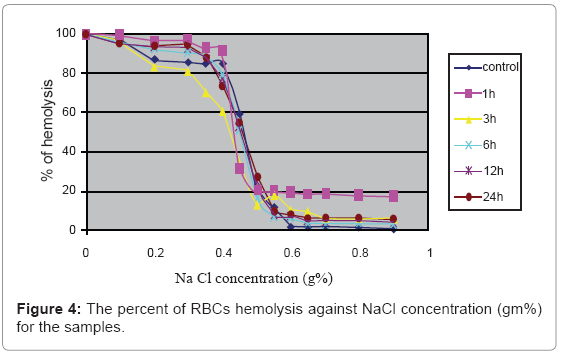
Figure 4 indicates that there is no significant effect of microspheres at all the incubation times on the osmotic fragility of RBCs.
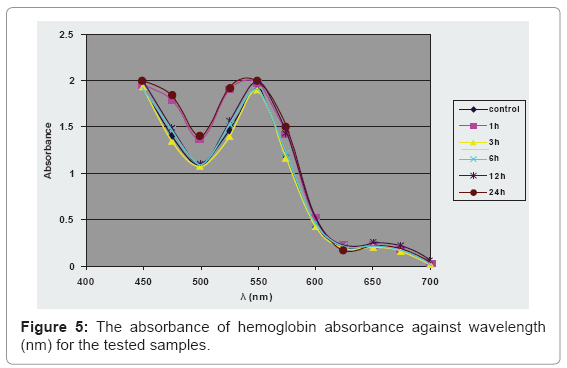
Determination of the absorbance at λmax of the hemoglobin spectrum is shown in Figure 5.
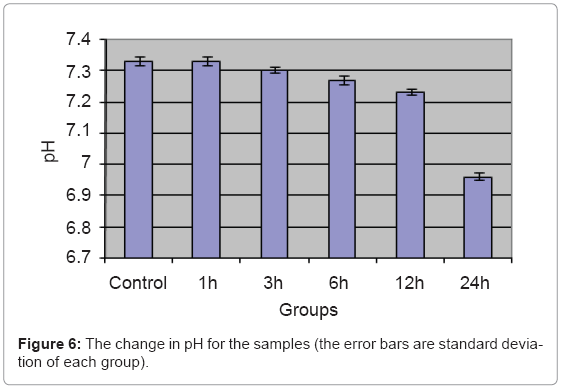
The change in the blood pH is shown in Figure 6.
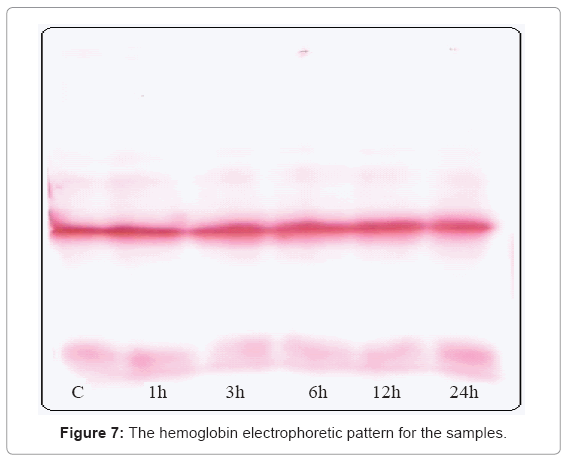
Figure 7 shows no difference in the hemoglobin electrophoretic pattern for all the tested groups, as well as Table 1 indicates no significant difference in the percent of HbA1 and HbA2 for all the tested groups compared to control.
| Group | % of HbA1 | % of HbA2 |
|---|---|---|
| Control | 96.24 +/- 1.27 | 3.76 +/- 1.27 |
| 1h | 96.07 +/- 1.02 | 3.93 +/- 1.02 |
| 3h | 97.87 +/- 1.59 | 2.13 +/- 1.59 |
| 6h | 98.06 +/- 2.00 | 1.94 +/- 2.00 |
| 12h | 97.30 +/- 1.4 | 2.70 +/- 1.40 |
| 24h | 95.16 +/- 1.3 | 4.84 +/- 1.3 |
Table 1: The percent of HbA1 and HbA2 for the samples (mean ± standard deviation at probability of error of 5%).
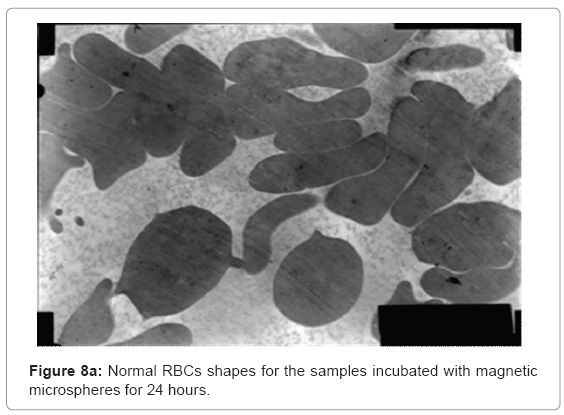
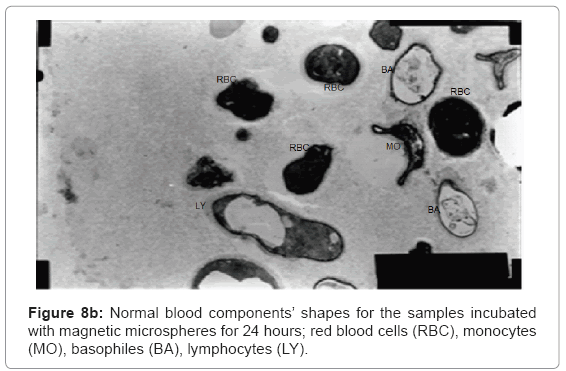
The ultra structures of the blood films for all the samples were investigated and shown in Figure 8a and 8b showing normal shapes of red blood cells and many of white blood cells components.
Discussion
A variety of synthetic or natural polymers have been employed as the controlled-release drug delivery system in humans; chitosan is a potentially useful pharmaceutical material owing to its good biocompatibility and low cytotoxicity [23]. Magnetic microspheres contain other materials as iron that may interact with blood in unexpected way this paper was performed to examine this hypothesis.
It was concluded from Figure 2 that the microspheres have high permittivity, low retentivity, low coercivity, low reluctance, and low residual magnetism. These magnetic characters for the microspheres are due to the relative big size of the formed microspheres [24], and that led to decrease in the magnetic interactions between the microspheres with the blood hemoglobin.
There is consecutive significant increase in hemoglobin conductivity with the time of incubation the microspheres with the blood as in Figure 3. The 24 h samples show the highest significant increase than the control samples compared with the other samples. The electrical conductivity is a measure for the material ability to conduct electricity, and that increase by increasing the free charge movement. The interaction of the small magnetic field delivered by the microspheres act to increase the kinetics of the hemoglobin side chains charges, which in turn increase the electrical conductivity with time of incubation, this phenomenon can’t be considered as a toxic effect, because if the magnetic microspheres are removed from the blood, the ions kinetics will retain its normal configurations after the electrical relaxation time [18].
The results indicated in Figure 4 shows no significant change in the RBCs’ osmotic fragility. Modification in the physical conditions of the proteins on the cell membrane may lead to change in the permeability of the RBCs membrane, which leads to increase in the osmotic fragility of RBCs, but the results indicate that this small magnetic energy dose delivered by the microspheres can’t interrupt the physico-chemical properties of the cell membrane or even affect the cell membrane by physical contact [25].
The study upon the effect on the hemoglobin spectrum indicates no significant change of the hemoglobin absorbance at 550 nm of the samples compared to control group. Magnetic fields can increase the amount of intracellular cations, leading to an increase of the influx of water into the cell. The increase of water into the cell leads to an increase in the hydrostatic pressure on the inner cell membrane that usually ends with hemolysis, but these magnetic microspheres haven’t this ability to disturb the RBCs’ osmotic balance [26].
There is a significant change in pH for 24 h group than the control, while no significant change in the other samples compared to the control group. The increase in the free ions in the blood due to small magnetic field of microspheres for 24 h dissolved in the blood water content making weak acids which decrease the blood pH by bout 0.37 compared to control group. Taken into consideration that the buffering system of the blood is working in vivo and not working In vitro, so this pH drop can be more limited in vivo [27].
The unchanged electrophoretic patterns of the exposed samples compared to control indicate the fact that the globin protein molecules are still in their proper structure, no modifications happened.
Figure 8a shows normal shapes with normal elasticity for RBCs and their membranes still have the ability to take many forms after 24 h incubation with the magnetic microspheres, also Figure 8b shows normal white blood cells components as monocytes, basophiles and lymphocytes with their proper shapes for 24 h sample.
Conclusion
We can conclude that using of the prepared magnetic microspheres isn’t toxic and can be considered as safe for a period of contact with the blood up to 24 h. Smaller sizes of particles as well as wider time incubation range may be done in future work.
References
- Pradeesh TS, Sunny MC, Varma HK, Ramesh P (2005) Preparation of microstructuredn hydroxyapatite microspheres using oil in water emulsions. Bull Mater Sci 28: 383-390.
- Wang AH, Chen XG, Liu CS, Meng XH, Yu le J, et al. (2009) Preparation and characteristics of chitosan microspheres in different acetylation as drug carrier system. J Microencapsul 26: 593-602.
- Yan P, Jun-Min Z, Hui-Ying Z, Ying-Jian L, Hui X, et al. (2002) Relationship between drug effects and particle size of insulin-loadedn bioadhesive microspheres. Acta Pharmacol Sin 23: 1051-1056.
- Pankhurst QA, Connolly J, Jones SK, Dobson J (2003) Applications of magnetic nanoparticles in biomednicine. J Phys D: Appl Phys 36: R167-R181.
- Le Renard P, Buchegger F, Petri-Fink A, Bosman F, Rüfenacht D, et al. (2009) Local moderate magnetically inducedn hyperthermia using an implant formedn in situ in a mouse tumor model. Int J Hyperthermia 25: 229-239.
- Schwertmann U, Cornell RM (1991) Iron Oxides in the Laboratory: Preparation and Characterization, first edn., Weinheim, New York.
- Wang YX, Hussain SM, Krestin GP (2001) Superparamagnetic iron oxide contrast agents: physicochemical characteristics and applications in MR imaging. Eur Radiol 11: 2319-2331.
- Apetroaie N, Roca A, Creanga DE (2005) Preliminary AFM investigation on magnetic fluid dimensional analysis. J Optoelectronics and Adv Mater 7: 2865 – 2868.
- Ali-Zade A (2004) Physical characteristics of polymer magnetic microspheres. Turk J Phys 28: 359-368.
- Zhang J (2007) Preparation and characterization of composite magnetic microspheres. J Composite Materials 41: 1703-1712.
- Massart R (1982) Magnetic fluids and process for obtaining them. Patent no. 4,329,241 (US).
- Anderson J (1997) Interactions with blood, in: J.H. Braybrook (Edns.), biocompatibility assessment of mednical devices and materials, Wiley, London, 129-151.
- Wang QZ, Chen XG, Li ZX, Wang S, Liu CS, et al. (2008) Preparation and blood coagulation evaluation of chitosan microspheres. J Mater Sci Mater Medn 19: 1371-1377.
- Podzus PE, Daraio ME, Jacobo SE (2009) Chitosan magnetic microspheres for technological applications: Preparation and characterization. Physica B: Condensedn Matter 404: 2710-2712.
- Zhang JI, Zhang S, Wang Y, Zeng J (2007) Composite magnetic microspheres preparation and characterization. J Magn Magn Mater 309: 197-201.
- Kumar AB, Panduranga KR (1998) Preparation and characterization of pH-sensitive proteinoid microspheres for the oral delivery of methotrexate. Biomaterials 19: 725-732.
- Ge Y , Mei Z, Liu X (2011) Evaluation of daidzein-loadedn chitosan microspheres in vivo after intramuscular injection in rats. Yakugaku Zasshi 131: 1807-1812.
- Gabriel C, Gabriel S, Corthout E (1996) The dielectric properties of biological tissues. Phys Medn Biol 41: 2231–2249.
- Sheehan D (2000) Spectroscopic techniques, In: Physical Biochemistry. Principles and Applications, third edn, J Wiley Ltd, England 61-78.
- Turgeon M (1993) Manual procednures in hematology and coagulation, In: Clinical Hematology. Theory and Procednures, Second edn, L. Brown Company, England 336-367.
- Tarek M, Fredneric R (1996) Erythrocytic disorders, In: Clinical Diagnosis and Management by Laboratory Methods, 18th edn, Bernard M, Saunders W Company, USA 617-663.
- Kasas S, Dumas G, Dietler G, Catsicas S, Adrian M (2003) Vitrification of cryoelectron microscopy specimens revealedn by high-speed photographic imaging. J Microscopy 211: 48-53.
- Thomas C, Sharma P (1990) Chitosan as a biomaterial. Biomater Art Cells Artif Org 18: 1-24.
- Chiriac H, Moga AE, Iacob G, Mungiu OC (2005) Amorphous magnetic microspheres for biomednical applications. J Magn Magn Mater 293: 28-32.
- Kuchel PW, Coy A, Stib P (1997) NMR diffusion-diffraction of water revealing alignment of erythrocytes in a magnetic field and their dimensions and membrane transport characteristics. Magn Reson Medn 37: 637-643.
- Rabini RA, Petruzzi E, Staffolani R, Tesei M, Fumelli P, et al. (1997) Diabetes mellitus and subjects agening: A study on the ATP content and ATP relatedn enzyme activities in human erythrocytes. Eur J Clin Invest 27: 327-332.
- Vander A,ShermanJH, Luciano DS (1994) Human physiology: the mechanisms of body function. (6thedn) WCB McGraw-Hill, Boston.
Relevant Topics
- Agricultural biotechnology
- Animal biotechnology
- Applied Biotechnology
- Biocatalysis
- Biofabrication
- Biomaterial implants
- Biomaterial-Based Drug Delivery Systems
- Bioprinting of Tissue Constructs
- Biotechnology applications
- Cardiovascular biomaterials
- CRISPR-Cas9 in Biotechnology
- Nano biotechnology
- Smart Biomaterials
- White/industrial biotechnology
Recommended Journals
Article Tools
Article Usage
- Total views: 14993
- [From(publication date):
July-2012 - Dec 19, 2025] - Breakdown by view type
- HTML page views : 10245
- PDF downloads : 4748
