City Susceptibility and Sustainable Development in Southeast Asia
Received: 30-Jan-2015 / Accepted Date: 30-Jan-2015 / Published Date: 10-Feb-2015 DOI: 10.4172/2157-7617.1000255
8724Management of city susceptibility is prerequisite to global sustainable development. For this reason, many international agencies have conducted assessments that compare city susceptibilities on a global scale and used the results of these assessments as standards for setting their institutional priorities. For example, the South Pacific Applied Geoscience Commission (SOPAC) and the United Nations Environment Programme (UNEP) have developed the Environmental Vulnerability Index (EVI), which compiles 50 different indicators regarding weather and climate, geology, geography, ecosystem resources and human populations and composites them into a single index. This kind of composite index is a relatively simple way to combine various aspects of susceptibilities for consideration [1-3]. The concept of city susceptibility typically incorporates both biophysical and socioeconomic factors. Data on biophysical aspects mainly relate to risk of hazards, climate, geology and geography, whereas socioeconomic aspects include the system's inherent resistance to damage and acquired adaptive capacity [4,5].
In Kuala Lumpur in 1989 the city center urban density was more than 90%, the share of agriculture was 10%, forest and water was 0% (Figure 1). Till 4 km distance from center the urban/built-up area continuously reduces (55%) and agriculture has continuously increased till 45%. Latter on both have small variation and from 8 to 15 km distance both classes reduce. In the last both classes were stable or variant little bit and after 40 km distance both classes have 0% density. Forest class has 0% density from 1 to 4 km and from 30 to 50 km distance. It has less than 10% density from 5 to 30 km distance. The water class has almost close to 0% density in all distance. In 2001 density of urban/built-up and agriculture is same like 1989 till distance of 8 km. Later on urbanization reduces continuously. In 2001 agriculture has 10% density from 8 to 50 km distance. Forest has 0% density on 1 and 50 km distance. Forest has highest 15% density on 9 km and 10% density on 7, 8, 10, 11, 16 and 17 km distance. Water class was very less on maximum distance and has 0% density (Figure 2). In 2014 in city center urban density was more than 95% and other classes (agriculture, forest and water) was less than 5%. From 1 to 3 km distance, urban/built-up areas reduce till 75% but agriculture increase and reach up to 22%, later on reduce or varies around 10 to 15% in all distances. Urban/built-up density again increases after 3 to 6 km and later on reduces continuously and reaches on 0% density on 50 km distance. Forest was variant on 10% and vise-versa with agriculture class [6-9]. In all distances water was close to 0% density (Figure 2).
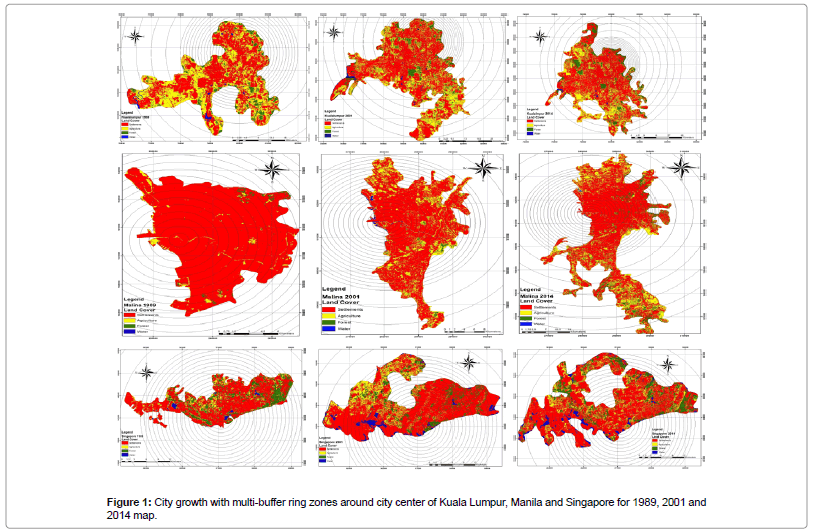
Figure 1: City growth with multi-buffer ring zones around city center of Kuala Lumpur, Manila and Singapore for 1989, 2001 and 2014 map.
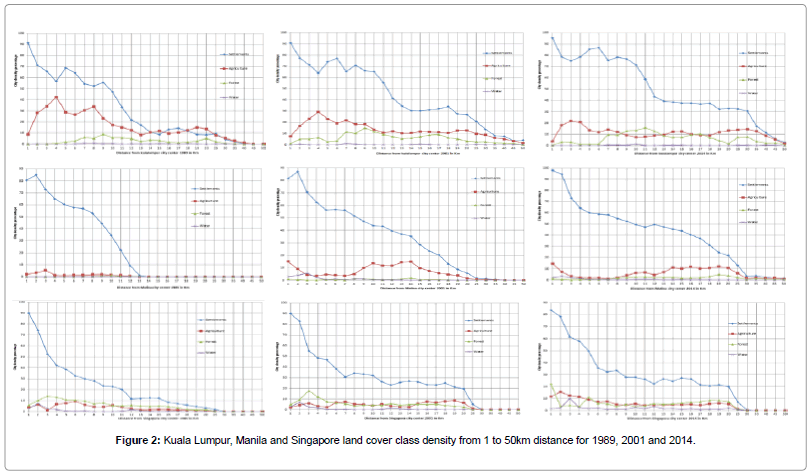
Figure 2: Kuala Lumpur, Manila and Singapore land cover class density from 1 to 50km distance for 1989, 2001 and 2014.
In Manila in 1989 urban/built-up was 80% and other classes were close to 0% on city center. Later on urbanization was reducing continuously and on 13 km distance all classes was 0% so final city boundary was till 13 km. In 2001 agriculture was around 15% and little bit water class but forest density 0% and urbanization was more than 80% on city center. Agriculture was reducing till 3 km distance later on increase and highest on 13-14 km around 18% and after 25 km its 0%.
In all distance forest and water variant near to 0%. In 2014 urbanization is more than 95% and agriculture was more than 15%. Urban was reducing continuously and reach 0 on 30 km distance. Other classes were also close to 0 but from 13 to 25 km distance agriculture was around 10% [10-13].
In Singapore water, forest and agriculture was around 5% and urban was 90% on city center in 1989. Later on urban reduce continuously and 0% on 25 km distance. Other classes’ variant around 5% for all distance from 0 to 30 km. Highest agriculture density was on 3-4 km distance, more than 10% density. In 2001 highest agriculture density was on 3 km distance around 18% and all three classes (forest, agriculture and water) were variant in between 5-10% density from 1 to 25 km distance. Urban was highest on city center around 90 % and then reduce continuously and reach 0% on 30 km distance so urban sprawl was till 30 km in 2001. In 2014 situation was very much similar to 2001 [14,15].
Remote sensing and GIS is a useful tool for such study. This study is helpful for governmental policies for sustainable development in Southeast Asia. Centre part of these cities has higher damage situation due to industry, high population density, lack of general amenities or facilities and degradation of water quality. Slum population is also high with low income groups and all these things indicate high level of exposer and sensitivity. To reduce the susceptibility, these cities have low adaptive capacity for these potential impacts. So government need to give subsides and financial support to build infrastructure. As adaptive capacity is very low in these cities so police maker should focus on natural resource management. Natural resources such as swamps, grassland and mangroves are environmentally important ecosystems because they serve as a buffer against natural disasters, including self-purification [16,17]. If policies regarding nature protection and restoration are implemented, sensitivity to exposure can be reduced. As some part of cities is less susceptible and have more adaptive capacity to reduce susceptibility. These parts are mainly exposer due to artificial resource management such as various pollution controls. So implementation of pollution control, develop the infrastructure such as water treatment plants is a good approach. Shifting the high population density could be a good approach in the whole city to reduce the susceptibility and sustainable development [18,19].
References
- Boori MS, Vozenilek V, Choudhary K (2015) Land use/cover disturbances due to tourism in Jeseniky Mountain, Czech Republic: A remote sensing and GIS based approach. Egypt J RemotSens Space Sci 17: 01-10.
- Boori MS, Vozenilek V, Balzter H, Choudhary K (2015) Land surface temperature with land cover classes in ASTER and Landsat data. J GeophysRemotSens 4: 01-03.
- Boori MS, Netzband M, Vozenilek V, Choudhary K (2015) Urbanization analysis through remote sensing and GIS in Kuala Lumpur, Manila and Singapore cities. Recent AdvElecEng 42: 99-110.
- Boori MS, Ferraro RR (2015) Global Land Cover classification based on microwave polarization and gradient ratio (MPGR). Geo-informatics for Intelligent Transportation. Springer International Publishing, Switzerland 71: 17-37.
- Boori MS, VozenilekV, ChoudharyK (2015) Land Use / Cover Change and Vulnerability Evaluation in Olomuc, Czech Republic. ISPRS Ann. PhotogrammRemotSens Spatial InfSci II-8, 77-82.
- Choudhary K, Boori MS, Novacek P (2014) A multi-criteria approach: for empowerment to enhancing community sustainable development. J GeophysRemotSens 3: 01-04.
- Choudhary K, Boori MS (2014) Earth science and climate change in concern of Socio-economics. J Earth SciClim Change 5: 01-01.
- Boori MS, Vozenilek V (2014) Land-cover disturbances due to tourism in Jeseniky mountain region: A remote sensing and GIS based approach. SPIE Remote Sensing. 9245, 92450T: 01-11.
- Boori MS, Vozenilek V (2014) Socio-hydrological vulnerability: A new science through remote sensing and GIS. Global J Res Eng: E Civil StructEng 14: 36-42.
- Boori MS, Vozenilek V (2014) A remote sensing and GIS based approach for vulnerability, exposer and landscape trajectories in Olomouc, Czech Republic. Global J Res Eng: E Civil StructEng 14: 06-32.
- Boori MS, Vozenilek V, Balzter H (2014) Satellite datasets and there scaling factor for land surface temperature. J GeolGeosci 3: 01-02.
- Boori MS, Vozenilek V (2014) Assessing land cover change trajectories in Olomouc, Czech Republic. World Academy of Science, Engineering and Technology (WASET). Int J Environ EcolGeol Mining Eng 8: 540-546.
- Boori MS (2014) Earth science and climate change overview in context of human and natural causes. J Earth SciClim Change 5: 01-02.
- Boori MS, Ferraro RR, Vozenilek V (2014) NASA EOS Aqua Satellite AMSR-E data for snow variation. J GeolGeosci 3: 01-06.
- Boori MS, Vozenilek V (2014) Remote Sensing and land use / land cover trajectories. J GeophysRemotSens 3: 01-07.
- Boori MS, Vozenilek V, Burian J (2014) Land-cover disturbances due to tourism in Czech Republic. AdvIntellSystComput. Springer International Publishing Switzerland 303: 63-72.
- Boori MS, Vozenilek V (2014) Land use/cover, vulnerability index and exposer intensity. J Environ 1: 01-07.
- Boori MS, Vozenilek V (2014) Remote sensing and GIS for Socio-hydrological vulnerability. J GeolGeosci 3: 01-04.
- Boori MS, Ferraro RR (2013) Microwave polarization and gradient ratio (MPGR) for global land surface phenology. J GeolGeosci 2: 01-10.
Citation: Boori MS, Choudhary K, Kupriyanov A (2015) City Susceptibility and Sustainable Development in Southeast Asia. J Earth Sci Clim Change 6: 255. DOI: 10.4172/2157-7617.1000255
Copyright: © 2015 Boori MS, et al. This is an open-access article distributed under the terms of the Creative Commons Attribution License, which permits unrestricted use, distribution, and reproduction in any medium, provided the original author and source are credited.
Select your language of interest to view the total content in your interested language
Share This Article
Recommended Journals
Open Access Journals
Article Tools
Article Usage
- Total views: 15578
- [From(publication date): 2-2015 - Aug 30, 2025]
- Breakdown by view type
- HTML page views: 10922
- PDF downloads: 4656