Detection Efficiency Comparison of the UV-APS and TACBIO using Inert Fluorescent and Biological Particles
Received: 05-Nov-2018 / Accepted Date: 20-Dec-2018 / Published Date: 27-Dec-2018 DOI: 10.4172/2157-2526.1000167
Abstract
Airborne CB threats have evolved into a serious and omnipresent battlefield threat against US military forces. Real time detection of these agents is an essential tool in the war against terrorism; government agencies employ fluorescent based aerosol detectors to provide real-time detection of these airborne biological particles. The TSI Model 3314 UVAPS has been used as the gold standard in military studies for detecting and quantifying airborne bio-threat particles for many years, however, the system was designed for laboratory applications and has several drawbacks; it is bulky, very expensive, and is no longer in production. This study evaluated the performance of a small and inexpensive aerosol detector, the TACBIO, as a low cost alternative to the UV-APS in aerosol detection. In this test, both systems were evaluated against aerosolized monodispersed polystyrene latex microspheres (PSLs) (1.4, 1.9, and 2.6 μm) and monodisperse bacteria spore clusters. Three Bacillus anthracis Ames simulant organisms were used in the bio test: Bacillus atrophaeus var. globigii (Bg), Bacillus thuringiensis (Bt), Bacillus anthracis Sterne (BaS). In the second part of the test, the counting efficiency of both instruments were compared by sampling 3 μm fluorescent PSL microspheres from a chamber. The counts obtained from both instruments were correlated to determine how well their detection efficiencies match up. The resulting data demonstrate that the TACBIO tracks the detection efficiency of UV-APS very well when sampling 3 μm PSL microspheres. The detection efficiency of the UV-APS and TACBIO were close to 100% for PSL microspheres and Bt and BaS particles, however, the TACBIO results for Bg were slightly lower due to the lower fluorescence properties of Bg. In spite of this minor difference, the TACBIO performed well in comparison to the much more expensive UV-APS systemes.
Keywords: Ink Jet Aerosol Generator; Aerosols; Biological Aerosols
Introduction
Real time sampling and detection of airborne CB threats is an essential tool in the war against terrorism. In the battlefield arena it is necessary to detect, sample, and identify the presence of chemical, biological, and nuclear aerosols in near real time to mount an adequate defense and reduce casualties. Government agencies such as the Department of Homeland Security (DHS), Department of Defense (DOD), and first responders employ portable fluorescent based aerosol detectors to provide real-time detection of dangerous airborne biological particles, and initiate precautionary measures such as respirator use or evacuation of an area until the detected hazards are eliminated. Aerosol detectors can also be used as “triggers” to turn on aerosol samplers that collect the particles and deliver them to an identification system for forensic or treatment purposes. There are many commercial aerosol detectors available for these purposes, however in most cases their performance has not validated by third party testing. Knowledge of the available systems’ detection efficiencies allows for the optimum selection and use to properly protect soldiers, first responders, and the general public from airborne agents, and it is essential to test and validate the performance of these systems so that suitable detectors can be obtained for use by DOD and DHS.
Most commercially available bioaerosol detection systems interrogate the fluorescent properties of airborne particles to determine whether they are biological in nature. Although the fluorescence characteristics of a particle may be used to indicate that the particle is biological in origin, it may not be enough to differentiate from nonbiological particles with similar properties. For example, cigarette smoke and other combustion products also produce fluorescence signals with UV excitation, but these particles are smaller in size (typically sub-micron); therefore, the particle size information and the amount of fluorescence can be used to differentiate them from biological particles. Subsequently, any properly designed detection algorithm must use a combination of particle size and fluorescence data to adequately determine when a threat is present.
A recent market survey conducted by Emanuel and Caples summarizes and describes many commercially available biodetectors and their performance characteristics [1]. Emmauel and Caples have listed detectors such as the following:
• AbleSentry (Lockheed Martin, San Diego, CA),
• ABSS (ATHINA Biological Security System, Chemring Group, Charlotte, NC),
• Airocollect-Detect-288 (Airogistic, LLC, Austin TX),
• ARETE TRAP (Threat Reduction Advancement Processor, Arete, Northridge, CA),
• Biological alarm monitor (MAB, PROENGIN, Inc. Plantation, FL),
• kBioTM-FD (Partner Airogistic, LLC, Tucson, AZ), etc.
The above list encompasses portable bio-sensors for field and laboratory use; on the other hand, the TSI Model 3314 UV-APS (TSI Inc., Shoreview, MN) was designed for laboratory use as a high resolution aerosol spectrometer, providing data on particle size and fluorescence only. UV-APS has been commonly used as a referee device in studies for both laboratory and field tests as the standard to provide the size and fluorescence properties of airborne challenges in such studies. Similar to many other detectors, the UV-APS utilizes laser-induced fluorescence (LIF) to quantify non-fluorescent and fluorescent airborne particles. LIF technology has been demonstrated as an effective method to detect molecules such as tryptophan, NADH, and flavins that are present in microbial cells. However, the Model 3314 is quite expensive (~$150K) and has recently been discontinued by its manufacturer, necessitating a search for a replacement system for laboratory and field studies.
TACBIO® Gen II (TACBIO) is a low cost, portable LIF based bioaerosol detector developed by the US Army Edgewood Chemical Biological Center (ECBC). This instrument is frequently used as a laboratory and field instrument for bioparticle detection in DOD studies, and is under consideration as a possible replacement for the UV-APS. In this study, the detection efficiency of TACBIO was compared to the detection efficiency of the UV-APS system using inert and biological particles.
Methodology
The first part of the study evaluated the detection efficiency of the TACBIO and UV-APS using precisely generated mono-dispersed particles of known sizes and concentration. The second part of the study compared the number of particles measured by both instruments in a larger chamber setting. The systems were evaluated with monodispersed polystyrene latex microspheres (PSLs) and bacteria spore clusters generated with an Ink Jet Aerosol Generator (IJAG). The PSL microsphere sizes tested in this study were: 1.4, 1.9, and 2.6 μm. Three organisms were used in the bio test: 2.6 μm spore cluster of Bacillus atrophaeus var. globigii (Bg), 2.1 μm spore cluster of Bacillus thuringiensis (Bt), and 2.3 μm spore cluster of Bacillus anthracis Sterne (BaS). These three organisms were selected as they are simulants for Bacillus anthracis Ames and the individual organisms of these species are similar in size (~1 μm). The detection efficiency is defined as the number of particles detected by the instrument compared to the number of particles delivered to the instrument. IJAG generated particles were directly delivered into the instrument inlet to deliver all the particles into the system and to reduce any particle losses.
In the second part of the test, the counting efficiency of both instruments were compared by sampling 3 μm fluorescent PSL microspheres from a chamber. The counts obtained from both instruments were correlated to determine whether they track each other well.
UV-APS
The Ultraviolet Aerodynamic Particle Sizer (UV-APS) (Model 3314, TSI Incorporated, Shoreview, MN) is a point detection particle spectrometer. This instruments provide real time data on particle diameter and particle fluorescence. The UV-APS provides particle size in the range of 0.5–20 μm, with 52 channels of resolution. In addition, the particles are separated in to 64 bins based on fluorescence measurements. Information regarding how the instrument utilizes a continuous laser is provided by Hairston et al [2]. However, the commercial instrument contains a pulsed laser that provides an excitation wavelength of 355 nm and collects emission wavelengths of 420 to 575 nm for analysis.
The UV-APS makes an aerodynamic size measurement of particles accelerated through two separated red laser beams to produce a doublecrested beam profile. The time for each particle to travel between the two beams is measured and compared to the calibration curve to determine the aerodynamic particle size. Particles with only one crest or more than two crests are not used in size distribution calculations but logged for concentration purposes. After the particle passes the time of flight region, the particle enters the fluorescence region. Particle fluorescence is measured by a second pulsed UV light with an excitation wavelength of 355 nm. A photomultiplier tube located behind a UV blocking filter collects the fluorescence emitted by each particle in the wavelengths of 420 to 575 nm.
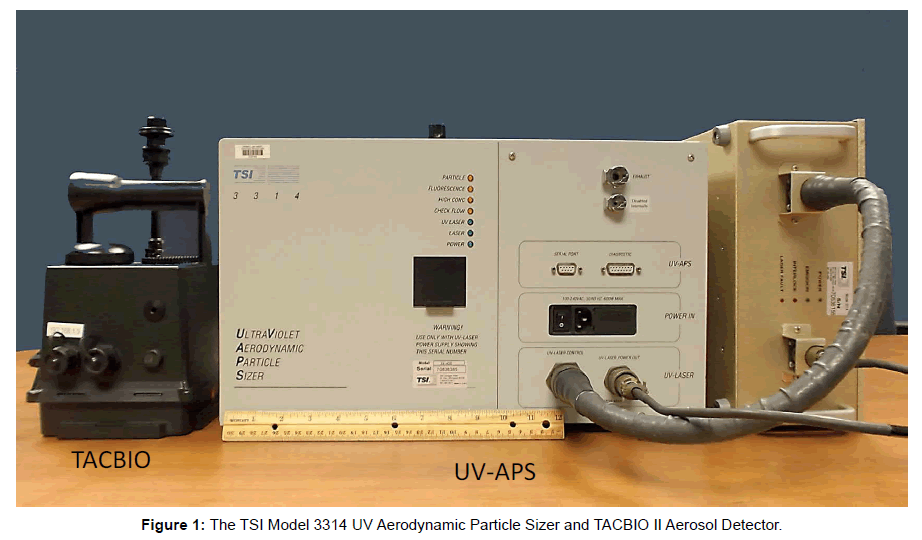
In addition to the aerodynamic diameter and fluorescence properties of particles, light scattering diameter is also determined using the scattered light from the red time-of-flight laser light. Light scattering distribution, aerodynamic size distribution, and fluorescent distribution of the aerosols are obtained and plotted in real-time. The UV-APS is designed primarily for lab use, as a result it is heavy (76 lbs), and large (11” × 16” × 18”) with a sample flow rate of 1 L/min. A picture of the UV-APS is shown in Figure 1. The UV-APS requires an external computer to run the instrument and the operating temperature is 10- 34°C. It can sample air in user specified intervals from one second to eighteen hours.
TACBIO II aerosol detector
The TACBIO II sensor, shown in Figure 1 is a small, portable point detector which measures only the fluorescence of particles, but does not provide size data. A high power light emitting diode (LED) provides the deep-ultraviolet (UV) light source to excite the particles at 270 nm and produce fluorescence and scattered light off of particles. A photomultiplier tube measures the fluorescence emitted by the particles in the wavelength range of 317-700 nm. The TACBIO samples the air at a flow rate of 1.0 to 1.3 L/min.
The sampling interval of the TACBIO is not adjustable and is set at five seconds. The number of particles measured is reported for each five second sampling interval. The TACBIO has a wide particle count range (0 to 10,000 particles per liter) which allows it to be used in both clean rooms and high dust areas. The operating temperature of the TACBIO is from -15 to 50°C. TACBIO II is light weight (1.5 kg) and small with a volume of 7929 cm3 (0.28 cubic feet). It can either run on battery (14 hours of run time with BB-5590 battery) or AC power. This instrument is inexpensive, and is estimated to cost around $2000 in quantities of 10,000 or more. The low cost allows the instrument to be used for tactical purposes by placing many units at various locations in the field. The TACBIO has many operational advantages over the UV-APS, being far smaller and lighter, with a wider excitation band and less power consumption, making it ideal for field sampling.
Ink jet aerosol generator
Various size PSL microspheres and bacteria spore clusters were generated by the IJAG for this test. The IJAG was designed to enable testing of bioaerosol detection instruments in aerosol chambers, where the desired bioaerosol concentration may be only a few particles per liter of air. The ink jet aerosol generator uses nozzles that are of the order of 50 micrometers in diameter, which allows the transmission of liquid suspensions of small size PSL microspheres and bacterial spores (1 μm in size). The IJAG system is successful in generating highly repeatable monodisperse particles from liquid suspensions of a wide variety of materials, including bacterial spores. A feedback design allows a specific number of particles to be accurately produced, at a user-selectable rate of 1–500 particles/second. In addition, the computer control allows for the generation of one particle with each click of a button or automated generation of a set number of particles per second. Particles can also be generated for a set number of time period or to produce a preset number of total particles.
By adjusting the concentration of particles in a liquid suspension, a range of monodispersed inert and bioaerosol cluster sizes can be produced. This process also generates unwanted satellite particles of much smaller sizes; the IJAG employs aerodynamic fractionation to separate the smaller unwanted satellite droplets from the primary droplets in freshly formed aerosol and direct them away from the instrument outlet, resulting in only the monodisperse primary particles at the IJAG outlet for detector testing. Additional information about the IJAG is provided in Kesavan et al. [3]. The IJAG has been used in many experiments to generate inert and biological particles [3,4]. After droplet generation, a HEPA-filtered carrier flow moves the primary droplet particles through a drying tube and into the test instrument inlet. The aerosol concentration output from the IJAG can be calculated directly from the particle count rate provided by the internal light scattering system and the airflow rate at the exit of the oven. Because the IJAG counts the large original droplets before drying commences, there is no need to measure the concentration of the residue particles.
Detection efficiency testing using the IJAG
The detection efficiency of the UV-APS and the TACBIO were determined in a clean air chamber (8 by 8 by 8 ft3) with HEPA filtered air entering the chamber from the roof. The IJAG was used to generate the aerosol challenge and directly delivered the challenge particles into the inlet of the detector to ensure ~100% delivery into the detector.
For this test, the IJAG generated PSL clusters in sizes of 1.4, 1.9, and 2.6 μm at rates of 1, 2, 3, 5, 10, 50, and 100 particles/second. These PSL clusters were generated using 0.5 μm green fluorescent PSL microspheres. In addition, the IJAG also generated spore clusters of BaS, Bg and Bt at number mean diameters of 2.3 ± 1.1, 2.6 ± 1.2, and 2.1 ± 1.1 μm, respectively and at rates of 1, 2, 3, 5, 10, 50, and 100 particles/second. Particle detection efficiency was then determined by comparing the detected number of particles against the IJAG’s aerosol generation rate.
Chamber testing
Testing with PSL microspheres to determine the correlation of both UV-APS and TACBIO were conducted in a 3 by 4 by 5 ft3 Plexiglas box. Both the UV-APS and TACBIO were positioned to have their inlets at the same height in such a way that it would allow equal access to the aerosol and eliminate any sampling errors. The aerosol was generated with a Collison nebulizer and mixed by a fan for 30 seconds to obtain uniform aerosol concentration in the chamber before the detectors sampled the air. The TACBIO has a preset sample time of five seconds but the sample time of the UV-APS is adjustable from one second to eighteen hours; therefore, a sample time of ten seconds was selected for the UV-APS to simplify calculations. The TACBIO recorded sixty 5-second samples and the UVAPS recorded 30 10-second samples, resulting in each device detecting the mixture for a total of 5 minutes. The effect of airflow rate was eliminated by dividing the number of TACBIO particles by 1.3 as the TACBIO had an airflow rate of 1.3 L/ min while the UV-APS had an air flow rate of 1 L/min.
The computer attached to the UV-APS takes some time to save each 10 second run; therefore, the samples obtained by the UV-APS are slightly shifted in time. The data obtained by each instrument was fitted to a decay curve so that data obtained by each instrument can be compared at the same time point using the fitted equation. The particle concentration for the UV-APS was calculated for each TACBIO time point and a correlation graph was created.
Results
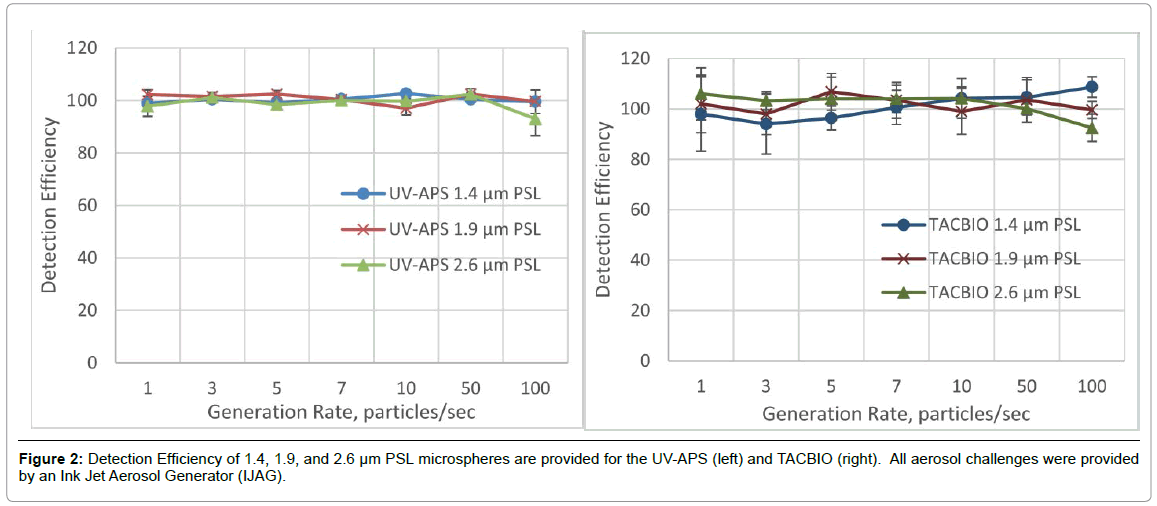
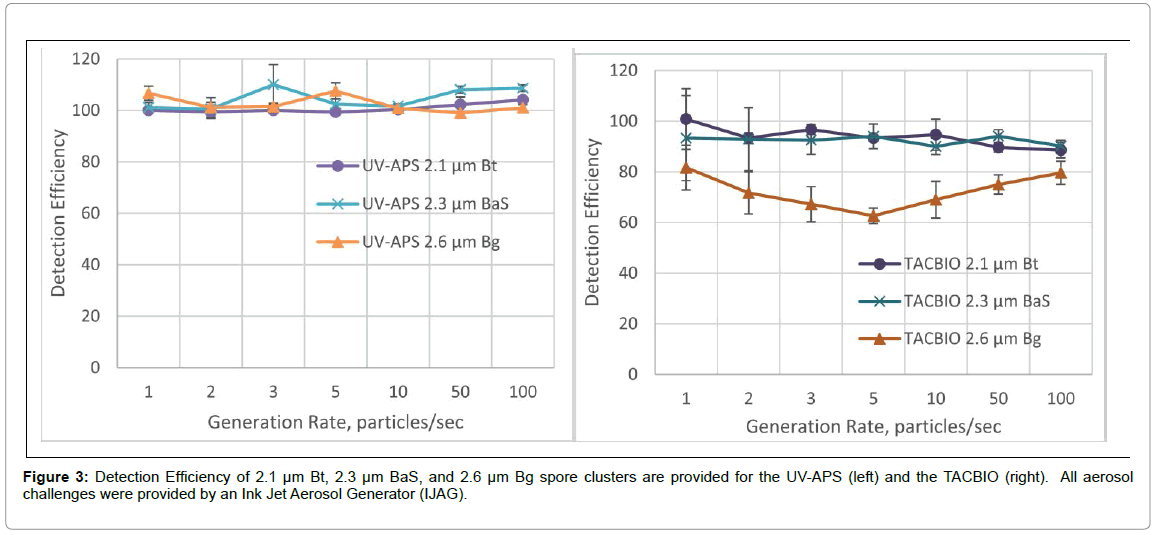
Detection efficiency results of UV-APS and TACBIO for challenges with inert PSL microspheres and biological particles are provided in Figures 2 & 3 respectively. The detection efficiency of UV-APS was close to 100% and ranged from 97% to 102.6% for PSL microspheres and from 99% to 108.61% for bacteria species for all particle generation rates. On the other hand, detection efficiency was slightly lower for the TACBIO compared to UV-APS and ranged from 92.5% to 108.7% for PSL microspheres and from 62.67% to 100.83% for biological particles for all particle generation rates. The TACBIO data revealed less sensitivity in detecting biological particles, especially, the Bg spores. The sampling efficiency of Bg showed a significant decrease from 1-5 particles/second (down to 62.8%), then an increase from 5-100 particles/second (back to 80%). This did not appear with PSL or the other bio-organisms and could be an anomaly due to clogging of the IJAG cartridge at low generation rates.
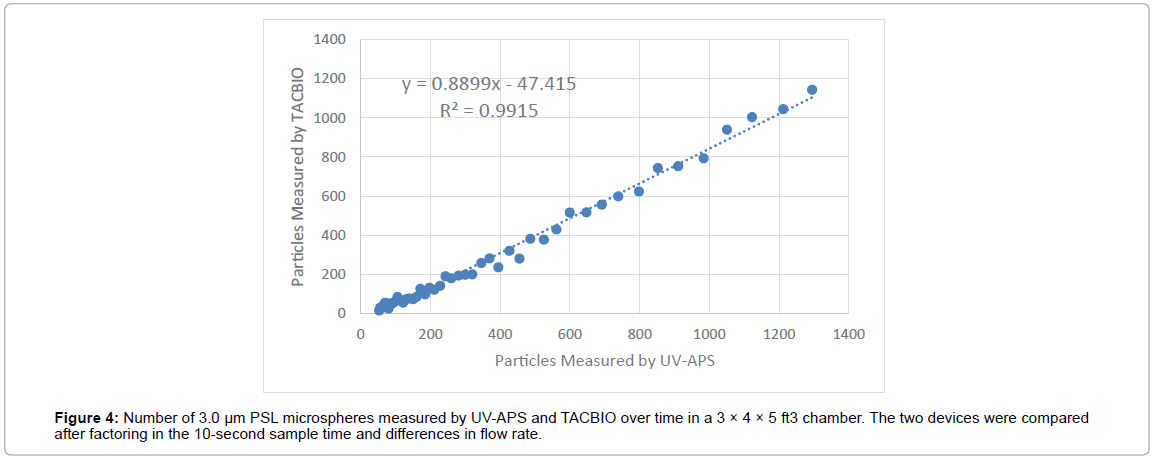
Correlation of 3 μm particles measured by the UV-APS and TACBIO are provided in Figure 4. The results indicate that the particle counts measured by both instruments track each other well with an r2 value of 0.99.
Discussion
In this test, the detection efficiency of the TACBIO was directly compared with the UV-APS using PSL microspheres and biological particles at various sizes and concentrations. The detection efficiency of UV-APS and the TACBIO were similar (100% vs. 101.6%) for the PSL microspheres; however, the TACBIO had a higher variability compared to the UV-APS. In addition, testing with biological clusters indicated that the UV-APS showed similar detection efficiency for all three organisms but the TACBIO showed a lower detection efficiency for one biological organism (Bg). The detection efficiency of UV-APS for Bt, BaS, and Bg were 100.8 ± 1.7, 104. 6 ± 4.1, and 102.5 ± 3.3, respectively. The detection efficiency of TACBIO for Bt, BaS, and Bg were 93.9 ± 4.2, 92.4 ± 1.7, 72.4 ± 6.8, respectively. Correlation of 3 μm PSL microspheres measured by both instruments in a chamber indicated that TACBIO has slightly lower particle counts but they tracked each other very well with an R2 value of 0.99.
This study used highly fluorescent PSL microspheres and three sizes of biological particles in the size range of 2.1 to 2.6 μm. Larger particles produce higher fluorescence and are detected at a higher rate compared to smaller and lower fluorescing particles. The results from this study showed a lower detection efficiency of the TACBIO for biological particles, which is likely due to three factors. First, the excitation wavelength is different for the two instruments. A study by Pan et al. Showed a lower detection efficiency for Bg using an excitation wave length of 266 nm, closer to the TACBIO wavelength of 270 nm than the UV-APS wavelength of 355 nm [5]. Second, the UV-APS has an accurate flow control system, but the TACBIO uses a small compressor pump whose airflow varies depending on the ambient air pressure, which is the atmospheric pressure minus the slightly negative pressure (compared to ambient) of the test chamber. Although the atmospheric pressure varies slowly, the pressure change over the course of several hours can slowly alter the TACBIO’s flowrate by up to 15%. A third factor could be anomalies in the aerosol generation. The detection efficiency of both the UV-APS and the TACBIO were determined by dividing the particles counted for each instrument by the particle generation rate of the IJAG. However, particles generated by the IJAG can range up to ± 7% from the set generation rate. In future studies the actual number of particles generated will be used in the efficiency calculation instead of the generation rate. Since the difference in detection efficiency was prominent only for Bg, it is likely that the different excitation wavelengths for the TACBIO and UV-APS is the major factor, since the other two effects are random over time and not specific to any particle type.
Strengths of the study include the use of a novel, aerosol generation system, IJAG, for the detection efficiency testing of the UV-APS and TACBIO with inert PSL microspheres and biological particles across a 100 fold concentration range. Detection efficiency testing with the IJAG is an efficient method and has been used in many sampling efficiency tests [6]. The IJAG can be programed to generate a known number of particles for delivery into the detector for the detection efficiency testing. The IJAG also can be used for determining limit of detection of samplers and detectors. In addition, the IJAG uses a small volume of liquid so this instrument is useful for testing with agent materials.
Other low cost biological aerosol detectors have been compared to the UV-APS to determine a suitable low cost detector for use in public locations, such as the BioScout system [7,8]. BioScout uses an excitation wavelength of 405 nm and collected fluorescence in the range of >442 nm. The test results indicated that BioScout had higher fluorescent particle detection efficiency compared to the UV-APS. BioScout has a slightly larger air flow rate of 2 Lpm compared to the UV-APS and TACBIO. The BioScout has a smaller particle detection range of 0.2 to 5 μm compared to the UV-APS (0.5 to 20 μm) and TACBIO (0.5 to 50 μm).
Studies have shown that only a fraction of biological particles emit enough fluorescence to be detected by instruments. Agranovski et al [9,10] and Kanaani et al. [11,12] reported that fluorescent particle fraction varied between 2 and 52% for bacteria and 48 and 99% for fungal spores. Although the fluorescence characteristics of a particle may be used to indicate that the particle is biological in origin, it may not be enough to differentiate from non-biological particles with similar properties. For example, cigarette smoke and products of other combustion processes also show fluorescent properties; however, these particles are smaller in size, and the combination of particle size information and fluorescence can be used to differentiate combustion products from biological particles.
This study used highly fluorescent PSL microspheres and three sizes of biological particles in the size range of 2.1 to 2.6 μm. These particles were aerosolized from a liquid suspension as liquid suspension is more reproducible and easily controllable compared to aerosols generated from dry powder. Particles aerosolized and dried from a liquid suspension, should behave very similar to dry dispersed particles. Future studies should evaluate the characteristics of dry dispersed and wet dispersed particles.
Larger particles produce higher fluorescence and are detected at a higher rate compared to smaller and lower fluorescing particles. Future tests should evaluate the detection efficiency of smaller and lower fluorescing biological particles in the size range that is found in the nature. In addition, comparison of these two instruments in natural environments should be conducted to determine whether other particles in the environment could affect the detection efficiency of these instruments.
Conclusion
The TSI Model 3314 UV-APS has been used as a gold standard in studies for detecting airborne bio-threat particles larger than 0.5 μm in air, but is too bulky, expensive for use as a portable field instrument, and also is not manufactured anymore. Recent studies have been conducted to find a cheaper and smaller device to provide many of the same functions of the UV-APS. This study demonstrates that the TACBIO tracks the detection efficiency of UV-APS very well for PSL and bio-particles. Although the detection efficiency of the TACBIO is slightly lower for bio-particles, the differences are not significant for most particles. In addition to providing similar detection characteristics to the UV-APS, the TACBIO is significantly less expensive, smaller, and consumes less power. These enhancements would encourage its use in many additional applications, such as perimeter sensors in the field, where a larger number of detectors are needed.
References
- Emanuel P, Caples M (2011) Chemical, biological, radiological technology surey. US Army RDECOM, Aberdeen Proving Ground, Maryland.
- Hairston PP, Ho J, Quant FR (1997) Design of an instrument for real-time detection of bioaerosols using simultaneous measurement of particle aerodynamic size and intrinsic fluorescence. J Aerosol Sci 28: 471-482.
- Kesavan J, Bottiger JR, Schepers DR, McFarland AR (2014) Comparison of particle number counts measured with an ink jet aerosol generator and an Aerodynamic Particle Sizer. Aerosol Science and Technology 48: 219-227.
- Kesavan J, Schepers D, Bottiger J, Edmonds J (2014) UV-C Decontamination of Aerosolized and Surface Bound Single Spores and Bioclusters. Aerosol Science and Technology 48: 450-457.
- Pan Y-L, Hill S, Santarpia JL , Brinkley K, Sickler T, et al. (2014) Spectrally-resolved fluorescence cross sections of aerosolized biological live agnets and simulants using five excitation wavelengths in a BSL-3 laboratory. Opt Express 22: 8165 -8189.
- Kesavan J, Stuebing E (2009) Aerosol Sampling Efficiency Evaluation Methods at the US Army Edgewood Chemical Biological Center. Atmospheric and Biological Environmental Monitoring 83-103.
- Saari S, Niemi JV, Ronkko T, Kuuluvainen H, Järvinen A, et al. (2015) Seasonal and diurnal variations of fluorescent bioaerrosol concentration and size distribution in the urban environment. Aerosol and Air Quality Research 15: 572-581.
- Saari S, Reponen T, Keskinen J (2014) Performance of two fluorescence-based real-time bioaerosol detectors: BioScout vs. UVAPS. Aerosol Science and Technology 48: 371-378.
- Agranovski V, Ristovski Z, Hargreaves M, Blackall P, Morawska L (2003) Real-time Measurment of bacterial aerosols with the UVAPS: performance evaluation. Journal of Aerosol Science 34: 301-317.
- Agranovski V, Ristovski ZD, Ayoko GA, Morawska L (2004) Performance evaluation of the UVAPS in measuring biological aerosols: Fluorescence spectra from NAD (P) H coenzymes and riboflavin. Aerosol Science and Technology 38: 354-364.
- Kanaani H, Hargreaves M, Ristovski Z, Morawska L (2007) Performance assessment of UVAPS: Influence of fungal spores age and air exposure. Journal of Aerosol Science 38: 83-96.
- Kanaani H, Hargreaves M, Smith J, Ristovski Z, Agranovski V, et al. (2008) Performance of UVAPS with respect to detection of airborne fungi. Journal of Aerosol Science 39: 175-189.
Citation: Mylvaganam P, Alstadt V, Kilper G, Goad A, Kesavan J (2018) Detection Efficiency Comparison of the UV-APS and TACBIO using Inert Fluorescent and Biological Particles. J Bioterror Biodef 9:167. DOI: 10.4172/2157-2526.1000167
Copyright: © 2018 Mylvaganam P, et al. This is an open-access article distributed under the terms of the Creative Commons Attribution License, which permits unrestricted use, distribution, and reproduction in any medium, provided the original author and source are credited.
Select your language of interest to view the total content in your interested language
Share This Article
Recommended Journals
Open Access Journals
Article Tools
Article Usage
- Total views: 5121
- [From(publication date): 0-2018 - Dec 14, 2025]
- Breakdown by view type
- HTML page views: 4053
- PDF downloads: 1068
