Estimation of Genetic Parameters in Coffea canephora Var. Robusta
Received: 05-Sep-2017 / Accepted Date: 24-Oct-2017 / Published Date: 30-Oct-2017 DOI: 10.4172/2329-8863.1000310
Abstract
The objective of this work was to assess the genetic parameters in Coffea robusta clones using mixed model. The experiments were carried out during four years, in complete block design, and one plant per plot, at Oratorio of Minas Gerais state, Brazil. The clones were evaluated for vigor, reaction to rust, reaction to Cercospora, number of ortotropicos branches, number of plegiotropics branches, plant height, diameter of stem, fruit maturity, diameter of canopy, fruit size and production of fruits. The data were analyzed using the mixed model methodology (REML/ BLUP) of Selegen software for estimation of genetic parameters in C. canephora breeding. The results showed a low genetic variability among the clones of Robusta for all the evaluated traits. On the other hand, relatively high residual coefficient of variation for most of the traits was recorded implying that these traits seem to be highly influenced by the environmental variation. However, in this study the estimates of individual heritability in the broad sense (h2g) was of low magnitude, but were significant for all traits except yield (sac/ha). The estimated repeatability for most of the traits was low indicating the irregularity of the superiority of the individuals among the measurements showing that genotype selection based on these traits is not reliable strategy. Generally, there was low interaction with year, as observed by the genotypic correlation across measurement (rgmed) for most of the characters evaluated demonstrating that selection can be performed at any of the development stages used for measurement.
Keywords: Heritability; Mixed model; Repeatability
Introduction
Coffee belongs to the family, Rubiaceae and the genus Coffea L. which comprises over 104 species that have been identified so far. Commercial coffee production relies mainly on two species, Coffea arabica L. (63%) and Coffea canephora Pierre (36%). C. arabica is anatural allotetraploid (2n=4X=44), and is self-fertile [1]. Whereas, other species are diploid (2n=22) and generally self-incompatible. The cup quality made from C. canephora is generally regarded as inferior to that made of C. arabica. However, C. canephora does not need to grow at high altitude, requires less care to grow because it is hardier, and it tends to be less susceptible to pests and rough handling [1]. C. canephora presents a wide genetic variability, with one of the widestgeographic natural distribution within the subgenus Coffea [2]. Hence, genotypic parameters analysis in Coffea canephora has importance, especially for genetic materials from Brazil.
As new coffee varieties are continuously being developed, there is a need to determine the level and sources of genetic variation within and between new and existing coffee varieties [3]. Like it is for many crops, evaluation of the genetic diversity and available resources within the genus coffee is an important step in Coffee breeding [4]. In view of this, characterization and evaluation of its gene pool is necessary for effective crop improvement programs and for better conservation and management of genetic resources [5]. According to Vienne et al. [6], morphological characters are a classical method to distinguish variation based on the observation of the external morphological differences. Morphological and agronomical traits as well as resistance to biotic and abiotic stresses that are known to individual accessions increase the importance of the germplasm. Efficient utilization of indigenous germplasm required knowledge of biodiversity of economic interest [7].
Perennial plant species such as coffee exhibit unique biological aspects such a biennial cycle; overlapping generations; expression of characters over several years and differences in earliness and productive longevity [8]. Those characteristics lead to some consequences, such as the use of selected genetic material for several years, reduction in its useful life survival rate during the experiments, a fact that tends to generate unbalanced data for use in the estimation of genetic parameters and prediction of the breeding and genotypic values [9]. Because of these agronomic peculiarities, genetic improvement of coffee is difficult, and recommended the use of special methods to estimate genetic parameters and predict the genetic values [10,11].
Estimations of genetic parameters permit the understanding of the nature of the gene action involved in trait inheritance and lead themselves to assessment of expected progress with selection, besides defining the best selection method to be adopted [12,13]. Hence, in the Coffea canephora improvement program, the best clones can beselected considering good performance for a number of breeding target traits, so the use of a selection index is a promising method for simultaneous selection. The use of additive selection indices allows a clear visualization of the performance of the progenies combining most of the agronomic allowing for a better selection of the most promising progenies. The reason is that the correlation may be caused by the action of pleiotropic and/or closely linked genes that affect the traits under study [14].
Since the 1930s, several methodologies of genetic evaluation have been proposed, one of them is the least squares for unbalanced data [15]. The application of this method is not free of problems, since the variance of the prediction error is minimal, the functions of the prediction are not always estimable and, depending on the degree of data unbalancing, the values of some genotypes may be used overestimated [16]. Whereas, the mixed models equation described by Henderson [17] introduced changes in the estimation of variance components and breeding values [18]. This method consists basically the predication of genetic values considered random to the unequal number of subclasses and to coefficients of relatedness of genotypes [19].
Since the prediction of genetic values of superior materials is one of the main problems in the breeding of any species, once it requires the true values of variance components, the use of more sophisticated methods, such as BLUP, allows obtaining better estimates for these parameters [20]. This approach takes into account the treatment effects as random, which enables to carry out the genotypic selection instead of the phenotypic one [21,22] and their implications in plant selection is presented by several authors in the literature [20]. Ramalho et al. [23] also emphasize the advantages of the application of BLUP in the improvement of Arabica coffee. This methodology has been used by other authors in various crops such as corn, rice, sugar cane among others. However, there are few reports in the literature of the use of this methodology in the selection of individual plants of Coffea canephora species. Hence, the objective of this study was to estimate genetic parameters and identify the existing variability among C. canephora specie using the mixed model methodology.
Materials and Methods
Plant materials
A total of 52 Robusta variety were used for this study which are maintained at the Coffee Germplasm Collection of EPAMIG (Empresa de Pesquisa Agropecuária de Minas Gerais)/UFV (Universidade Federal de Vicosa) at Oratorios, Minas Gerais, Brazil. The trail was established as a randomized complete block design with 5 replications and one plant per plot was used.
Data collection
Data on 11 quantitative traits recorded on tree basis include vegetative vigor, reaction to rust, reaction to cercospora, number of ortotropics branches, number of plagiotropics branches, plant height, canopy diameter, stalk diameter, fruit maturity, fruit size and production of fruits.
Vegetative vigor average plant scored by the general appearance of the plant, observing the leafiness, the number of orthotropic and reproductive branches, nutritional status and health of coffee, adopting scores from 1 (completely depleted plant) to 10 (highly vigorous plant); reaction to the coffee rust-measured in the peak months of the disease in the field (between March and July), considering grades 1-5, where 1- immune plants without any signs of infection; 2-plants hypersensitivity reaction visible macroscopically, chlorotic lesions, small swellings, without occurrence of sporulation; 3-plants hypersensitivity reaction visible macroscopically, chlorotic lesions usually sporulation the edge and small swellings; 4-plants hypersensitivity reaction visible macroscopically, chlorotic lesions, swellings, occurring average sporulation; and 5 - plants with lesions with intense sporulation and the presence of many large pustules; reaction with Cercospora (RC) - evaluates the scale from 1 to 3, wherein the note 1 refers to plants that showed no disease incidence and grade 3 for plants with high rates of disease; average number of orthotropic branches per plant (NROrt); average number of reproductive branches per plant (NRPla); and average diameter of the tree canopy (DCO)-given in centimeters (cm).
Traits and their years of evaluation are: Vegetative vigor (VIG), Reaction to rust (Ferr) and Plant height in cm (APL), Canopy diameter in cm(DCO)-2011; 2012; 2013; 2014; Reaction to Cercospora (CER)-2011; 2012; 2013: Number of orthotropic branches (NROrt)-2011; 2012. Number of Plagiotropicos branches (NRPla)-2011, Average stem diameter in mm (DCAU)-2013, Fruit maturity (MAT), Fruit size (TFR) and yield per hectare (PROD)-2012; 2013; 2014.
Statistical analysis
Estimation of genetic parameters: In order to estimate genetic parameters among Coffea canephora clones, all the quantitative characters considered in the study were statistically analyzed using REML/BLUP by using Selegen software [21].
Considering the environmental of measurements (m) as fixed, they can be adjusted together the overall average in a single vector of fixed effects. The following model was adjusted.

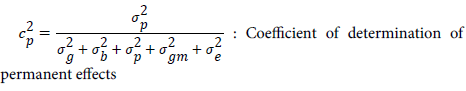
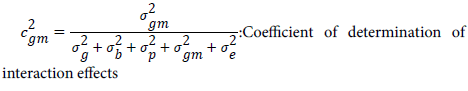
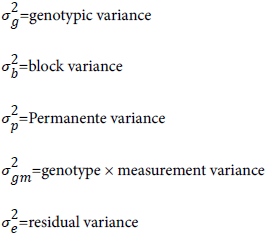
Where:
y, m, g, b, p, gm, e: vectors of data, of measurements (fixed), of genotypic effects (random), of block (random), of permanent environment (random), of genotypic x measurement interaction (random), and random errors, respectively.
X, Z, W, S, T: Incidences matrices for the effects in the model.
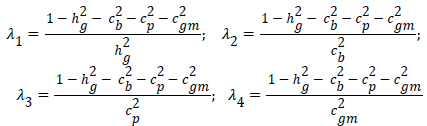
The following mixed model equations were used:
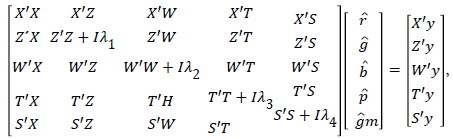
where:
Accuracy was calculated using the following equation:

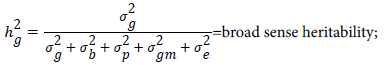
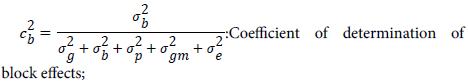
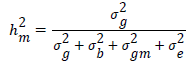
where  =heritability at the average level of genotypes
Selection Index was calculated using the following equation Smith and Hazel [24].
I=b1 × 1+b2 × 2 … bm × m=b’x (6.2)
Where;
Xi=an observation on the i th trait and bi is the selection index coefficient (or weight) for that trait. In vector notation: b’=[ b1, b2 , … , bm] and x’=[ x1 , x2 , … , xm].
Economic Weight: estimated from Statistics of the experimental data and the genetic variation coefficient (CVg%) as a reference, which directly proportional to the available genetic variance, which express the proportionality between the characters and it is dimensionless [25].
Results
Estimation of genetic and phenotypic parameters
The highest coefficients of genetic variation obtained were 14.27%, 17.39%, and 19.49% for fruit size (TFr), number of plagiotropics branches (NRPla) and number of Ortotropicos branches (NRort) respectively indicating the relative importance of these traits for the improvement of these variety (Table 1).
| Parameter | VIG | FER | CER | NROrt | NRPla | APL | DCO | DCA | MAT | TFR | PROD |
|---|---|---|---|---|---|---|---|---|---|---|---|
| Vg | 0.1595* | 0.012 | 0.0388 | 0.6316 | 14.903* | 164.056** | 143.5347* | 3.9513 | 0.1587 | 0.1059 | 28.7462 |
| Vbloc | 0.1462 | 0.0001 | 0 | 0.0162 | 3.8502 | 34.4099 | 85.7669 | 1.042 | 0.0022 | 0.0013 | 18.6498 |
| Vgm | 0.1346 | 0.0231 | 0.0059 | 0.1077 | 14.9043 | 33.4657 | 83.9416 | 3.9513 | 0.0943 | 0.0489 | 119.5791 |
| Vperm | 0.8612 | 0.0006 | 0.0269 | 0.8213 | 28.7705 | 479.9266 | 445.1732 | 3.8842 | 0.0022 | 0.0031 | 23.0217 |
| Ve | 1.2054 | 0.1383 | 0.1328 | 1.0893 | 160.3403 | 111.8152 | 260.4378 | 23.1055 | 0.1584 | 0.0919 | 433.2178 |
| Vf | 2.5068 | 0.1742 | 0.2044 | 2.666 | 222.7696 | 823.6749 | 1018.854 | 35.9344 | 0.4158 | 0.251 | 623.2146 |
| h2g | 0.0636 ± 0.0291 | 0.0690 ± 0.0303 | 0.1897 ± 0.0566 | 0.2369 ± 0.0774 | 0.0669 ± 0.0584 | 0.1992 ± 0.0514 | 0.1409 ± 0.0432 | 0.1100 ± 0.0746 | 0.3817 ± 0.0828 | 0.4217 ± 0.0871 | 0.0461 ± 0.0247 |
| R | 0.4655 | 0.0734 | 0.3216 | 0.551 | 0.2133 | 0.8236 | 0.662 | 0.2471 | 0.3922 | 0.4392 | 0.113 |
| C2bloc | 0.0583 | 0.0008 | 0.0002 | 0.0061 | 0.0173 | 0.0418 | 0.0842 | 0.029 | 0.0052 | 0.0052 | 0.0299 |
| C2gm | 0.0537 | 0.1327 | 0.0288 | 0.0404 | 0.0669 | 0.0406 | 0.0824 | 0.11 | 0.2268 | 0.1948 | 0.1919 |
| C2perm | 0.3436 | 0.0036 | 0.1317 | 0.3081 | 0.1291 | 0.5827 | 0.4369 | 0.1081 | 0.0053 | 0.0122 | 0.0369 |
| CVg(%) | 11.4 | 3.6686 | 9.9271 | 19.498 | 17.395 | 10.737 | 10.006 | 5.714 | 14.1652 | 14.2763 | 11.76 |
| CVe(%) | 23.5 | 26.26 | 19.155 | 36.58 | 45.69 | 12.83 | 16.842 | 19.46 | 11.122 | 9.56 | 125.32 |
| rgmed | 0.5423 | 0.342 | 0.8682 | 0.8544 | 0.5 | 0.8306 | 0.631 | 0.5 | 0.6272 | 0.6841 | 0.1938 |
| Accuracy | 0.252 | 0.417 | 0.4355 | 0.487 | 0.559 | 0.446 | 0.3753 | 0.332 | 0.6178 | 0.649 | 0.215 |
| Mean | 5.7305 | 1.3361 | 2.0309 | 3.635 | 24.734 | 140.4677 | 128.2993 | 24.9249 | 2.5459 | 2.5064 | 23.673 |
Table 1: Estimates of Genetic Parameters for 11 traits of Coffea Robusta evaluated at Oratorios, Minas Gerias. *, **=Significant at 5% , 1%, respectively (t-test), Vg=genotypic variance, Vgm=Variance of progenies × measurement interaction, Vperm=variance of permanents effects, Ve=Residual variance, Vf=phenotypic variance, h2g=broad sense heritability, r=coefficient of individual repeatability, C2gm= coefficient of determination of general combining abilities in pop, C2perm = Coefficient of determination of permanents effects, rgmed=genotypic correlation across the measurements, Vig=Vigor of the plant, Fer = reaction to rust, Cer=reaction to cercospera, NROrt=number of Ortotropics branches, DCA=diameter of stem, MAT=fruit maturity, NRPla=number of plagiotropics branches, Apl=plant height, Dco= canopy diameter, TFr=fruit size, Prod.=production of fruits.
On the other hand, relatively highest residual coefficient of variation (CV%) of 125.32%, 45.688%, 36.578%, 23.50% and 26.269% were observed for yield, number of plagiotropicos branches (NRPla), number of Ortotropicos branches (NRort), Cercospors and Vigor, respectively for Robusta. For Robusta variety, the highest phenotypic variance of 1018.85, 674.9, 623.2146, and 222.7696 were obtained for canopy diameter (Dco), plant height, yield (Sac/ha) and plagiotropicos branches (NRPla), respectively. The genetic correlation across measurements (accuracy) over years (rgmed) ranged from 0.1938 for yield (Sac/ha) to 0.8682 for Cercospora (Table 2).
| Traits | VIG | FER | CER | NROrt | NRPla | APL | DCO | DCA | MAT | TFR | |
|---|---|---|---|---|---|---|---|---|---|---|---|
| PROD | |||||||||||
| VIG | 1 | ||||||||||
| FER | -0.0324 | 1 | |||||||||
| CER | -0.2632 | 0.0156 | 1 | ||||||||
| NROrt | 0.1636 | 0.1984 | 0.0248 | 1 | |||||||
| NRPla | 0.6620* | -0.068 | -0.1607 | 0.1936 | 1 | ||||||
| APL | 0.7329* | -0.114 | -0.1976 | 0.2413 | 0.6728* | 1 | |||||
| DCO | 0.8438* | -0.0718 | -0.2378 | 0.1812 | 0.6404* | 0.8714* | 1 | ||||
| DCA | 0.6485* | -0.2095 | -0.2721 | -0.367* | 0.4879* | 0.6499* | 0.6836* | 1 | |||
| MAT | -0.0541 | -0.1929 | -0.165 | -0.0828 | -0.1928 | -0.1178 | -0.1816 | -0.1499 | 1 | ||
| TFR | -0.1047 | -0.2196 | 0.1522 | -0.0887 | -0.158 | -0.0108 | -0.0539 | -0.0678 | 0.3067* | 1 | |
| PROD | 0.5075* | 0.116 | -0.0862 | -0.0342 | 0.4717* | 0.4222* | 0.5231* | 0.5553* | -0.1329 | 0.0548 | 1 |
| Eco. Wt | 0.1494 | 0.0341 | -0.0254 | -0.0101 | 0.1388 | 0.1243 | 0.154 | 0.1635 | -0.0391 | 0.0161 | 0.2944 |
Table 2: Genotypic correlations and economic weight of the linear selection index and direction of selection for the variables. **=significance at 1% and *=significance at 5% (t-test), Vig=vigor of the plant, NProd=Record of Production of fruits, Fer=reaction to rust, Cer =reaction to cercospera, NROrt=number of Ortotropicos branches, NRPla=number of plagiotropicos branches, Apl=plant height, DCO=Canopy diameter, TFR=fruit size, Prod.=production of fruits, DCA=diameter of stem, MAT=fruit maturity. Eco Wt=Economic weight.
The most important function of heritability in the genetic studies on the metric characters, according to Falconer [26], is its predictive capacity and the expression of the confidence of the phenotypic values as a guide for the genetic value. However, in this study the estimates of individual heritability in the broad sense (h2g) were of low magnitude, but were significant for all traits except yield (Sac/ha). Rodrigues et al. [27] also found similar results for Coffea arabica . The estimated repeatability for most of the traits was lowest indicating the irregularity of the superiority of the individuals among the measurements for these characters showing high irregularity of the performance across measurement, which demonstrate that genotype selection based on those traits is not reliable strategy. The progress expected with the selection depends on the heritability of the character, intensity of selection and phenotypic standard deviation of the character [28]. Thus, the values of heritability and repeatability achieved in this study allow the prediction of better possibilities of genetic gain (Table 1). This also implies that the selection process also provide satisfactory results for all traits (except yield and cercospore) which are economically important characters for Coffea canephora species.
Correlation among traits
The study of correlation provide the information that how strong traits are genetically associated with one other. Thus through the estimate of genotypic and phenotypic correlation among yield components, it paved the basis for selection of superior genotypes from the diverse breeding populations. Therefore, the present study was undertaken to find association of different characters of Coffea canephora , Robusta and Conilon varieties. Correlation among 11 traits was studied using 52 genotypes of Robusta varieties (Table 2).
Correlation between yield and other plant traits were computed. Esther et al. [29] also found the interrelation of yield with most of the vegetative and reproductive plant parts in Coffea canephora . Positive correlations were observed between plant height and stem diameter, plant height and number of plagiotropic branches and stem diameter and number of plagiotropic branches. Freitas [30] reports correlations between stem diameter and plant height, number of branches, length of primary branches and number of internodes for arabica coffee. Similarly, Miranda et al. [31] found correlations between yield and vegetative traits for crosses between Yellow Catuaí and Timor Hybrid and concluded that the vegetative attributes that contributed most to increased productivity were the length of plagiotropic branches, plant height and stem diameter.
For Robusta variety, yield was positively and significantly correlated with vigor, NRPLa, APL, DCO and DCA, which suggests that yield per plant would increase with these characters. Sureshkumar et al. [32] also reported similar results in Coffea canephora . It is also observed that correlation between NRort and DCA was significant but negative suggesting that there is a negative genetic influence involved in the relationships of these variables. Thus, selection for higher NRort will directly select against DCA. On the other hand, Plant vigor was positively and significantly associated with NRPla, APL, DCO and yield indicating that vigorous of plants expressed in these traits. Montagnon et al. [33] noted that for young tree Robusta coffee, vigor was best correlated to competition effects, i.e., vigorous clones were more aggressive than others. Aggressiveness of clones is reflected either in completion for their neighbor and or stimulating or promoting yield [33]. Similarly, Leroy et al. [34] reported that more vigorous young plant reflected high yields of Robusta coffee. Generally, fruit maturity showed negative association with most of the traits for both varieties indicating earliness of the varieties.
Simultaneous selection of characters and mean performances
Using REML/BLUP, the selection gains (SG) can be obtained directly from the BLUP predictions of the progenies, since these reflect the estimated genotypic values already adjusted to the fixed environmental effects. In percentages, the SG ranged from 15.39% to 6.60% among agronomic traits based on the selection intensity of the best 20% (Tables 2 and 3). The response due to index selection was largest for 1018 and 4021 and lowest for 401 and 4022 genotypes. Moreover, 50% of genotypes accounted for more than 40% of total advance.
| Genotype | Genetic value | Index | Gain | Gain% | ||||||||||
|---|---|---|---|---|---|---|---|---|---|---|---|---|---|---|
| VIG | FER | CER | NROrt | NRPla | APL | DCO | DCA | MAT | TFR | PROD | ||||
| 1018 | 6.09 | 1.27 | 1.65 | 2.62 | 27.49 | 159.2 | 148.39 | 27.74 | 2.89 | 2.42 | 33.1 | 16.05 | 16.05 | 15.39 |
| 4021 | 5.94 | 1.37 | 2.47 | 3.83 | 28.86 | 144.29 | 133.46 | 25.75 | 1.92 | 2.72 | 33.6 | 15.71 | 15.88 | 14.15 |
| 1027 | 5.99 | 1.27 | 1.95 | 3.09 | 27.88 | 161.6 | 139.91 | 28.03 | 2.08 | 2.19 | 26.93 | 15.16 | 15.64 | 12.43 |
| 408 | 6.19 | 1.24 | 1.84 | 3.33 | 27.68 | 157.63 | 146.57 | 26.54 | 2.87 | 2.88 | 23.88 | 15.01 | 15.48 | 11.3 |
| 4027 | 5.99 | 1.33 | 2.01 | 3.94 | 25.19 | 145.83 | 136.34 | 26.18 | 2.06 | 2.78 | 26.03 | 14.68 | 15.32 | 10.14 |
| 4019 | 6.1 | 1.34 | 1.96 | 4.15 | 27.47 | 153.03 | 141.6 | 25.79 | 1.67 | 1.96 | 24.15 | 14.61 | 15.2 | 9.29 |
| 4031 | 5.88 | 1.31 | 2.02 | 3.12 | 25.67 | 140.98 | 127.54 | 25.79 | 2.88 | 2.51 | 25.84 | 14.5 | 15.1 | 8.57 |
| 106 | 5.84 | 1.66 | 1.9 | 4.63 | 25.43 | 146.9 | 135.57 | 24.82 | 1.93 | 2.16 | 28.82 | 14.41 | 15.02 | 7.94 |
| 4024 | 5.99 | 1.42 | 2.29 | 3.22 | 24.61 | 154.59 | 142.28 | 25.72 | 2.51 | 2.29 | 24.83 | 14.4 | 14.95 | 7.46 |
| 401 | 5.81 | 1.31 | 2.02 | 3.56 | 25.14 | 140.64 | 130.06 | 25.31 | 2.29 | 2.5 | 25.67 | 14.31 | 14.88 | 6.99 |
| 4022 | 5.92 | 1.3 | 1.88 | 3.48 | 25.74 | 143.24 | 133.46 | 25.61 | 2.37 | 2.48 | 23.5 | 14.29 | 14.83 | 6.6 |
Table 3: Genotypic values and linear selection index for clones of Coffea canephora, Var. Robusta. Vig=vigor of the plant, Ferr=reaction to rust, Cer=reaction to cercospera, NROrt=number of Ortotropicos branches, NRPla=number of plagiotropicos branches, APL=plant height, DCO=Canopy diameter, DCA=diameter of stem, MAT=fruit maturity, TFR=fruit size, Prod.=production of fruits.
When expected gains were computed as percentage of the means, genotypes responded less to selection using index. It was observed that the SGs was positive and high gains from selection indicating the great potential of improvement expected for this variety. The lower gains in the desired direction for clones 306 and 4022 was explained by the negative genetic association between the agronomic traits. However, the negative genetic correlation does not necessarily imply that progenies combining good agronomic performances cannot be obtained. Since this correlation is determined by the action of linked genes, success in simultaneous selection could be achieved by evaluating a larger number of traits to raise the chances of finding promising recombinant genotypes within the population.
Discussion and Conclusion
Generally, the low the genetic coefficient of variation, characterizes the existence of low genetic variability between genotypes, showing that the greater part of the total variation is due to non-genetic parameters. Resende et al. [20] reported similar results for Coffea arabica . The high and very high values of CV% observed here are partly due to the ample variation for these traits in the treatments, above all these traits also seems to be very influenced by the environment which may have contributed to high CV%. According to these results, generally there was low interaction with year, as observed by the genotypic correlation across measurement (rgmed) for most of the characters evaluated, demonstrated that selection can be performed at any of the development stages used for measurement.
Since the environmental variance obtained in this study was low in relation to phenotypic variance, it can be concluded that genotypes with better yield will have the same response at each season while maintaining predictability in the face of environmental variations. However, the genotypic correlation across the measurement was low for yield (sac/ha). As the environment has strong influence on productivity, the highest coefficient of variation was obtained implying that experimental precision in different harvests was very poor. Similarly, low selective accuracy (r=0.1130) showed that there was weak relationship between predicted and actual values. In contrary to this, Resende and Duarte obtained high selective accuracy for Coffea arabica which results in surety in the selection of agronomically superior genotypes. This statistic was preferred to the experimental variation coefficient, because it does not only relies on the magnitude of the residual variance and number of replications, but also on the proportion between the genetic variations and residual nature associated with the character under question.
The repeatability represents the maximum value that heritability may achieve in the broad sense, since the genotypic variance used to estimate the repeatability is not only of genetic origin, but still masked by the variance components of the permanent environment and among individuals. The study of correlation among yield and yield contributing traits suggests that Vigor, DCO, DCA and TFR were the most important characters which possessed positive association with yield. Therefore, these characters could be utilized in breeding program to improve varieties for higher yield. Positive correlations were also observed between most vegetative characteristics and productivity. This shows that plants that have good initial development can provide good yields. Silvarolla et al. [35] found a correlation between productivity and vegetative characters for Timor Hybrid. On the average of four harvests, the authors obtained a high phenotypic correlation of productivity gained by plant height and canopy diameter. Carvalho et al. [36] reported that yield showed higher correlation with the number of plagiotropic branches, plant height and length of plagiotropic branches for Coffea arabica Timor Hibrid.
Acknowledgements
My special thanks go to Third World Academy of Sciences (TWAS)- Italy and Conselho Nacional de Desenvolvimento Cientifico e Technologico (CNPq)-Brazil, for the financial support.
References
- Coste R, Coffee C (1989) Editions Maisonneuve GP & Larose and Agency for Cultural and Technical Cooperation, Paris, p: 373.
- Maurin O, Davis PA, Chester M, Mvung EF, Jaufeerally Fakim Y, et al. (2007) Towards a phylogeny for Coffee (Rubiaceae): Identifying well-supported lingeages based on nuclear and plastid DNA aequences. Annals of Botany 100: 1-19.
- Gichimu BM, Omondi CO (2010) Morphological Characterization of Five Newly developed lines of Arabica coffee as compared to commercial cultivats in Kenya. International Journal of Palnt Breeding and Genetics 4: 238-246.
- Cubry P, Musoli P, Legnate H, Pot D, de Bellis F, et al. (2008) Diversity in coffee assessed with SSR markers: Structure of the genus Coffea and perspectives for breeding. Genome 51: 50-63.
- Prakash NS, Combes M, Dussert S (2005) Analysis of genetic diversity in Indian Robusta coffee gene pool (Coffea canephora) in comparison with a representative core collection using SSR and AFLPs. Genet Res Crop Evol 52: 333-343.
- De Vienne D, Santoni S, Falque M (2003)Â Principal Sources of Molecular Markers. In: Molecular Markers in Plant Genetics and Biotechnology, Vienne DD (ed.). Science Publishers Inc., Plymouth, UK, pp: 3-41.
- Beer SC, Goffreda J, Phillips TD, Murphy JP, Sorrells ME (1993) Assessment of genetic variation in Arena sterilis using morphological traits, isozymes and RFLPs. Crop Sci 33: 1386-1393.
- Sera T (2001) Coffee genetic breeding at IAPAR. Crop Breeding and Applied Biotechnology 1: 179-200.
- Resende MDV (2001) Estimativas de parâmetros genéticos e predição de valores genotÃpicos no melhoramento do cafeeiro pelo procedimento REML/BLUP. Bragantia 60: 185-193.
- Oliveira EJ, Santos VS, Lima DS, Machado MD, Lucena RS, et al. (2008) Selection of progenies of yellow passion fruit based on multivariate indices. Brazilian Agricultural Research 43: 1543-1549.
- Petek MR, Sera T (2008) Fonseca Prediction of genetic values in the selection to obtain coffee cultivars more resistant to rust. Bragantia 67: 133-140.2008.
- Sampaio PTB, Resende MDV, Araujo AJ (2002) Estimates of genetic parameters and selection methods for the genetic improvement of Pinus ocarpa Schiede. Brazilian Agricultural Research 37: 625-636.
- Olivera ACB, Pereira AA, Silva FL, Resende JC, Botelho CE, et al. (2011) Prediction of genetic gains from selection in Arabica coffee progênies. Crop Breeding and Applied Biotechnology 2: 106-113.
- Falconer DS, Mackay Trudy FC (1996) Introduction to quantitative genetics. Harlow, UK, Longman Group, p: 464.
- Yates F (1937) The Design and Analysis of Factorial Experiments. Imperial Bureau of Soil Sciences, Tech. Comm No 35.
- Henderson CR (1974) Best linear unbiased estimation and prediction under a selection model. Biometrics 31: 423-447.
- Henderson CR (1963) Selection index and expected genetic advance. In: Statistical Genetics and Plant Breeding, Nat Acad Sci, Nat Res Council, Publication 982, Washington, DC. USA, pp: 141-163.
- Bernardo R (2002) Breeding for quantitative traits in Plants. Stemma Press, Woodbury, p: 369.
- Resende MDV (2002) Biometric and statistical genetics in the improvement of perennial plants. Colombo: Embrapa Forest; BrasÃlia: Technological Information, p: 975.
- Resende MDV (2008) Software SELEGEN-REML/BLUP. Version 2. Colombo, EMBRAPA.
- Duarte JB, Vencovsky R (2001) Estimation and prediction by mixed linear model with emphasis on the ordering of genetic treatment means. Scientia Agricola 58: 109-117.
- Ramalho MAP, Carvalo BL, Nunes JAR (2003) Perspectives for the use of quantitative genetics in breeding of autogamous plants. ISRN Genetics.
- Hazel LN (1943) The genetic basis for constructing selection indexes. Genetics 28: 476-490.
- Cruz CD, Vencovsky R, Silva SO, Tosello GA (1993) Comparison of gains from selection among corn progenies, based on different criteria. Rev Bras Genet 16: 79-89.
- Falconer DS (1960) Introduction to quantitative genetics. Longmans, London.
- Rodrigues WP, Vieira HD, Barbora DH, Souza Filho GR (2013) Adaptability and genotipic stability of Coffea arabica genoptypes based on REML/BLUP analysis in Rio Janeiro state, Brazil. Genet Mol Res 12: 2391-2399.
- Cruz CD, Carneiro PCS (2004) Biometric templates applied to breeding. Biometric Models Applied to Genetic Improvement. Publisher of the Federal University of Viçosa, Viçosa MG, Brazil.
- Anim Kwapong E, Boamah A (2010) Genetic and environmental correlations between bean yield and agronomic traits in Coffea canephora. Journal of Plant Breeding and Crop Science 2: 064-072.
- Freitas ZMTS (2004) Phenological characteristics of coffee trees (Coffea arabica L.) after planting in the Agreste of Pernambuco. Doctoral thesis. Federal University of Lavras, Lavras, p: 52.    Â
- Miranda JM, Perecin D, Pereira AA (2005) Productivity and resistance to coffee rust (Hemileia vastatrix Berk Et Br) Of F5 progenies of Yellow Catuaà with the Timor Hybrid. Science and Agrotechnology 29: 1195-1200.
- Sureshkumar VB, Nikhila KR, Prakash NS, Mohanan KV (2013) Interrelationship and Association of Characters in Robusta Coffee (Coffea Canephora Var. Robusta). Agriculture, Forestry and Fisheries 2: 98-104.
- Montagnon C, Flori A, Cilas C (2001) A new method to assess competition in coffee clonal traits with single tree in Cote’d’ Ivoire. Agron J 93: 227-231.
- Leroy T, Montagnon CA, Charrier A, Eskes AB (1997) Reciprocal recurrent selection applied to Coffea canephora Pierre. II. Genetic gains and results of first cycle in intergroup crosses. Euphytica 95: 337-354.
- Silvarolla MB, Guerreiro Filho O, Lima MMA, Fazuoli LC (1997) Evaluation of progenies derived from the Timor Hybrid with resistance to the rust agent. Bragantia 56: 47-58.
- Carvalho AM, Mendes ANG, Carvalho GR, Botelho CE (2010) Correlation between growth and productivity of coffee cultivars in different regions of Minas Gerais, Brazil. Pesq Agropec Bras 45: 269-275.  Â
Citation: Bikila BA, Sakiyama NS (2017) Estimation of Genetic Parameters in Coffea canephora Var. Robusta. Adv Crop Sci Tech 5: 310. DOI: 10.4172/2329-8863.1000310
Copyright: © 2017 Bikila BA, et al. This is an open-access article distributed under the terms of the Creative Commons Attribution License, which permits unrestricted use, distribution, and reproduction in any medium, provided the original author and source are credited.
Select your language of interest to view the total content in your interested language
Share This Article
Recommended Journals
Open Access Journals
Article Tools
Article Usage
- Total views: 6446
- [From(publication date): 0-2017 - Dec 15, 2025]
- Breakdown by view type
- HTML page views: 5410
- PDF downloads: 1036