Review Article Open Access
Monitoring Coastal Erosion by Using Wave Spectrum in the Case of Constructions of Small Islands Offshore Songkhla Coast
Charn Khetchaturat1, Chucheep Wongsupap2, Somporn Chuai-aree3, Anucha Srerungla4 and Wattana Kanbua4*1Department of Mathematics, Faculty of Science, Kasetsart University, Bangkok, Thailand
2School of Engineering and Technology, Asian Institute of Technology, Pathumthani, Thailand
3Department of Mathematics and Computer Science, Faculty of Science and Technology, Prince of Songkhla University, Pattani, Thailand
4Thai Meteorological Department, Marine Meteorological Center, Bangkok 10260, Thailand
- *Corresponding Author:
- Wattana Kanbua
Thai Meteorological Department
Marine Meteorological Center, Bangkok, Thailand
Tel: +66-2-3994561
Fax: +66-2-3669375
E-mail: watt_kan@yahoo.com
Received date: June 13, 2013; Accepted date: February 04, 2014; Published date: February 10, 2014
Citation: Khetchaturat C, Wongsupap C, Chuai-aree S, Srerungla A, Kanbua W (2014) Monitoring Coastal Erosion by Using Wave Spectrum in the Case of Constructions of Small Islands Offshore Songkhla Coast. J Marine Sci Res Dev 4:146. doi:10.4172/2155-9910.1000146
Copyright: © 2014 Khetchaturat C. This is an open-access article distributed under the terms of the Creative Commons Attribution License, which permits unrestricted use, distribution, and reproduction in any medium, provided the original author and source are credited.
Visit for more related articles at Journal of Marine Science: Research & Development
Abstract
Waves are the main factor inducing coastal erosion. The main objectives of this study are to investigate coastal
erosion by using artificial winds which blow from the east. The wind speed increased from ascending starting from 5
m/s to 20 m/s. Wave spectrum is used for this purpose. Wave spectrum output was taken by different wind speeds.
The wave spectra refraction patterns are modeled from WAM-cycle4 model. The simulations of model were used
to model the wave spectrum along the shoreline. The results show that the wave spectra extracted from ocean
wave model which resolution is 0.017×0.017 degree latitude/longitude grid over the area of interest. The area that
we study is an embayment shoreline which the wave energy is dispersed along the lines of equivalent depth. That
means the coastal erosion in this area does not have much effect by the wave spectrum. Using WAM-cycle4 model
shows that there is no significant difference of the wave spectrum at the shoreline before and after adding the
constructions into grid experiment on domain of ocean wave model, so the constructions in distance of 20 km, from
shoreline of Songkhla should not cause more erosion to shoreline.
Keywords
Coastal erosion; Ocean wave modeling; Shallow water; WAM-cycle; Wave spectra
Introduction
Ocean waves are produced by the wind. The faster the wind, the longer the wind blows, and the bigger the area over which the wind blows, the bigger the waves. In designing ships or offshore structures we wish to know the biggest waves produced by a given wind speed. Suppose the wind blows at 20 m/s for many days over a large area of the North Atlantic [1-5]. What will be the spectrum of ocean waves at the downwind side of the area? It is important to realize that the spectra presented in the section are attempts to describe the ocean wave spectra in very special conditions, namely the conditions after a wind with constant velocity has been blowing for a long time. A typical ocean wave spectrum will be much more complicated and variable. For example it may have two peaks, one from distance swell and the other generated by the local wind. The concept of a wave spectrum can be quite abstract and is described in Waves and the Concept of a Wave Spectrum. The wave spectra information was then used to model shoreline changes by investigating the wave refraction patterns. From these patterns, the volume transport at several locations was estimated. The location of sedimentation and erosion along the shoreline of the gulf of Thailand was estimated. The wave spectra extracted from ocean wave analysis model data showed wavelengths ranging. The main direction of the waves given by the spectra was from the upper Gulf. The wave refraction patterns varied, showing both convergence and divergence, indicating erosion and sedimentation locations, respectively. Finally, the regression model showed that erosion occurred [6-8].
Theory and Related Works
Wave spectra derived from WAM-TMD model, The WAM-model is a third generation wave model which solves the wave transport equation explicitly without any presumptions on the shape of the wave spectrum. It represents the physics of the wave evolution in accordance with our knowledge today for the full set of degrees of freedom of a 2d wave spectrum.
 (1)
(1)
 (2)
(2)
where E is the two-dimensional wave spectrum. The value of E depends on the spatial coordinates x and y, the temporal variable t, the frequency domain f, and the direction domain θ. The parameter  is the group velocity function of variables x, y, f and θ. The Si parameter defines source/sink terms, such as the atmospheric input Sin, the nonlinear wave-wave interaction Snl, thehigh frequency dissipation Sds, and the bottom friction Sbt. The goal is to solve for the time rate of change in E, or the directional spectra in a prescribed gridded system [9].
The bottom may induce wave energy dissipation in various ways: e.g. friction, percolation (water penetrating the bottom) wave induced bottom motion and breaking. Outside the surf zone, bottom friction is usually the most relevant. It is essentially nothing but the effort of the waves to maintain a turbulent boundary layer just above the bottom. Several formulations have been suggested for the bottom friction. A fairly simple expression, in terms of the energy balance is due to JONSWAP project:
 (3)
(3)
Where Γ is an empirically determined co-efficient.
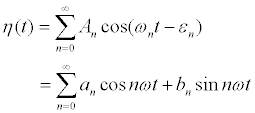
The wave energy spectral density E (f) or simply the wave spectrum may be obtained directly from a continuous time series of the surface η(t). Using a Fourier analysis, the wave profile time trace can be written as an infinite sum of sinusoids of amplitude An, frequency ωn, and relative phase εn, that is
 (4)
(4)
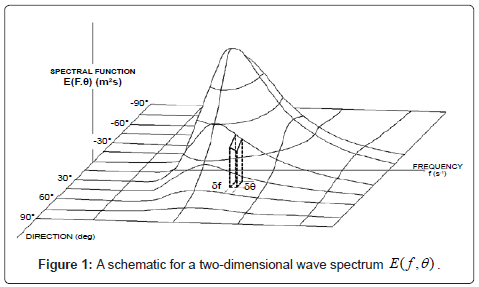
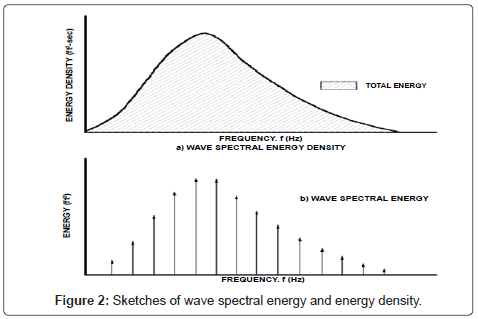
The coefficients an and bn in the above equation may be determined explicitly from the orthogonality properties of circular functions (Figures 1 and 2). Note that a0 is the mean of the record. Because real observations are of finite length, the finite Fourier transform is used and the number of terms in the summation is a finite value.
By an intuitive extension of this simple wave, the variance of a random signal with zero mean may be considered to be made up of contributions with all possible frequencies [10]. We thus can find a random signal as
 (5)
(5)
Where m0 is the zero-th moment of the spectrum. Physically, m0 represents the area under the curve of E(f). The area under the spectral density represents the variance of a random signal whether the onesided or two sided spectrum is used.
The moments of a spectrum can be obtained by
 (6)
(6)
We now use the definition of the variance of a random signal (Equation (5)) to define the significant wave height. As stated earlier, this gives an estimation of the significant wave height using the wave spectrum. For Rayleigh distributed wave heights, Hs may be approximated by
 (7)
(7)
Therefore, the zero-the moment m0, the total area under the wave energy density spectrum, determines the significant wave height for a given E(f).
Experimental
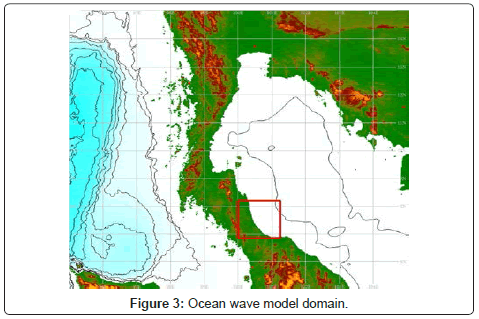
The ocean wave model domain is located in the Gulf of Thailand between latitude 5° N to 15° N and longitude 95° tE to 105° E. Bathymetry grid is taken from ETOPO1 covering the region 95° E to 105° E and 5° N to 15° N (Figure 3) with 0.017° resolution in both latitude and longitude (589×589 grids). The artificial winds were used, with 0.017° resolution and are linearly interpolated to specify wind components at each wave grid point. The artificial wind speed increased from ascending, starting from 5 m/s to 20 m/s. Coastal wave spectrum is calculated along Songkhla coast where the squared amplitudes for each component are plotted against their corresponding frequencies. The wave spectrum is obtained from a measured wave record, which it was calculated. On the horizontal axis, the wave component are represented by their frequencies which using the frequency and energy of waves [11].
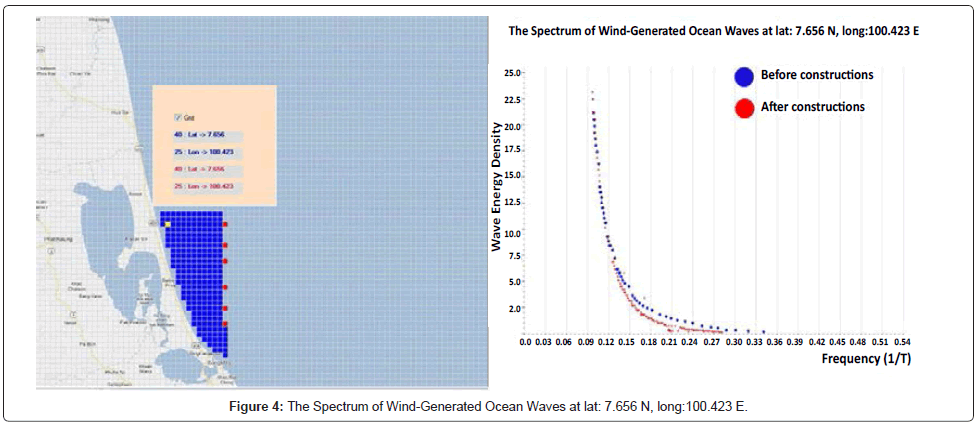
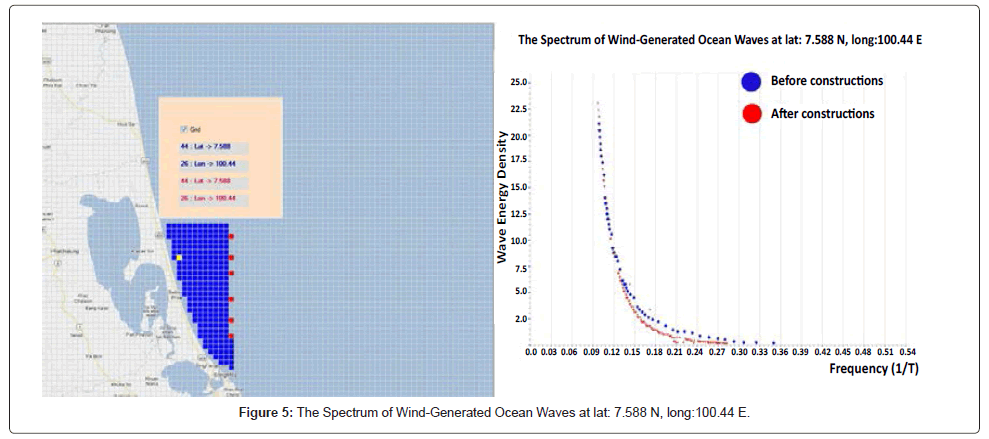
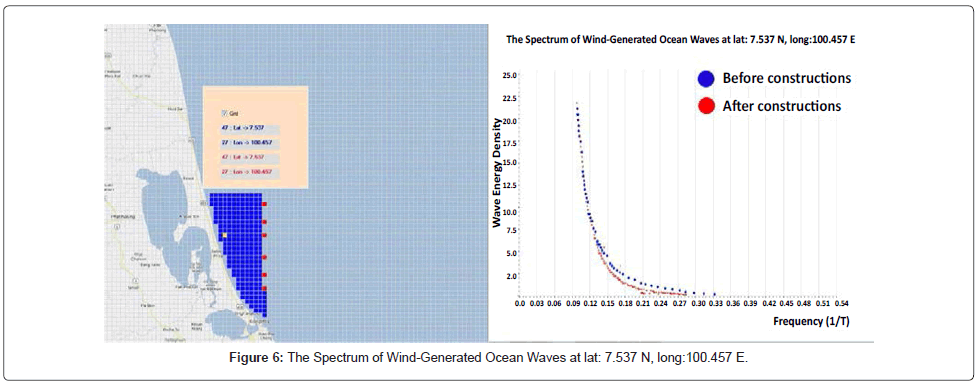
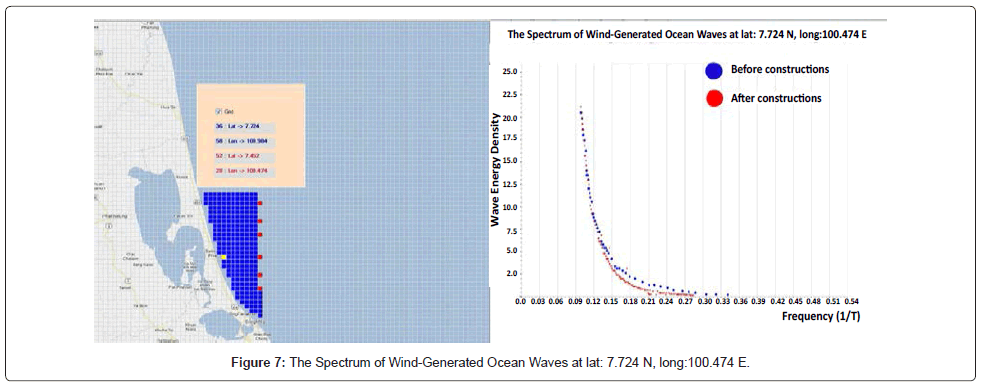
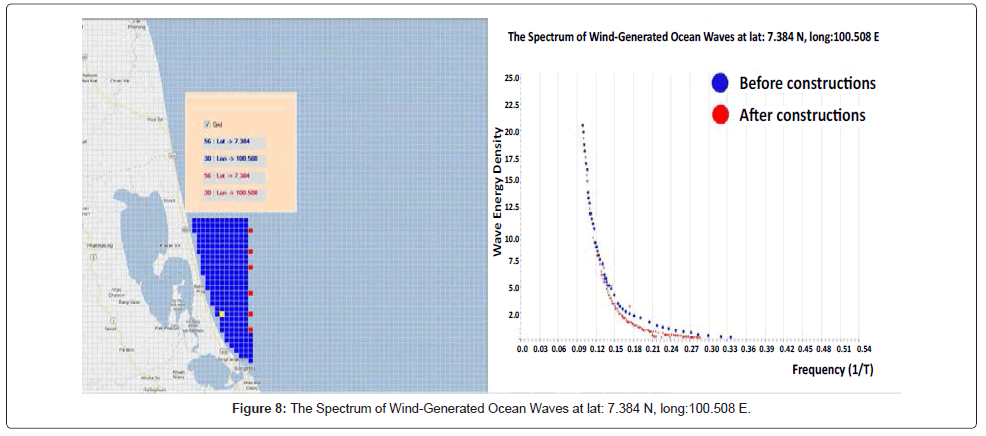
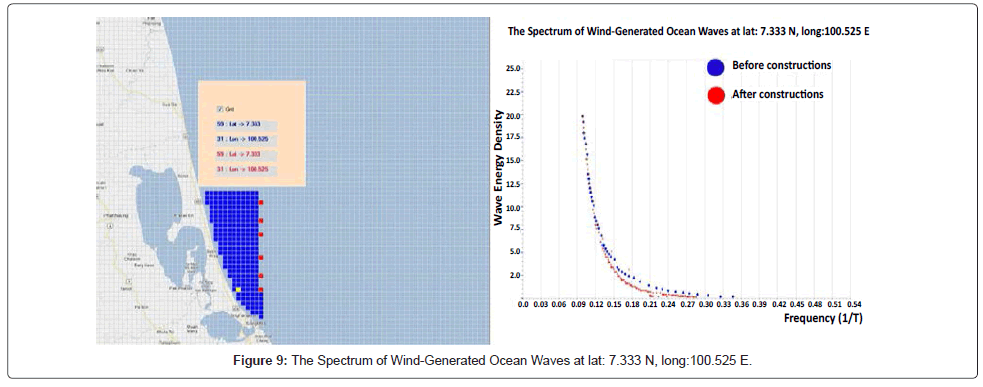
The purpose of this research is to determine whether the strong winds caused large waves against the shoreline and lead to coastal erosion. We assume that the winds blow from the east and the wind speed increased from ascending, starting from 5 m/s to 20 m/s. The study was divided into 2 cases, the first case was simulated waves without any construction in the sea (Figure 4), and the second case, was simulated waves with a row of construction in the sea along the Songkhla coast (Figures 4-9). The red point in figures 4-9 assumes that a small island which diameter is 1.8 km. and distance between each one is 1.8 km. They are located at (lat. 7.656 N, long.100.61 E), (lat.7.588 N, long.100.61 E), (lat. 7.537 N, long.100.61 E), (lat. 7.452 N, long.100.61E), (lat.7.384N, long.100.61E) and (lat.7.333N, long.100.61E). After we set up all parameters mentioned above and had run model. The wave spectrum as the 6 yellow points of along the Songkhla coast in Figures 4-9 was calculated [12,13].
Results and Discussion
Wave spectra peaks have different size and direction at different seasons. The wave spectra peaks normally change its directions along coastline of the east side of southern part of Thailand during the east winds effect along coastline. During the east winds, the erosion events occurred along coastline of the east side of southern part. Due to the wave energy is higher during the east winds and is proportional with square of wave height. This means that the waves are more destructive during the east winds. Anyway, the probability distribution function shows that the erosion of the east winds has no effect on the cycles of shoreline change. This means that the beaches are in an equilibrium state with the nature [14]. Changes caused by the natural forces are usually temporary and beaches could normally recover back to their original state.
In this paper, we add the 1.8 km diameter of constructions to the numerical model, to see how they could affect the shoreline. After we run the numerical model with the artificial winds blow from east to west with the wind speed increased from ascending, starting from 5 m/s to 20 m/s, the 6 points along the shoreline of Songkhla are picked. The wave energy which calculated at the 6 points, are compared between before and after we add the constructions to the model. The results show that the wave spectrum at each point has no significant difference much is shown in Table 1.
| Theposition of calculated thewave spectrum | Wave spectrum | |
|---|---|---|
| Before constructions | After constructions | |
| Lat: 7.656 N, Long:100.423 E | 3.198373 | 3.344456 |
| Lat: 7.588 N, Long:100.440 E | 3.290098 | 3.391262 |
| Lat: 7.537 N, Long:100.457 E | 3.122657 | 3.418713 |
| Lat: 7.724 N, Long:100.474 E | 3.157723 | 3.379919 |
| Lat: 7.384 N, Long:100.508 E | 3.068017 | 3.412305 |
| Lat: 7.333 N, Long:100.525 E | 3.027942 | 3.381261 |
Table 1: The wave spectrum.
Conclusion
The work of this study is linked to the evaluation of coastal processes and to assessing the wider uses of ocean environments, particularly through the use of data incorporated into coastal. For the coastal erosion caused by the wave energy, one of important factor we have to concern about is the bathymetry of the area of interest. In shallow water, waves refract to follow bathymetry, adjusting to travel perpendicular to lines of equivalent depth on the sea floor. The refraction of wave affects the distribution of its energy at the coast. At headlands and point shorelines, wave energy is convergence. In the other hand, wave energy is divergence at coastal embayment and cause less destruction. The area that we study is an embayment shoreline which the wave energy is dispersed along the lines of equivalent depth. That means the coastal erosion in this area does not have much effect by the wave spectrum. Using the numerical ocean wave model shows that there are no significant difference of the wave spectrum at the shoreline before and after adding the constructions into grid experiment on domain of ocean wave model, so the constructions in distance of 20 km. from shoreline of Songkhla should not cause more erosion to shoreline.
Acknowledgement
I would like to express my sincere gratitude and deep appreciation to Director General of Thai Meteorological Department for guidance, invaluable advice, supervision and encouragement throughout this research which enabled me to complete this research successfully. He was never lacking in kindness and support.
References
- Kanbua W, Supharatid S, Tang I (2005) Ocean wave forecasting in the Gulf of Thailand during typhoon Linda 1997: Hard and soft computing approaches. Journal of Atmospheric and Ocean Science 10: 145–161.
- Kanbua W, Chuai-Aree S (2005) Virtual Wave: An Algorithm for Visualization of Ocean Wave Forecast in the Gulf of Thailand. KMITL Science Journal 5: 140-150.
- W. Kanbua, I Ming Tang, B. Wiwatanapataphee (2001) A study on ocean wave forecasting from typhoon LINDA using WAM model, Proceeding of the 5th annual national symposium on computational science and engineering (ANSCSE5), Bangkok Conventional Center, Central Plaza, Bangkok, Thailand.
- Gunther H,Hasselmann K, PAE Janssen (1992) Report NO 4, The WAM Model Cycle 4, Edited by Modellberatungsgruppe, Hamburg Germany.
- Hasselmann K (1962) On the nonlinear energy transfer in a gravity-wave spectrum. General theory, JFM 12: 481-500.
- Komar PD (1979) Beach processes and sedimentation. Prentice-Hall, New Jersey, USA.
- LukmanMH, Rosman, SSand (1995) Beach Erosion Variability during a North-east Monsoon: The Kuala SetiuCoastine. Terengganu, Malaysia. J Pertanika 3: 337-348.
- Maged MM,IbrahimMM, IbarhimZ (1997) ERS-1 AND Wave Refraction Modeling in the South China Sea. Paper Presented in International Marine Science Conference Assessment and Monitoring of Marine System, Malaysia.
- MasrturaS (1987) Coastal Geomorphology of desaru and its Implication for costal Zone management. University Kebangasan, Malaysia.
- Mazlan HI, Aziz Abdullah (1989) Preliminary Evaluation of Photogrammetric-remote sensing Approach in Monitoring Shoreline Erosion Proceeding of the Tenth Asian Conference on Remote Sensing. Kuala Lumpur, Malaysia.
- Raj JK (1982) Net Direction and Rates of Present-day Beach Sediment Transport by Littoral Drift along the East Coast of Peninsular Malaysia. Geol. Soc. Malaysia bull 1557-82.
- Stanley consultants Inc.(1985) Malaysia National Coastal Erosion Study, Kuala Lumpur, Malaysia.
- Vachon PW, KE Haroba, JScott (1994) Airborne and Space borne Synthetic Aperture Radar Observation of ocean waves. J Atmo-ocean 32: 83-112.
- Wong PP (1981) Beach change on a monsoon coast, Peninsular Malaysia JGeolSoc14:47-59.
Relevant Topics
- Algal Blooms
- Blue Carbon Sequestration
- Brackish Water
- Catfish
- Coral Bleaching
- Coral Reefs
- Deep Sea Fish
- Deep Sea Mining
- Ichthyoplankton
- Mangrove Ecosystem
- Marine Engineering
- Marine Fisheries
- Marine Mammal Research
- Marine Microbiome Analysis
- Marine Pollution
- Marine Reptiles
- Marine Science
- Ocean Currents
- Photoendosymbiosis
- Reef Biology
- Sea Food
- Sea Grass
- Sea Transportation
- Seaweed
Recommended Journals
Article Tools
Article Usage
- Total views: 15963
- [From(publication date):
July-2014 - Aug 17, 2025] - Breakdown by view type
- HTML page views : 11280
- PDF downloads : 4683

