Research Article Open Access
Biological, Technical, and Financial Feasibilities Study of Zero Water Discharge (ZWD) System Application in Low Salinity White Shrimp (Litopenaeus vannamei Boone) Urban Aquaculture, Study Case: Gresik District, East Java, Indonesia
Muhammad H1, Situmorang ML2, Djohan YA2, Aditiawati P2 and Suantika G2*1Department of Biomanagement, School of Life Sciences and Technology, Indonesia
2Institute Teknologi Bandung (ITB), Jalan Ganesha No. 10 Bandung 40132, Microbial Biotechnology Research Group, School of Life Sciences and Technology, Indonesia
- *Corresponding Author:
- Suantika G
Institute Teknologi Bandung (ITB)
Jalan Ganesha No. 10 Bandung 40132 Indonesia
Microbial Biotechnology Research Group
School of Life Sciences and Technology, Indonesia
Tel: +62-22-2500935
E-mail: gsuantika@sith.itb.ac.id1
Received Date: June 30, 2016; Accepted Date: July 15, 2016; Published Date: July 30, 2016
Citation: Muhammad H, Situmorang ML, Djohan YA, Aditiawati P, Suantika G (2016) Biological, Technical, and Financial Feasibilities Study of Zero Water Discharge (ZWD) System Application in Low Salinity White Shrimp (Litopenaeus vannamei Boone) Urban Aquaculture, Study Case: Gresik District, East Java, Indonesia. J Fisheries Livest Prod 4:197. doi:10.4172/2332-2608.1000197
Copyright: © 2016 Muhammad H, et al. This is an open-access article distributed under the terms of the Creative Commons Attribution License, which permits unrestricted use, distribution, and reproduction in any medium, provided the original author and source are credited.
Visit for more related articles at Journal of Fisheries & Livestock Production
Abstract
The study was aimed to analyze low salinity white shrimp (Litopenaeus vannamei Boone) production feasibility using zero water discharge (ZWD) system. The research was conducted through five constitutive steps: (1) ZWD system installation and white shrimp post-larvae acclimatization to low salinity water (5 ppt), (2) White shrimp cultivation using low salinity ZWD system at three different stocking densities (200 in d/m3, 300 in d/m3, and 400 in d/m3) in 20 m3 ponds, (3) Biological feasibility and water quality analysis, (4) Technical feasibility analysis, and (5) Production scheme development and financial feasibility analysis to produce 1,000 kg shrimp/cycle. The best biological performance was achieved at 400 in d/m3 stocking density with survival rate, feed conversion ratio, specific growth rate and total biomass values of 70.59 ± 6.15%, 1.14 ± 0.14, 4.40 ± 0.25%BW/day, and 44.13 ± 4.44 kg, respectively. The best pH level (7.61- 8.27), DO (4.9-8.5 mg/L), temperature (29.3-30.1°C), NH4 + level (0.0-0.5 mg/L), NO2 - level (0.0-5.0 mg/L), and NO3 - level (5.0-30.0 mg/L) were observed at 200 in d/m3 stocking density. Considering these parameters: water sources, biophysical condition, and land topography, market access and material supplier, the ZWD system was technically feasible for the north-coastal areas of East Java. Production scheme development needed six operational units consisted of (1) purchasing and inventory, (2) water and wastewater treatment, (3) shrimp production, (4) harvesting, (5) transaction and archive, and (6) marketing and distribution. To produce 1,000 kg shrimp/cycle in 70 days culture period, 2-3 human resources and 1,000-1,250 m2 production area were required. Financial analysis showed that ZWD system was feasible at 300 in d/m3 and 400 in d/m3 stocking density, showing positive NPV Rp 47,593,537 and Rp 69,439,955, and IRR value higher than discount factor of 13.40% and 15.49%, respectively. It can be concluded that the implementation of ZWD system for urban shrimp aquaculture production at low salinity (5 ppt) and high stocking density (300 in d/m3 and 400 in d/m3) was biologically, technically, and financially feasible to be applied in Gresik on the north-coastal area of East Java Province, Indonesia.
Keywords
Litopenaeus vannamei Boone; low salinity; Zero Water Discharge; Technical feasibility; financial feasibility; urban aquaculture
Introduction
Aquaculture has become the fastest-growing food sector since last three decades, with an average growth rate around 8.6% each year [1]. Among fishery commodities, shrimp had contributed for the highest transaction value approximately 15% of total transaction value in fishery commodities. In Indonesia, shrimp was considered as one fishery commodity that listed in the top ten main export commodities [2].
Indonesia shrimp production in 2014 was 623.000 metric tons, which was dominated by white shrimp species (Litopenaeus vannamei), with the contribution of up to 69.5% of shrimp total production [3]. The production actually does not ensure the sustainability of the particular industry, because most shrimp farms use conventional culture technology (typically a batch/static or a flow-through system). The existing shrimp rearing strategy that widely applied is still economically profitable for the farmers due to its simplicity and acceptable production cost. However, since the cultivation relies on an outdoor earthen pond with less attention paid to water quality and disease/predation control, it is not surprising that the shrimp production is often unpredictable under this culture condition [4].
The accumulation of harmful substances from uneaten feed and excretion (e.g. ammonium) can exceed the tolerance limits and affect the shrimp productivity in conventional culture system [5]. Besides, the system is considered as not environmentally friendly, because toxic effluent water can pollute the surrounding aquatic environment [4]. In term of space requirement, the system needs large production area and should be closed to coastal area to ensure sea water access. These circumstances will contribute to the inflexibility of shrimp culture and shrimp industry sustainability in the near future. One cultivation strategy, Zero Water Discharge (ZWD) system, was developed to resolve these problems [6,7]. ZWD is an intensive culture technology, which is environmentally friendly as it maintains water quality, therefore prevents pathogen spreading as well as wastewater discharge, that is rich in nutrients, to the environment [8]. The ZWD principle is to limit/reduce water usage, by implementing microbial consortium that recycles nitrogen compound in the culture water, and to clean harmful nitrogen substances before the water is partially or totally reused [6,7]. Based on Suantika et al. [7], by cultivating white shrimp using ZWD system at a laboratory scale, excellent shrimp culture performance reflected by acceptable water quality, 90% survival rate, and low feed conversion ratio (FCR) were obtained. For further development of the system to an industrial scale, research on biological, technical, and financial feasibility needs to be conducted before implementing this low salinity ZWD system in a real aquaculture operation. Therefore, the aim of this current study was to analyze the biological, technical, and financial feasibility of the low salinity white shrimp production using zero water discharge (ZWD) system in an urban, north-coastal area of Gresik, East Java Province, Indonesia.
Materials and Methods
Location and research period
The research was conducted in a small-scale shrimp nursery, UD. Popular, located in Cerme Lor, Gresik, East Java Province, Indonesia. The study carried out for three months (August-October 2015).
Research material
White shrimps larvae were obtained from a commercial hatchery in Situbondo, East Java Province, Indonesia. A pure culture of microorganism consortium consisting microalgae Chaetoceros calcitrans, nitrifying bacteria, and probiotic Bacillus megaterium was obtained and cultured at the Laboratory of Microbiology, School of Life Sciences and Technology, Institut Teknologi Bandung, Indonesia. Microalage C. calcitrans was cultured in Guilard F/2 medium and propagated in NPK-silicate-commercial medium [9]. Nitrifying bacteria was cultured in Winogradsky medium [10], while probiotic bacteria B. megaterium was cultured in a commercial broth medium (Maggi® Indofood, Indonesia) [7].
White shrimp acclimatization
Upon collection, eight days old white shrimps post larvae (PL-8) were stocked in an indoor circular concrete pond (≈20 m3 volume) at the stocking density of 60 PL/L and 33 ppt initial salinity. To acclimatize shrimp PL at low salinity, salinity reduction was conducted at the rate of 3 ppt/day by mean of daily freshwater addition during nine days acclimatization period, until the salinity level decreased to 5 ppt [11]. After acclimatization, the PL-17 was ready for grow out cultivation at low salinity. The schematic overview of shrimp acclimatization process is presented in Figure 1.

Figure 1: Schematic overview of white shrimp culture acclimatization process.
ZWD system installation and conditioning
The installed ZWD system consisted of: (1) rectangular concrete culture pond (6.5 × 2.75 × 0.7 m ≈ 20 m3 volume) filled with low salinity water (±5 ppt); (2) grained CaCO3, as substrate for nitrifying bacteria and pH buffering agent; (3) aeration line (aerator and air stone) for continuous O2 supply at the rate of 90 mL/minute; (4) microalgae C.calcitrans culture, as live feed source for shrimp, nitrate reducer, and shading effect agent for shrimp culture, (6) nitrifying bacteria culture, to perform nitrification reaction, maintaining ammonium and nitrite in culture water at the acceptable level for shrimp culture, (7) B. megaterium, as probiotic bacteria to increase the feed digestibility and shrimp feeding intake [12], (8) feeding tray to administer and control daily feed amount sufficiency, and (9) thermometer, to monitor daily temperature of culture water (Figure 2).

Figure 2: Schematic overview of ZWD system for white shrimp culture (L. vannamei).
Conditioning of ZWD system was started by an initial addition of nitrifying bacteria culture, consisting of ammonium oxidizing bacteria (AOB) and nitrite oxidizing bacteria (NOB) at 0.05% v/v (bacterial density of 107 CFU/mL) and B. megaterium at 0.05% v/v (bacterial density of 107 CFU/mL) at low salinity (5 ppt) culture water. 20 gram of NH4Cl≈1 ppm NH4 + was added as ammonium source for the AOB culture. The ammonium reduction by AOB and nitrite reduction by NOB culture were monitored for five days until ammonium and nitrite level decreased to 0.5 ppm. Afterward, microalgae C. calcitrans was inoculated at 0.05% v/v (algal density of 106 cell/mL).
White shrimp cultivation using ZWD system
PL-17 white shrimp cultivation using ZWD system at low salinity water (5 ppt) was conducted for 70 days in three different stocking densities treatments: (1) stocking density 1: 200 in d/m3, (2) stocking density 2: 300 in d/m3, and (3) stocking density 3: 400 in d/m3. Each treatment was conducted in four replicates. Continuous aeration rate of 47.62-83.33 mL/second was maintained during culture period by mean of six aeration lines (through air diffuser tubing) inside each culture tank. Approximately 2% of total water volume from each tank was siphoned and replaced every day to remove the remaining uneaten feed and shrimp feces. The feeding scheme was modified from Tacon [13]: commercial feed with 40% protein content was delivered five times a day at 06:00, 10:00, 14:00, 18:00 and 23:00. Feed was placed on a feeding tray and monitored frequently to provide information of daily delivered feed accuracy (Table 1). Leftover feed on the tray enables monitoring of shrimp consumption rate, to observe the effect on shrimp size and health condition. Feeding level was adjusted every week based on the measurement of mean body weights and estimation of the shrimp survival and feeding rate. Each parameter contributed and calculated with equation 1:
| Shrimp size (gr) | Feeding rate(% of shrimp biomass) | Feeding tray monitoring intervals (hours) |
|---|---|---|
| <1 | 10 | 3.5 |
| 01-Mar | 7 | 3.5 |
| 03-May | 6.5 | 2.5 |
| 05-Jul | 5.5 | 2 |
| 07-Sep | 5 | 2 |
Table 1: Feeding schedule for white shrimp farming at 25 ± 1°C.
Σ feed (gr) =SD × MBW × FR × SR (1)
SD: stocking density (individual/tank), MBW: mean body weight (gr), SR: survival rate (%), FR: feeding rate (% of shrimp biomass).
Biological feasibility study
Biological feasibility was assessed based on production performance and water quality analysis during cultivation. Production performance considers survival rate (SR), food conversion ratio (FCR), specific growth rate (SGR), total biomass per tank and shrimp size distribution calculation on each treatment.
Survival rate was calculated using equation 2:
SR=Nt/No × 100% (2)
Where, SR: survival rate, No: initial shrimp number, Nt: final shrimp number, t: culture period (day).
Shrimp specific growth rate was calculated using equation 3:
SGR (%/day)=[ln (W2/W1)/(T2-T1)×100] (3)
Where, SGR: specific growth rate, W1: initial body weight (g) at time T1 (day), W2: final body weight (g) T2, after T1 (day)
Several physicochemical water quality parameters including dissolved oxygen (DO), pH, ammonium/NH4 +, nitrite/NO2 - and nitrate/NO3 - concentration, were measured and analysed weekly. DO and pH level were measured using DO meter Hach® 40 qd and pH meter Eutech Instruments, respectively. Ammonium/NH4 +, nitrite/ NO2 - and nitrate/NO3 - concentration were measured using Nessler, diazotitation, and nitrate HCl methods, respectively [14].
Technical feasibility study
Technical feasibility was assessed based on the production site analysis and operational necessities for shrimp production. The distance of production site to water resource, biophysical condition, land topography and structure, materials supply, market location, accessibility and supporting facilities nearby were considered in production site analysis [15]. On the other hand, materials, equipment and facilities required for cultivation were accounted for operational necessities analysis based on their specification and quantity [16].
Production scheme development
Production scheme plan was developed to produce 1,000 kg shrimp biomass/cycle at each stocking density. The scheme was arranged by identification of operational unit needed for shrimp production at industrial scale. Afterwards, a farm layout using low salinity ZWD system was designed based on the culture performance at each stocking density. The production scheme was then developed based on the real condition in shrimp industry during the study period.
Financial feasibility study
The financial feasibility was analysed based on data collected from surveys and experiments. Before being analysed for financial feasibility, all data were projected to produce 1000 kg shrimps/cycle during 10 years production period. The financial feasibility were analysed based on the investment feasibility which determined by using the net present value (NPV), internal rate of return (IRR), and payback period formula [17]. The formulas are described below:
Net present value (NPV):
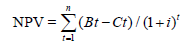 (4)
(4)
Where, Bt: revenue achieve at year t, Ct: production cost spend at year t, i: discount rate (%), t: time (year).
BEP unit produce:
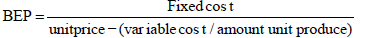 (5)
(5)
Unit price were determined from production cost:
Unit price = (fixed cost + variable cost)/unit produce (6)
Payback period:
PBP = t + [(b-c)/(d-c)] (7)
where, t: year before present value have the same amount of initial investment, b: initial investment, c: revenue in t year, d revenue at t+1 year
Internal rate of return (IRR):
IRR = i1 + (NPV i1 × (i2 – i1))/(NPVi1 – NPVi2) (8)
where, i1: discount factor at initial investment, i2: discount factor where NPV ≤ 0
Statistical analysis
All data were subjected to One-way variance analysis (ANOVA); mean differences between treatments were separated using Duncan Multiple Range Test at P > 0.05, using SPSS version 17.
Result and Discussion
Biological feasibility analysis
Production performance analysis: Production performance which is indicated by several biological parameters during 70 days cultivation at three different stocking densities are presented in Table 2. The highest survival rate of 93.52 ± 3.32% was obtained from the 200 in d/m3 stocking density, followed by 300 in d/m3 stocking density (79.11 ± 5.81%) and 400 in d/m3 stocking density (70.59 ± 6.15%), (p<0.05). The specific growth rate and FCR of all treatments were not significantly different and it ranged between 4.22 ± 0.24%-4.64 ± 0.14% and 1.05 ± 0.07-1.14 ± 0.14, respectively. Different densities among treatments affected significantly the total shrimp biomass harvested at the end of production period. The highest total biomass of 44.13 ± 4.44 kg was obtained from 400 in d/m3 stocking density, followed by 300 in d/m3 (36.25 ± 3.01 kg) and 200 in d/m3 stocking densities (27.75 ± 1.55 kg) (p<0.05).
| Parameters | Stocking densities (ind/m3) | |||
|---|---|---|---|---|
| 200 | 300 | 400 | ||
| SR (%) | 93.52 ± 3.32a | 79.11 ± 5.81b | 70.59 ± 6.15b | |
| SGR (%) | 4.64 ± 0.14a | 4.22 ± 0.24a | 4.40 ± 0.25a | |
| FCR | 1.05 ± 0.07a | 1.06 ± 0.08a | 1.14 ± 0.14a | |
| Total Biomass (kg) | 27.7 ± 1.55a | 36.25 ± 3.01b | 44.13 ± 4.44c | |
| Size Distribution (%) | 100-150 ind/kg | 86.77a | 91.93ab | 95.85b |
| 150-250 ind/kg | 13.23a | 8.07ab | 4.15b | |
| *Means of values with same superscript along rows are significantly different (p<0.05). | ||||
Table 2: White shrimp production performances of ZWD system among treatments.
By stocking shrimp at a higher density, higher percentage of shrimps which sized between 100-150 shrimps/kg was also harvested. Proportion of harvested shrimp with size distribution between 100- 150 shrimps/kg at 400, 300, 200 in d/m3 stocking densities was 95.85%, 91.93%, 86.77%, respectively. In contrast, higher percentage of shrimps with lower size distribution (150-250 shrimps/kg) was obtained at a lower stocking density (Table 3).
| Parameter | ZWD System (5 Rpt salinity) | Conventional System | ||||
|---|---|---|---|---|---|---|
| 5 Rpt salinity [23] | Intensive[24] | Intensive[25] | ||||
| Stocking Density (ind/m3) | 200 | 300 | 400 | 60 | 99 | 300 |
| SR (%) | 93.52 | 79.11 | 70.59 | 85 | 81 | 81 |
| FCR | 1.05 | 1.06 | 1.14 | 1.3 | 1.37 | 1.6 |
| Production period (day) | 70 | 70 | 70 | 100 | 120 | 120 |
| Harvest Size (ind/kg) | 100 | 100 | 100 | 40 | 50 | 50 |
| Productivity (kg/m2) | 1.39 | 1.81 | 2.21 | 1.47 | 1.72 | 2 |
Table 3: Performance comparison of ZWD and conventional shrimp culture systems.
It is shown that the higher stocking density (300 in d/m3 and 400 in d/m3) produced significantly lower survival rate compared to the low stocking density (200 in d/m3) (Table 4). This is attributable to the environmental stress due to space competition and crowded effect caused by the high shrimp population present [18,19]. It has been suggested that competition increases cannibalistic behavior of shrimps, particularly during the molting period [20,21]. Besides, high stocking density causes higher risk of water quality deterioration, pathogen spreading, and cannibalism due to competition for food and space [19]. Although high stocking densities resulted in decreased survival rates, a more homogenous niche occupancy could have been obtained and hence the more homogenous feed access chance may have allowed the survived shrimp to reach a higher final body weight at the end of the culture period [22]. No significant differences in FCR value were observed between the high and low stocking densities, indicating that the feed conversion efficiency was still acceptable at high stocking densities, despite their lower survival rates.
| Parameter | SD1(200 ind/m3) | SD2(300 ind/m3) | SD3(400 ind/m3) | Range Tolerance |
|---|---|---|---|---|
| pH | 7.61-8.27 | 7.71-8.36 | 7.27-8.38 | 6.5-8.3 [30] |
| DO (mg/L) | 4.90-8.50 | 5.00-8.00 | 5.60-7.80 | >4 mg/L[31] |
| Temperature (°C) | 29.3-30.1 | 29.8-30.1 | 30.4-30.9 | 24-32°C [31] |
| NH4 + (mg/L) | 0-0.5 | 0-3.0 | 0-3.0 | =3.95 mg/L[5] |
| NO2 -(mg/L) | 0-5.0 | 0.2-3.0 | 0.2-5.0 | =25.7 mg/L[26] |
| NO3 -(mg/L) | 5.0-35.0 | 5.0-30.0 | 5.0-25.0 | =232 mg/L[27] |
Table 4: Water quality parameters of experimental units during 70 days culture period.
In general all biological parameters were in the acceptable condition for shrimp production. All treatments resulted in survival rate of 70-93% and productivities of 1.39-2.21 kg/m3 within 70 days culture period, which were comparable to an intensive conventional culture method in Indonesia (average survival rate of 81% and productivity of 1.72-2.0 kg/m3 within 100-120 days culture period at a stocking density of 60-300 in d/m3) [23-25]. Based on the following comparison between ZWD system and conventional system performances (Table 3), the use of ZWD system in all stocking densities was biologically feasible.
Water quality parameter analysis: Several culture physicochemical parameters measured during 70-day-culture period are presented in Table 4. In general, there were no significant difference on water quality measured among treatments (p>0.05). Acceptable water quality parameters were obtained among treatments during 70 days culture period. Temperature, dissolved oxygen, pH level, ammonium (NH4 +-N), nitrite (NO2 --N), and nitrate (NO3 --N) were ranged between 29.3-30.9°C, 4.90-8.50 mg/L, 7.27-8.38, 0–3.0 mg/L, 0.2–5.0, and 5.0- 35.0 mg/L, respectively. The ammonium (≤3.95 mg/L), nitrite (≤25.7 mg/L), nitrate (≤232 mg/L) concentration was still within tolerance range of hite shrimp culture [5,26,27]. The similar values of most water quality parameters, especially pH level and ammonium, nitrite and nitrate concentration between treatments were attributable to the use of ZWD system for all stocking densities, which emphasizes on the nutrient (carbon and nitrogen) cycle manipulation [7]. In this system, ammonium produced from organic decomposition by heterotrophic bacteria, such as added B. megaterium inoculum, can be directly converted to nitrite by ammonium oxidizing bacteria from nitrifying bacteria consortium. On the other hand, nitrite availability enables nitrite oxidizing bacteria to shift chemical equilibrium of the nitrification reaction by nitrate production. The produced nitrate can be used by photoautotrophic microalgae C. calcitrans [7]. The use of grained CaCO3 was able to stabilize the pH level due to its slow release of carbonate ion (CO3 2-) that can balance the acidification as the result of organic matter decomposition and continuous nitrification processes [28-31].
Technical Feasibility Analysis
Production site analysis
Selection of suitable area for ZWD system implementation as well as production requirements are crucial to ensure that the technology can be accepted and successfully implemented. Farmer selection was considered to be the most important aspect. By considering several criteria as follows: quality and quantity of water sources, land topography, land structures, accessibility, availability of production infrastructure, such as electricity sources, seed producers, and distance to an aquaculture government research facility, it is suggested that the north coastal areas of East Java Province, such as Tuban, Lamongan, Gresik, Sidoarjo, Pasuruan, Probolinggo, and Situbondo were suitable for shrimp urban aquaculture using ZWD system. All of these areas fulfill the following criteria:
1. Located close to sea water sources.
2. Provide suitable physical condition for shrimp growth (temperature, humidity, and light intensity). Temperature and humidity in dry season ranged between 22-34°C and 50-86%, respectively [32,33].
3. Land topography is relatively contour less, provides easiness to build a farm on the terrain and less land clearing cost.
4. Located close to domestic market in the main cities of East Java province: Surabaya and Lamongan. They have the most cold storage companies (19.8%) and fish processing units (23.7%) compared to total available units in Indonesia [34]. By number, there are 59 fish processing units in East Java Province [35].
5. Free from any social conflict.
6. Receive government supports in form of many aquaculture research institutions.
Production requirements analysis
As a new approach of shrimp production using ZWD system, more culture control is necessary, compared to conventional culture system. Control was started from the preparation, conditioning and operating of the system to harvesting. To help achieve this control, several specified components are required in the shrimp farm, such as: shrimp seeds, feed, water sources (sea water and fresh water), probiotic and microalgae (Table 5). All of these components were adjusted to produce equal quantity of shrimps (1000 kg) from each stocking density. Several specified components and its quantity were presented on Tables 6 and 7. According to Table 8, 200 in d/m3 stocking density occupies the widest area and more production ponds compared to 300 and 400 in d/m3 stocking densities, while 400 in d/m3 stocking density occupies the least area and fewer production ponds. Therefore, 400 in d/m3 stocking density is considered to be the most efficient treatment as it needs the least facilities investment among all stocking densities.
| No | Factors | Specifications |
|---|---|---|
| 1 | Shrimp Seeds | Post larvaes (PL8-18 days) are already acclimatizated to low salinity water, healthy, active, relatively homogenous in size and specific pathogen free (SPF). |
| 2 | Feed | Consist of =30% protein, >5% fat and =4% fiber. Size and type of feed (crumble or pellet) is adjusted to feeding management table. |
| 3 | Probiotic Bacteria | Consist of: •Chemolitotrophic bacteria, ammonium oxidizing bacteria and nitrite oxidizing bacteria, to maintain inorganic nitrogen concentration in water. •Heterotrophic bacteria, Bacillus megaterium,for organic compound breakdown and increase shrimp aRpetite. |
| 4 | Water Sources | Has been treated through sedimentation, filtration, and disinfection. Has the following physicochemical parameters: temperature 24-32°C, salinity ± 5 Rpt, dissolved oxygen (DO)>4 mg/L, NH4 +<0.5 mg/L, NO2 -<0.1 mg/L, and NO3 -<1000 mg/L |
Table 5: Components specification required for low salinity white shrimp culture in ZWD system.
| Materials Requirement | SD1(200 ind/m3) | SD2(300 ind/m3) | SD3(400 ind/m3) |
|---|---|---|---|
| White Shrimp Seed (individual) | 148,000 | 165,000 | 184,000 |
| Shrimp Feed (kg) | 1,050 | 1,060 | 1,140 |
| Sea water (m3) | 111 | 84 | 69 |
Table 6: Materials required among treatments for low salinity white shrimp culture in ZWD system.
| No | Production Facilities | Specifications |
|---|---|---|
| 1 | Production Ponds | A rectangular concrete pond (size 5×4×1.2m, volume 20m3), an aeration device, an inlet pipe, an outlet pipe (central drain), tarpaulin coverage (for water temperature stability). |
| 2 | Reservoir Tank | A rectangular concrete pond (size 5×5×1.2m), an aeration device, an inlet pipe, an outlet pipe (central drain), a tarpaulin coverage (for water temperature stability and avoid external organic input). |
| 3 | Acclimatization Tank | An indoor rectangular concrete pond (size 3×1×1.2m), an aeration device, an inlet pipe, an outlet pipe (central drain). |
| 4 | Aeration Devices | A dynamo motor, a blower, PVC pipes, regulators, diffusers. Units are placed beside production ponds. Dynamo motor and blower are locked inside to avoid any disturbance. |
| 5 | Electricity Devices | A generator, cables, and a panel. |
| 6 | Algae Ponds | Circular fiber ponds with size (D 1.25×h 0.6 m), equiRped with aeration device. |
| 7 | Nitrifying Bacteria Ponds | Circular fiber ponds with size (D 1.25×h 0.6 m), covered and equiRped with aeration device. |
| 8 | B. megaterium Ponds | A rectangular plastic container (0.5×0.2m), covered and equiRped with aeration device. |
| 9 | Pumps | A submerged pump (circulate treated water from sedimentation ponds to culture ponds), a pump (circulate well water from culture ponds to treatment ponds). |
| 10 | Recirculating Aquaculture System | Water treatment components: a sedimentation pond (5×3× 1.2 m) with a physical filter, 2 protein skimmers (70 L), carbon filter (100L), and a biofilter pond (5×5×1.2m) with inoculated nitrifying bacteria on CaCO3 (gravel). |
Table 7: Facilities specification required for low salinity white shrimp culture in ZWD system.
| Production Facilities Requirements | SD1(200 ind/m3) | SD2(300 ind/m3) | SD3(400 ind/m3) |
|---|---|---|---|
| Land purchase (m2) | 1250 | 1125 | 1000 |
| Production ponds (5 × 4 × 1.2m) | 37 | 28 | 23 |
| Tarpaulin (m2) | 740 | 560 | 460 |
| Reservoir ponds (5 × 5 × 1.2m) | 2 | 2 | 2 |
| Acclimatization Ponds (3 × 1 × 1.2m) | 2 | 2 | 2 |
| Algae ponds (D1.25×h0.6m) | 2 | 2 | 2 |
| Nitrifying bacteria ponds (D1.25×h0.6m) | 1 | 1 | 1 |
| B. megateriumcontainer(0.5×0.2m) | 2 | 2 | 2 |
| Sedimentation tank (5 × 3 × 1.2m) | 1 | 1 | 1 |
| Protein skimmer (70 L) | 1 | 1 | 1 |
| Biofilter tank (5 × 5 × 1.2m) (CaCO3 gravel) | 2 | 2 | 2 |
| Submerged pump | 2 | 2 | 2 |
| Vacuum sealer | 1 | 1 | 1 |
| Freezer box | 2 | 2 | 2 |
| Electricity devices (generator, cable, and panel) | 1 | 1 | 1 |
| Aeration pack (dynamo motor, blower, hoses) | 1 | 1 | 1 |
Table 8: Facilities requirements among treatments for low salinity white shrimp culture using ZWD system.
Production scheme development
Production scale estimation: Production estimation of low salinity white shrimp culture using ZWD system was assumed to produce 1000 kg shrimp/cycle for 3 months (preparation, production, and marketing). Harvested shrimps were distributed to domestic market segments, cold storage companies, and shrimp processing units surrounding East Java Province. The demand for fresh harvested shrimp is approximately 15-20 Ton/day in East Java Province [36]. In this study, the shrimp product was widely accepted for domestic market segments because the harvested shrimps were at the size distribution of 100 shrimps/ kg, acceptable to the demanded size in Surabaya and Indonesia (100 shrimps/kg, 80 shrimps/kg, 70 shrimps/kg, to 60 shrimps/kg) [37].
Production scheme: Based on real production scheme in the shrimp farm documented during this study, a model of production scheme considering minimum operation units and human resources was arranged (Figure 1). To operate low salinity white shrimp culture using ZWD system, the production scheme was arranged into six units
1. Purchasing and inventory unit, for ordering and purchasing raw materials
2. Waste and water treatment unit, for recycling input and waste water
3. Rearing unit, to rear shrimp from acclimatization stage until harvest time
4. Harvesting unit, to conduct shrimp harvest from a pond and post-harvest treatment
5. Marketing and distribution unit, to distribute fresh shrimp
6. Transaction and archive unit, to record production result and transaction history.
To operate the mentioned scheme, one or two technicians and one tank operator are needed to produce 1000 kg/cycle of fresh shrimps. Considering the small production scale, the recruited human resources must be able to multitask in order to maintain production efficiency and sustainability. ZWD system facilities include a controllable small pond that provides easiness to be cleaned and harvested regularly, which simplify the labour works. Workload are distributed into several positions consist of a technician, a pond operator and an owner. Technician is responsible for assisting operator and technical matters related with water treatment and rearing process, including siphoning, feeding, shrimp weight sampling and harvesting. Pond operator is responsible to lead production operational and coordinate technician to assist production. Meanwhile, the owner is responsible to pay the worker’s salary, to create financial report, and to direct and build company networks.
Farm lay out design: Shrimp farm lay out was designed by considering facilities required and production scheme. Its dimension is planned by considering the product specification (fresh shrimp size of 100 shrimps/kg), culture period (70 days) and production scale (1000 kg/cycle). According to the presented lay out (Figure 2), 200 in d/m3 stocking density has the highest requirement of production area as it needs the highest number of pond, 37 ponds, compared to 300 in d/ m3 stocking density (28 ponds) and 400 in d/m3 stocking density (23 ponds).
Financial feasibility analysis: Financial feasibility of the shrimp production at low salinity using ZWD system was analysed based on the equations described in section II.7, with the following facts and assumptions
1. One production cycle runs for 70 days.
2. Fresh shrimp worth IDR 60.000/kg.
3. Seed stocking density of 200 in d/m3, 300 in d/m3 and 400 in d/m3.
4. Average survival rate (SR) at 200, 300, 400 in d/m3 stocking densities of 93.52%, 79.11% and 70.59%, respectively.
5. Average harvested biomass per 20 m3 pond at 200, 300, 400 in d/m3 stocking densities of 27.75 kg, 36.25 kg and 44.13 kg, respectively.
6. Average feed conversion ratio (FCR) at 200, 300, 400 in d/m3 stocking densities 1.05, 1.06, and 1.14, respectively.
7. Operational costs per cycle include: shrimp seed, feed, labor, algae and probiotic, electricity, sea water, chemicals and disinfectant, harvesting, packaging and distribution, and depreciation.
8. Investment costs include: land, buildings, production ponds, acclimatization ponds, algae ponds, reservoir ponds, nitrifying bacteria ponds, container for B. megaterium, sedimentation ponds, protein skimmer, bio-filter ponds, electricity devices, aeration devices, tarpaulin, pumps, a vacuum sealer, and a freezer box.
9. Estimated area required for 200 in d/m3, 300 in d/m3, and 400 in d/m3 stocking densities of 1250 m2, 1125 m2 and 1000 m2, respectively.
Operational costs calculation: The total operational cost to produce 1000 kg/cycle using ZWD system can be seen in Tables 9-11. The 200 in d/m3 stocking density has the highest operational cost, with total operational cost of approximately Rp 49,087,750, followed by 400 and 300 in d/m3 stocking densities which cost Rp 40,227,125 and Rp 39,494,625, respectively. Among all treatments, the highest operational cost were contributed by feed cost (34-41%) and followed by labor cost (27-34%) (Figure 3). High operational cost of 200 in d/m3 stocking density was due to more labor cost required to handle extra ponds. The highest profit was achieved by 300 in d/m3 stocking density with profit of Rp 16,505,375, followed by 400 and 200 in d/m3 stocking density with profit of Rp 15,772,875 and Rp 10,912,250, respectively.
| Operational Costs | Quantity | Unit | Price/unit | Total Cost (IDR) |
|---|---|---|---|---|
| Shrimp Seeds | 1,48,000 | Individual | Rp30 | Rp4,440,000 |
| Feed (FCR 1.05) | 1,050 | kg | Rp16,000 | Rp16,800,000 |
| Labour Costs (Operator + 2 Technician) | 3 | salary/month | Rp5,500,000 | Rp16,500,000 |
| Electricity | kWH | Rp2,590,000 | ||
| Sea Water | 22.2 | Tank (5,000 L) | Rp200,000 | Rp4,440,000 |
| Algae and Probiotics | 1 | Pack | Rp400,000 | Rp400,000 |
| Chemicals and Disinfectants | 1 | Pack | Rp370,000 | Rp370,000 |
| Harvesting Cost | 1 | Pack | Rp500,000 | Rp500,000 |
| Packaging and delivery Cost | 1 | Pack | Rp500,000 | Rp500,000 |
| Depreciation Cost/Cycle | 1 | Pack | Rp2,547,750 | Rp2,547,750 |
| Total Production Cost/Cycle | Rp49,087,750 | |||
| Production Cost/kg shrimp | Rp49,088 | |||
| Revenue/Cycle (1000 kg × 50,000) | Rp60,000,000 | |||
| Profit/Cycle = Total Revenue - Total Production Cost | Rp10,912,250 | |||
| Profit/Month | Rp3,637,417 | |||
| Profit/Pond | Rp474,446 | |||
| Profit/Kg Shrimp | Rp10,912 | |||
| BEP/Kg Shrimp | Rp4,498 | |||
| Revenue | Quantity | Unit | Price/unit (IDR) | Total Revenue |
| White Shrimp Size 100 | 1,000 | kg | 60,000 | 6,00,00,000 |
Table 9: Estimated production cost to produce 1000 kg shrimps/cycle at 200 ind/ m3 stocking density.
| Operational Costs | Quantity | Unit | Price/unit (IDR) | Total Cost (IDR) |
|---|---|---|---|---|
| Shrimp Seeds | 1,68,000 | Individual | Rp30 | Rp5,040,000 |
| Feed (FCR 1.06) | 1,060 | kg | Rp16,000 | Rp16,960,000 |
| Labour Costs (Operator + Technician) | 3 | salary/month | Rp4,000,000 | Rp12,000,000 |
| Electricity | kWH | Rp1,960,000 | ||
| Sea Water | 16.8 | Tank (5,000 L) | Rp200,000 | Rp3,360,000 |
| Algae and Probiotics | 1 | Pack | Rp400,000 | Rp400,000 |
| Chemicals and Disinfectants | 1 | Pack | Rp280,000 | Rp280,000 |
| Harvesting Cost | 1 | Pack | Rp500,000 | Rp500,000 |
| Packaging and distribution Cost | 1 | Pack | Rp500,000 | Rp500,000 |
| Depreciation Cost/Cycle | 1 | Pack | Rp2,494,625 | Rp2,494,625 |
| Total Production Cost/Cycle | Rp43,494,625 | |||
| Production Cost/kg shrimp | Rp43,495 | |||
| Revenue/Cycle (1000 kg × 50,000) | Rp60,000,000 | |||
| Profit/Cycle = Total Revenue - Total Production Cost | Rp16,505,375 | |||
| Profit/Month | Rp5,501,792 | |||
| Profit/Pond | Rp717,625 | |||
| Profit/Kg Shrimp | Rp16,505 | |||
| BEP/Kg Shrimp | Rp2,635 | |||
| Revenue | Quantity | Unit | Price/unit (IDR) | Total Revenue |
| White Shrimp Size 100 | 1,000 | kg | 60,000 | 6,00,00,000 |
Table 10: Estimated production cost to produce 1000 kg shrimps/cycle at 300 ind/ m3 stocking density.
| Operational Costs | Quantity | Unit | Price/unit | Total Cost (IDR) |
|---|---|---|---|---|
| Shrimp Seeds | 1,84,000 | Individual | Rp30 | Rp5,520,000 |
| Feed (FCR 1.14) | 1,140 | kg | Rp16,000 | Rp18,240,000 |
| Labour Costs (Operator + Technician) | 3 | salary/month | Rp4,000,000 | Rp12,000,000 |
| Electricity | kWH | Rp1,610,000 | ||
| Sea Water | 13.8 | Tank (5,000 L) | Rp200,000 | Rp2,760,000 |
| Algae and Probiotics | 1 | Pack | Rp400,000 | Rp400,000 |
| Chemicals and Disinfectants | 1 | Pack | Rp230,000 | Rp230,000 |
| Harvesting Cost | 1 | Pack | Rp500,000 | Rp500,000 |
| Packaging and distribution Cost | 1 | Pack | Rp500,000 | Rp500,000 |
| Depreciation Cost/Cycle | 1 | Pack | Rp2,467,125 | Rp2,467,125 |
| Total Production Cost/Cycle | Rp44,227,125 | |||
| Production Cost/kg shrimp | Rp44,227 | |||
| Revenue/Cycle (1000 kg × 50,000) | Rp60,000,000 | |||
| Profit/Cycle = Total Revenue - Total Production Cost | Rp15,772,875 | |||
| Profit/Month | Rp5,257,625 | |||
| Profit/Pond | Rp685,777 | |||
| Profit/Kg Shrimp | Rp15,773 | |||
| BEP/Kg Shrimp | Rp2,804 | |||
| Revenue | Quantity | Unit | Price/unit (IDR) | Total Revenue |
| White Shrimp Size 100 | 1,000 | kg | 60,000 | 6,00,00,000 |
Table 11: Estimated production cost to produce 1000 kg shrimps/cycle at 400 ind/ m3 stocking density.

Figure 3: Flow of Production Scheme: Units and human resources needed to produce 1000 kg shrimps/cycle.
Investment cost: Investment costs calculations are presented in Tables 12-14. Again, 200 in d/m3 stocking density has the highest investment costs of approximately Rp 443,520,000, followed by 300 and 400 in d/m3 stocking density (Rp 358,080,000 and Rp 318,230,000), respectively. The highest component contribute to the investment costs are production ponds cost (36-42%) and land purchasing (21- 24%) (Figure 4). Clearly, high investment cost for 200 in d/m3 stocking density was due to higher number of ponds needed for production.
| Capital Costs | Quantities | Units | Price/unit | Total |
|---|---|---|---|---|
| Land Purchase (1,057 m2) | 1 | Package | Rp105,700,000 | Rp105,700,000 |
| Buildings | 1 | unit | Rp70,000,000 | Rp70,000,000 |
| Production Tank (Concrete Pond, 5 × 4 × 1.2m) | 37 | Package | Rp5,000,000 | Rp185,000,000 |
| Reservoir Tank (Concrete Pond, 5 × 5 × 1.2) | 2 | Package | Rp6,250,000 | Rp12,500,000 |
| Acclimatization Tank (Concrete Pond, 3 × 1 × 1.2m) | 2 | Package | Rp1,500,000 | Rp3,000,000 |
| Algae Tank (Circular fiber, 1.25 × t0.6) | 2 | Package | Rp1,250,000 | Rp2,500,000 |
| Nitrifying Bacteria Tank (Circular fiber, 1.25 × t0.6) | 1 | Package | Rp1,250,000 | Rp1,250,000 |
| B. megateriumreactor (cylindrical fiber, 0.5t × 0.2) | 2 | Package | Rp250,000 | Rp500,000 |
| Sedimentation tank (concrete pond, 5 × 3 × 1.2) | 1 | Package | Rp6,000,000 | Rp6,000,000 |
| Protein Skimmer (Cylindrical PVC, 70 L) | 1 | Package | Rp5,000,000 | Rp5,000,000 |
| Biofilter (concrete pond, include CaCO3, 5 × 5 × 1.2 m) | 2 | Package | Rp7,500,000 | Rp15,000,000 |
| Submerged Pump | 2 | Package | Rp2,500,000 | Rp5,000,000 |
| Tarpaulin | 740 | m2 | Rp5,500 | Rp4,070,000 |
| Vacuum Sealer | 1 | unit | Rp1,000,000 | Rp1,000,000 |
| Freezer Box | 2 | unit | Rp3,500,000 | Rp7,000,000 |
| Electricity Installation (Generator, cable, and panel) | 1 | unit | Rp10,000,000 | Rp10,000,000 |
| Aeration pack (Dynamo, blower, hoses) | 1 | set | Rp10,000,000 | Rp10,000,000 |
| Total Capital Invested | Rp443,520,000 | |||
Table 12: Estimated investment cost to produce 1000 kg shrimps/cycle at 200 ind/m3 stocking density.
| Capital Costs | Quantities | Units | Price/unit | Total |
|---|---|---|---|---|
| Land Purchase (800 m2) | 1 | Package | Rp80,000,000 | Rp80,000,000 |
| Buildings | 1 | unit | Rp70,000,000 | Rp70,000,000 |
| Production Ponds (Concrete Pond, 5 × 4 × 1.2m) | 28 | Package | Rp5,000,000 | Rp140,000,000 |
| Reservoir Tank (Concrete Pond, 5 × 5 × 1.2) | 1 | Package | Rp6,250,000 | Rp6,250,000 |
| Acclimatization Tank (Concrete Pond, 3 × 1 × 1.2m) | 2 | Package | Rp1,500,000 | Rp3,000,000 |
| Algae Ponds (Circular fiber, 1.25 × t0.6) | 2 | Package | Rp1,250,000 | Rp2,500,000 |
| Nitrifying Bacteria Tank (Circular fiber, 1.25 × t0.6) | 1 | Package | Rp1,250,000 | Rp1,250,000 |
| B. megateriumreactor (cylindrical fiber, 0.5t × 0.2) | 2 | Package | Rp250,000 | Rp500,000 |
| Sedimentation tank (concrete pond, 5 × 3 × 1.2) | 1 | Package | Rp6,000,000 | Rp6,000,000 |
| Protein Skimmer (Cylindrical PVC, 70 L) | 1 | Package | Rp5,000,000 | Rp5,000,000 |
| Biofilter (concrete pond, include CaCO3, 5 × 5 × 1.2 m) | 1 | Package | Rp7,500,000 | Rp7,500,000 |
| Submerged Pump | 2 | Package | Rp2,500,000 | Rp5,000,000 |
| Tarpaulin | 560 | m2 | Rp5,500 | Rp3,080,000 |
| Vacuum Sealer | 1 | unit | Rp1,000,000 | Rp1,000,000 |
| Freezer Box | 2 | unit | Rp3,500,000 | Rp7,000,000 |
| Electricity Installation (Generator, cable, and panel) | 1 | unit | Rp10,000,000 | Rp10,000,000 |
| Aeration pack (Dynamo, blower, hoses) | 1 | set | Rp10,000,000 | Rp10,000,000 |
| Total BiayaInvestasi | Rp358,080,000 | |||
Table 13: Estimated investment cost to produce 1000 kg shrimps/cycle at 300 ind/m3 stocking density.
| Land Purchase (657 m2) | 1 | Package | Rp65,700,000 | Rp65,700,000 |
| Buildings | 1 | unit | Rp70,000,000 | Rp70,000,000 |
| Production Tank (Concrete Pond, 5 × 4 × 1.2m) | 23 | Package | Rp5,000,000 | Rp115,000,000 |
| Reservoir Tank (Concrete Pond, 5 × 5 × 1.2) | 1 | Package | Rp6,250,000 | Rp6,250,000 |
| Acclimatization Tank (Concrete Pond, 3 × 1 × 1.2m) | 2 | Package | Rp1,500,000 | Rp3,000,000 |
| Algae Tank (Circular fiber, 1.25 × t0.6) | 2 | Package | Rp1,250,000 | Rp2,500,000 |
| Nitrifying Bacteria Tank (Circular fiber, 1.25 × t0.6) | 1 | Package | Rp1,250,000 | Rp1,250,000 |
| B. megateriumreactor (cylindrical fiber, 0.5t × 0.2) | 2 | Package | Rp250,000 | Rp500,000 |
| Sedimentation tank (concrete pond, 5 × 3 × 1.2) | 1 | Package | Rp6,000,000 | Rp6,000,000 |
| Protein Skimmer (Cylindrical PVC, 70 L) | 1 | Package | Rp5,000,000 | Rp5,000,000 |
| Biofilter (concrete pond, include CaCO3, 5 × 5 × 1.2 m) | 1 | Package | Rp7,500,000 | Rp7,500,000 |
| Submerged Pump | 2 | Package | Rp2,500,000 | Rp5,000,000 |
| Tarpaulin | 460 | m2 | Rp5,500 | Rp2,530,000 |
| Vacuum Sealer | 1 | unit | Rp1,000,000 | Rp1,000,000 |
| Freezer Box | 2 | unit | Rp3,500,000 | Rp7,000,000 |
| Electricity Installation (Generator, cable, and panel) | 1 | unit | Rp10,000,000 | Rp10,000,000 |
| Aeration pack (Dynamo, blower, hoses) | 1 | set | Rp10,000,000 | Rp10,000,000 |
| Total Investment Cost | Rp318,230,000 | |||
Table 14: Estimated investment cost to produce 1000 kg shrimps/cycle at 400 ind/m3 stocking density.

Figure 4: Farm layout of white shrimpculture using low salinity ZWD system at three different stocking densities.
Financial projection: Financial projections were calculated to predict the break event point. Profit was calculated by subtracting the total revenue with production cost. Assumed that there are four production cycles per year, in which 1000 kg shrimps are produced per cycle with duration of three months, in one year the farm will produce 4000 kg of fresh shrimp with a total revenue of Rp 240,000,000. Financial projection for 200, 300, 400 in d/m3 stocking densities are presented in Tables 15-17. The most efficient treatment with the lowest production cost was achieved in 400 in d/m3 stocking density with production cost per cycle of Rp 40,227,125 or Rp 160,908,500 per year and the highest profit of Rp 79,091,500. The 400 and 300 in d/m3 stocking densities treatment will achieve a payback period after four years of operation, while 200 in d/m3 stocking density it will be achieved after ten years operation Figures 5 and 6.
| Years | 0 | 1 | 2 | 3 | 4 | 5 | 6 | 7 | 8 | 9 | 10 |
|---|---|---|---|---|---|---|---|---|---|---|---|
| Income | |||||||||||
| Fresh shrimp | 4000 | 4000 | 4000 | 4000 | 4000 | 4000 | 4000 | 4000 | 4000 | 4000 | |
| Shrimp price | Rp 60,000 | Rp 60,000 | Rp 60,000 | Rp 60,000 | Rp 60,000 | Rp 60,000 | Rp 60,000 | Rp 60,000 | Rp 60,000 | ||
| Total income | Rp 240,000,000 | Rp 240,000,000 | Rp 240,000,000 | Rp 240,000,000 | Rp 240,000,000 | Rp 240,000,000 | Rp 240,000,000 | Rp 240,000,000 | Rp 240,000,000 | ||
| Expenses | |||||||||||
| Feed expenses | Rp 443,520,000 |
||||||||||
| variable Expences | Rp 186,160,000 |
Rp 186,160,000 |
Rp 186,160,000 |
Rp 186,160,000 |
Rp 186,160,000 |
Rp 186,160,000 |
Rp 186,160,000 |
Rp 186,160,000 |
Rp 186,160,000 |
Rp186,160,000 | |
| Depreciation | Rp 10,191,000 |
Rp 10,191,000 |
Rp 10,191,000 |
Rp 10,191,000 |
Rp 10,191,000 |
Rp 10,191,000 |
Rp 10,191,000 |
Rp 10,191,000 |
Rp 10,191,000 |
Rp10,191,000 | |
| Total Expenses | Rp 443,520,000 |
Rp 196,351,000 |
Rp 196,351,000 |
Rp 196,351,000 |
Rp 196,351,000 |
Rp 196,351,000 |
Rp 196,351,000 |
Rp 196,351,000 |
Rp 196,351,000 |
Rp 196,351,000 |
Rp 196,351,000 |
| Profitloss | Rp (443,520,000) |
Rp 43,649,000 |
Rp 43,649,000 |
Rp 43,649,000 |
Rp 43,649,000 |
Rp 43,649,000 |
Rp 43,649,000 |
Rp 43,649,000 |
Rp 43,649,000 |
Rp 43,649,000 |
Rp 43,649,000 |
| Net income | Rp (443,520,000) |
Rp (399,871,000) |
Rp (356,222,000) |
Rp (312,573,000) |
Rp (268,924,000) |
Rp (225,275,000) |
Rp (181,626,000) |
Rp (137,977,000) |
Rp (94,328,000) |
Rp (50,679,000) |
Rp (7,030,000) |
Table 15: Shrimp product financial projection of 200 ind/m3 stocking density using low salinity ZWD system to produce 1000 kg shrimp during 70 days culture period.
| Years | 0 | 1 | 2 | 3 | 4 | 5 | 6 | 7 | 8 | 9 | 10 |
|---|---|---|---|---|---|---|---|---|---|---|---|
| Income | |||||||||||
| Fresh shrimp | 4000 | 4000 | 4000 | 4000 | 4000 | 4000 | 4000 | 4000 | 4000 | 4000 | |
| Shrimp price | Rp58,000 | Rp58,000 | Rp58,000 | Rp58,000 | Rp58,000 | Rp58,000 | Rp58,000 | Rp58,000 | Rp58,000 | ||
| Total income | Rp232,000,000 | Rp232,000,000 | Rp232,000,000 | Rp232,000,000 | Rp232,000,000 | Rp232,000,000 | Rp232,000,000 | Rp232,000,000 | Rp232,000,000 | ||
| Expenses | |||||||||||
| Feed expenses | Rp318,230,000 | ||||||||||
| variable Expences | Rp151,040,000 | Rp176,908,000 | Rp176,908,000 | Rp176,908,000 | Rp176,908,000 | Rp176,908,000 | Rp176,908,000 | Rp176,908,000 | Rp176,908,000 | Rp176,908,000 | |
| Depreciation | Rp9,868,000 | Rp9,868,000 | Rp9,868,000 | Rp9,868,000 | Rp9,868,000 | Rp9,868,000 | Rp9,868,000 | Rp9,868,000 | Rp9,868,000 | Rp9,868,000 | |
| Total Expenses | Rp318,230,000 | Rp160,908,000 | Rp186,777,000 | Rp186,777,000 | Rp186,777,000 | Rp186,777,000 | Rp186,777,000 | Rp186,777,000 | Rp186,777,000 | Rp186,777,000 | Rp186,777,000 |
| Profitloss | Rp(318,230,000) | Rp43,649,000 | Rp43,649,000 | Rp43,649,000 | Rp43,649,000 | Rp43,649,000 | Rp43,649,000 | Rp43,649,000 | Rp43,649,000 | Rp43,649,000 | Rp43,649,000 |
| Net income | Rp(318,230,000) | Rp(247,138,500) | Rp(201,915,000) | Rp(156,692,500) | Rp(111,469,500) | Rp(66,246,000) | Rp(21,023,000) | Rp24,199,000 | Rp69,422,500 | Rp114,645,500 | Rp159,868,000 |
Table 16: Shrimp product financial projection of 300 ind/m3 stocking density using low salinity ZWD system to produce 1000 kg shrimp during 70 days culture period.
| Years | 0 | 1 | 2 | 3 | 4 | 5 | 6 | 7 | 8 | 9 | 10 |
|---|---|---|---|---|---|---|---|---|---|---|---|
| Income | |||||||||||
| Fresh shrimp | 4000 | 4000 | 4000 | 4000 | 4000 | 4000 | 4000 | 4000 | 4000 | 4000 | |
| Shrimp price | Rp58,000 | Rp58,000 | Rp58,000 | Rp58,000 | Rp58,000 | Rp58,000 | Rp58,000 | Rp58,000 | Rp58,000 | ||
| Total income | Rp232,000,000 | Rp232,000,000 | Rp232,000,000 | Rp232,000,000 | Rp232,000,000 | Rp232,000,000 | Rp232,000,000 | Rp232,000,000 | Rp232,000,000 | ||
| Expenses | |||||||||||
| Feed expenses | Rp318,230,000 | ||||||||||
| variable Expences | Rp151,040,000 | Rp151,040,000 | Rp176,908,000 | Rp176,908,000 | Rp176,908,000 | Rp176,908,000 | Rp176,908,000 | Rp176,908,000 | Rp176,908,000 | Rp176,908,000 | |
| Depreciation | Rp9,868,000 | Rp9,868,000 | Rp9,868,000 | Rp9,868,000 | Rp9,868,000 | Rp9,868,000 | Rp9,868,000 | Rp9,868,000 | Rp9,868,000 | Rp9,868,000 | |
| Total Expenses | Rp318,230,000 | Rp186,777,000 | Rp160,908,000 | Rp186,777,000 | Rp186,777,000 | Rp186,777,000 | Rp186,777,000 | Rp186,777,000 | Rp186,777,000 | Rp186,777,000 | Rp186,777,000 |
| Profitloss | Rp(318,230,000) | Rp71,091,500 | Rp45,223,000 | Rp45,223,000 | Rp45,223,000 | Rp45,223,000 | Rp45,223,000 | Rp45,223,000 | Rp45,223,000 | Rp45,223,000 | Rp45,223,000 |
| Net income | Rp(318,230,000) | Rp(247,138,500) | Rp(201,915,000) | Rp(156,692,500) | Rp(111,469,500) | Rp(66,246,000) | Rp(21,023,000) | Rp24,199,000 | Rp69,422,500 | Rp114,645,500 | Rp159,868,000 |
Table 17: Shrimp product financial projection of 400 ind/m3 stocking density using low salinity ZWD system to produce 1000 kg shrimp during 70 days culture period.

Figure 5: Diagram of investment cost components percentage among different stocking densities to produce 1000 kg shrimps/cycle using low salinity ZWD system.

Figure 6: Diagram of production cost components percentage among different stocking densities to produce 1000 kg shrimp/cycle using low salinity ZWD system.
Financial ratio calculation: Financial ratios were calculated to assess the financial feasibility of ZWD system. Financial ratio analyses consist of NPV, IRR, B/C Ratio, and Pay Back Period (PBP). Based on financial analysis, the project is financially feasible if the NPV positive, the IRR value is higher than discount factor, and the B/C ratio value is higher than 1 [16,38]. The financial ratio calculations are presented in Table 18. It can be clearly seen that 300 and 400 in d/m3 stocking densities were financially feasible as they resulted in positive NPV (approximately Rp 47,593,537 and Rp 69,439,955), IRR value that higher than discount factor (approximately 13.40% and 15.49%), and B/C ratio higher than 1 (around 1.13 and 1.22). In contrast, 200 in d/ m3 stocking densitiy was not financially feasible due to its negative NPV value (around Rp -175,315,390) and IRR value that is lower than discount factor (lower than 10%), with B/C ratio less than 1 [38].
| Parameter | Treatments | ||
|---|---|---|---|
| SD1 (200 ind./m3) |
SD2 (300 ind./m3) |
SD3 (400 ind./m3) |
|
| Investment Cost | Rp443,520,000 | Rp 358,080,000 | Rp 318,230,000 |
| Revenue | Rp60,000,000 | Rp 60,000,000 | Rp 60,000,000 |
| Production Cost/Cycle | Rp49,087,750 | Rp 43,494,625 | Rp 44,227,125 |
| Profit/Cycle | Rp10,912,250 | Rp 16,505,375 | Rp 15,722,875 |
| Profit/kg Shrimp | Rp10,912 | Rp 16,505 | Rp 15,773 |
| BEP (kg) | 4,498 | 2,635 | 2,804 |
| Net Present Value (NPV) | -175,315,390 | 47,593,537 | 69,439,955 |
| B/C Ratio | 0.605 | 1.13 | 1.22 |
| Pay Back Period (year) | 10.16 | 4.37 | 4.02 |
| Internal Rate of Return (IRR) (%) | <10 | 13.40 | 15.49 |
Table 18: Financial ratio calculation of ZWD system among different stocking densities to produce 1000 kg shrimps/cycle using low salinity ZWD system.
Conclusion
Based on the results of this current study, it can be concluded that the implementation of low salinity ZWD system for urban shrimp aquaculture production at high stocking density of 300 in d/m3 and 400 in d/m3 was feasible to be applied in Gresik on the north-coastal area of East Java Province, Indonesia.
Acknowledgements
We thank LPPM ITB for the Community Empowerment Research Grant 2014 as the main funding for this study. We also thank Ir. Usman Zuhri as the Head of UD. Popular Nursery, for the kind support in providing shrimp larvae and facilities used in this study.
References
- FAO (2014) The state of world fisheries and aquaculture: Opportunities and challenges. FAO Publication, Rome.
- PPEI Indonesia Ministry of Trade (2010) List of 10 Indonesia Main Product.
- DJPB (2015) Udang Vaname dan Udang Windu Masih Andalan Ekspor.
- Browdy CL, Bratvold, D, Stokes, AD, McIntosh RP (2001) Perspectives on the application of closed shrimp culture systems. In: Browdy CL, Jory DE (eds.) The New Wave, Proceedings of the special session on sustainable shrimp farming, World Aquaculture Society.
- Lin YC, Chen JC (2001) Acute toxicity of ammonia on Litopenaeus vannamei Boone juveniles at different salinity levels. J Experit Mar Biol Eco 259: 109-119.
- Suantika G, Astuti DI, Aditiawati P, Sofyan Y (2009) Pengaruh kepadatan awal inokulum terhadap kualitas kultur Chaetoceros gracilis (Schutt) pada sistem batch. J Math Sci 14: 2.
- Suantika G, Lumbantoruan G, Muhammad H, Azizah FFN, Aditiawati P (2015) Performance of zero water discharge (ZWD) system with nitrifying bacteria and microalgae Chaetoceros calcitrans components in super intensive white shrimp (Litopenaeus vannamei) culture. J Aquacult Res Dev 6: 359.
- Budford M, Thompson P, McIntosh, Bauman R, Pearson D (2003) Nutrient and microbial dynamics in high-intensity, zero exchange shrimp ponds in Belize. Aquaculture 219: 393-411.
- Suantika G, Astuti DI , Aditiawati P, Sasmita PG (2009) Development of zero-water discharge technology and nitrifying bacteria application in nursery phase of the giant freshwater prawn (Macrobrachium rosenbergii de Man). Proceeding World Aquaculture 2009 Mexico.
- Atlas RM (2004) Handbook of microbiological media 3rd Edition. Washington DC: CRC press
- Van Wyk P, Davis-Hodgkins M, Laramore R, Main KL, Mountain J, et al. (1999) Farming Marine Shrimp in Recirculating Freshwater System. Florida: Harbor Branch Oceanographic Institution, Florida Department of Agriculture and Consumer Service.
- Ochoa-Solano JL, Olmos-Soto J (2006) The functional property of Bacillus for shrimp feed. Food Microbiol 23: 519-525.
- Tacon AGJ, Jory DE, Nunes AJP (2013) Shrimp feed management: issues and perspectives, On-farm feeding and feed management in aquaculture. FAO Fisheries and Aquaculture Technical Rome, Italy.
- Treece GD, Fox JM (1993) Design Operation and Training Manual for an Intensive Culture System Hatchery. Texas A & M Sea Grant Publication, USA.
- Eaton AD, Franson MAH (2005) Standard Methods for The Examination of Water and Wastewater. American Public Health Association.
- Fandeli C (2012) Bisnis konservasi, pendekatan baru dalam pengelolaan sumber daya alam dan lingkungan hidup. Gajah Mada University Press.
- Suliyanto (2011) Studi Kelayakan Bisnis. Andi, Yogyakarta.
- Arnold SJ, Sellars MJ, Crocos PJ, Coman GJ (2006) Intensive production of juvenile tiger shrimp Penaeus monodon: An evaluation of stocking density and artificial substrates. Aquaculture 261:890-896.
- Kautsky N, Ronnback P, Tedengren M, Troell M (2000) Ecosystem perspective on management of disease in shrimp pond farming. Aquaculture 191: 145-161.
- Wickin JF, Lee DO (2002) Crustacean farming: ranching and culture. In 2ndEdn, Blackwell Science, Oxford, London, Edinburgh, Malden, Carlton, Paris.
- Moksnes PO, Lipcius RN, Pihl L, van Montfrans J (1997) Cannibal–prey dynamics in young juveniles and postlarvae of the blue crab. J Exp Mar Biol Ecol 215: 157-187.
- Chavanich S, Viyakarn V, Senanan W, Panutrakul S (2016) Laboratory assessment of feeding-behavior interactions between the introduced Pacific white shrimp Litopenaeus vannamei (Boone, 1931) (Penaeidae) and five native shrimps plus a crab species in Thailand. Aquatic Invasions 11: 67-74.
- Trubus (2015) Budidaya Vannamei di Air Tawar.
- DJPB (2012) Budidaya Udang Vannamei Tambak Intensif dengan Plastik Mulsa
- FAO (2016) Cultured Aquatic Species Programme Penaus vannamei.
- Lin YC, Chen JC (2003) Acute toxicity of nitrite on Litopenaeus vannamei Boone juveniles at different salinity levels. Aquaculture 224: 193-201
- Tsai SJ, Chen JC (2002) Acute toxicity of nitrate on Litopenaeus vannamei Boone juveniles at different salinity levels. Aquaculture 213: 163-170.
- Katsikogianni M, Missirlis YF (2004) Concise review of mechanisms of bacterial adhesion to biomaterials and of techniques used in estimating bacteria-material interactions. Eur Cell Mater 8:3.
- Ebeling JM (2006) Biofiltration-Nitrification Design Overview: Recirculating aquaculture system technologies. Aquaculture Systems Technologies, LLC: New Orleans, Los Angeles.
- Farchan M (2006) Teknik Budidaya Udang Vannamei. Serang: BAPPL-STP.
- BBAP (2013) Pembenihan Udang Vaname. Situbondo: Seksi Standardisasi dan Informasi BBAP Situbondo.
- Accuweather (2015) Prakiraan Cuaca Bulanan Gresik.
- BMKG (2015) Prakiraan Cuaca untuk Jawa Timur.
- Lubis AD (2009) Kelangkaan Bahan Baku untuk Industri Pengolahan Udang di Jawa Timur. Buletin Ilmiah Litbang Perdagangan 3: 134-152.
- Indonesia Ministry of Industry (2015) Daftar Perusahaan Pengolahan Udang di Jawa Timur 2015.
- Agrina-online (2013) Siapkan Amunisi Agar Lokal Makin Terisi.
- Agrina-online (2015) Mengangkat Produksi Si Bongkok.
- Rangkuti F (2000) Teknik Membuat Perencanaan Bisnis dan Analisis Kasus. PT Gramedia Pustaka Utama, Jakarta.
Relevant Topics
- Acoustic Survey
- Animal Husbandry
- Aquaculture Developement
- Bioacoustics
- Biological Diversity
- Dropline
- Fisheries
- Fisheries Management
- Fishing Vessel
- Gillnet
- Jigging
- Livestock Nutrition
- Livestock Production
- Marine
- Marine Fish
- Maritime Policy
- Pelagic Fish
- Poultry
- Sustainable fishery
- Sustainable Fishing
- Trawling
Recommended Journals
Article Tools
Article Usage
- Total views: 7895
- [From(publication date):
December-2016 - Aug 20, 2025] - Breakdown by view type
- HTML page views : 6501
- PDF downloads : 1394