| Keywords |
| Afforestation; REDD+ mechanism; Onset; Power spectra; RegCM 4.0; Precipitation; Precipitable water; Convergence |
| Abbreviations |
| AS: Arabian Sea; BATS: Biosphere-Atmosphere Transfer Scheme; BOB: Bay of Bengal; COP21: Paris Climate Change Conference; CI: Central India; GLCC: Global Land Cover Characterization; ICTP: International Centre for Theoretical Physics; ISM: Indian Summer Monsoon; IGP: Indo-Gangetic Plain; JJAS: June-July-August-September; LULCC: Land Use/Land Cover Change; LULUCF: Land-Use Land- Use Change and Forestry; LHF: Latent Heat Flux; NWP: Northwestern Part of India; NEI: North-East India; NI: North India; NNRP2: NCEP/ NCAR Reanalysis Project 2; PI: Peninsular India; REDD+: Reducing Emissions From Deforestation and forest Degradation; RegCM4.0: ICTP Version 4.0 of Regional Climate Model; RBATS-F: RegCM4.0- BATS-Forest design experiment; RBATS-DB: RegCM4.0-BATSDeciduous Broadleaf design experiment; SHF: Sensible Heat Flux; TTG: Tropospheric Temperature Gradient; WG: Western Ghats |
| Introduction |
| Nearly two hundred countries of the world, reached historic universal agreement during COP21 to check and take preventive steps to combat “dangerous anthropogenic interference with climate system” for a safe future for human mankind. Emission reduction and sequestration of greenhouse gases GHGs are the mitigation measures for increasing trend of GHGs elements in the present era, particularly over Indian subcontinent [1]. Human activities by removing forests have impacted the terrestrial sinks, which removes GHGs from the atmosphere. Degraded forests constitute India’s 41% of total forest cover. Thus, the role of land-use, land-use change and forestry LULUCF activities are recognized during COP21. Following the principles of COP21, afforestation (planting trees) of the degraded lands of India is a viable task that can be undertaken to combat the dangerous impacts of anthropogenic interference with climate system. The degraded lands of India can be brought under vegetative cover with reasonable effort [1,2] and also for generation of specific plant types required for production of renewable sources of energy like bio-fuel e.g. soya bean, thus reducing country’s dependence on petroleum diesel1. |
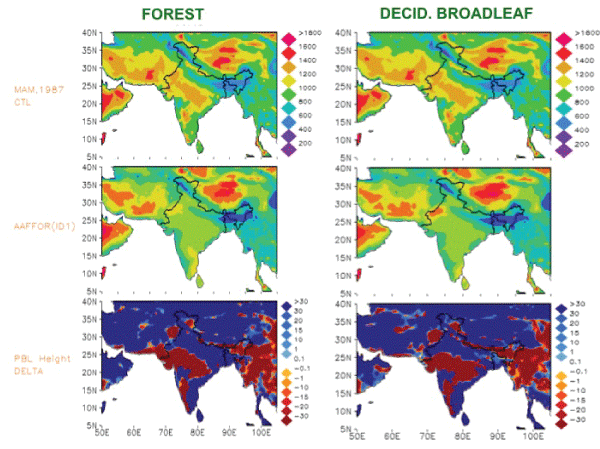
| Xue and Shukla [3] suggest that afforestation over Sahel would enhance the rainfall. Ma Di et al. [4] studies short-term impacts of afforestation in East Asian monsoon region and confirms maximum 7% increase in the month of April. These studies form the paradigm that generally rainfall enhancement is associated with afforestation. Simultaneously, studies like Goswami et al. [5], and particularly Niyogi et al. [6] suggests that in the present era due to agricultural intensification over northern NI and peninsular India PI, early Indian summer monsoon ISM rainfall over India could be reducing. Ma D et al. [7] reports the impact of afforestation in northern China and found increased precipitation, relative humidity, and soil moisture and reduced wind speed and air temperature. But afforestation at different latitudes can induce different effects on climate. This prompts the motivation for the present study, which is performed by changing the land use pattern in the ICTP, BATS Bio-sphere Atmosphere Transfer scheme coupled RegCM4.0 climate model, incorporating afforestation impact on Indian monsoon domain. |
| Brief about Indian monsoon forests2 |
| The various types of forests found in the India can be broadly classified into |
| • Tropical rain forests |
| • Temperate deciduous forests |
| Diversity of these forests range from the rainforest of Kerala in the south to the alpine pastures of Ladakh region in the north, from the deserts of Rajasthan in the west to the evergreen forests in the northeast. The tropical forests incur heavy rainfall in its region. The Indian Deciduous forests, which seasonally shed all their leaves, are the most abundantly found among all the different types of forests in India. They are found in a range of landscapes from the plains to the hills and occur as Sal dominated forests in the foothills of Himalaya and Central India, and are teak forests in the Deccan Plateau. They are extremely important for human resource use. As discussed in previous section, deforestation is one of the causes of global warming and as a result of global consensus to combat global warming, afforestation/ reforestation of forested regions of India is to be adopted. Jha Somnath [1] reports probable impact of afforestation of wastelands of India particularly northwestern regions of India on rice yield of India. Palm 2009 says that 70% of the degraded land lies in the district of Tumkur in Karnataka, India. Thus, land degradation and forest fragmentation over India possesses risk for forest ecosystems. Thus, there is a huge potential of carbon credit generation in India due to its large wasteland. Afforestation affects the terrestrial and atmospheric segments of land atmosphere interactions and thus impacts land-ocean thermal contrast thus will impact Indian monsoon circulation. A recent briefing3 also informs about the dangers of wrong accounting framework of land use change and vegetation to potential climate framework development. Also, biodiversity via afforestation measures (Reducing emissions from deforestation and forest degradation REDD+ measures)4 helps in reducing negative effects of climate change by storing carbon. Thus, it is necessary to critically provide some directions to planners accounting impacts of afforestation on Indian monsoon meteorology using a regional climate model, despite previous studies on impacts of irrigation and deforestation [6,8-13]. |
| Methodology: Brief about the Afforestation Design Experiment and its Motivation |
| A calibrated regional climate model RCM version 4.0 of ICTP RegCM4.0 [14] has been and used for the study of impact of afforestation over India. Previously for land surface processes related studies the RCM has been used meritoriously. Indian monsoon features are well simulated by the combination of parameterization schemes employed in earlier studies hence design experiments are done with the same scheme combinations [15-17]. Afforestation and its impact on the atmosphere over the domain are considered as a proxy to the biosphere-atmosphere interaction over the domain. The land use data can be found at link [18]. For this study, the BATS land surface model, is coupled with RegCM4.0. Simple regional climate model design afforestation experiment is done in this study. The terrestrial variables like elevation, land use and sea surface temperature, and three-dimensional meteorological fields zonal wind, meridional wind, air temperature, specific humidity, geo-potential height obtained after NNRP2 boundary forcing and then horizontal interpolating from latitude longitude mesh to high-resolution 90 km Cordex South Asia domain with NORMER projection. Global land cover characterization GLCC data specifies the vegetation for BATS land surface scheme. Regional climate modeling is an appropriate tool to capture the significant change in meteorological variables at a higher resolution, moreover while studying the response of afforestation to BATS land surface model coupled with RCM. During the pre-processing step in setting up the initial fields e.g. soil texture, land use etc a number of flags control the capability of the terrain program to modify the land use, the texture and the lake/land interface ASCII files generated with the help of any text editor. Running the terrain program the second time by setting a fudge flag to true will overwrite the selected variable with the modified value in the ASCII file. This procedure is used to design the two design experiments “RBATS-F” and “RBATS-DB”, explained in detail next. |
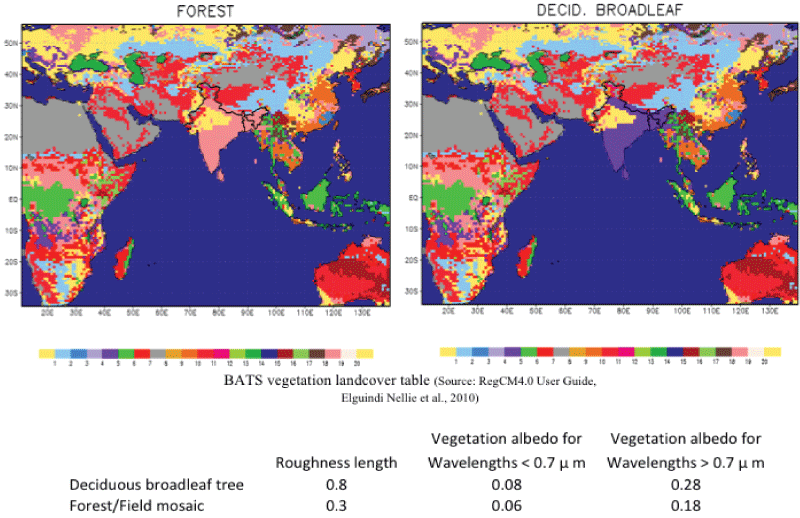
| Figure 1 shows the modified land cover over India for afforestation design experiment with forest and deciduous broadleaf types. The design experiment details can be found in Table 1. In the design experiment “RBATS-F” the chemistry module is active chem=true, idirect=1 whereas in the second design experiment “RBATS-DB” the chemistry module is off. In the “RBATS-F” design experiment, no coupling between dynamic and thermodynamic fields occurs but clear sky surface and top of atmosphere aerosol radiative forcings are diagnosed. Spatial domain along west coast, peninsular India PI, east coast, northeastern regions of India NEI, eastern India EI and Indo-gangetic plains IGP extending upto Punjab has been selected for afforestation in the model to see the impact of afforestation on monsoon meteorology over Indian subcontinent. These regions of afforestation in model are also the regions with decreased forest cover [19]. Afforestation over such a large domain of India, along with previous afforestation and REDD+mechanism related studies motivates to further investigate the change in meteorological and climatic variables, particularly wind and circulation features, surface fluxes, precipitation, foliage and 2-metre temperature [20]. Also the impact of afforestation on onset of ISM and active-weak phases of monsoon is also to be investigated. The RCM was forced with NNRP2 [21] 6-hourly re-analysis data for year 1987 El-Niño year, 2009 El-Niño year and 2010 La-Niña. Followed by “introduction” in section 1 and “methodology” in section 2, results are described in section 3 and “discussion and conclusions” are presented in section 4. |
| Results |
| In order to understand the impact of afforestation on evolution of total precipitation anomaly and the possible role of land-atmosphere interactions over Indian sub-continent, the variation of other meteorological and climate variables like soil moisture, sensible, latent heat flux, foliage temperature, ground temperature and 2-metre temperature, planetary boundary layer PBL height, surface pressure and convective precipitation have to be realized and investigated. |
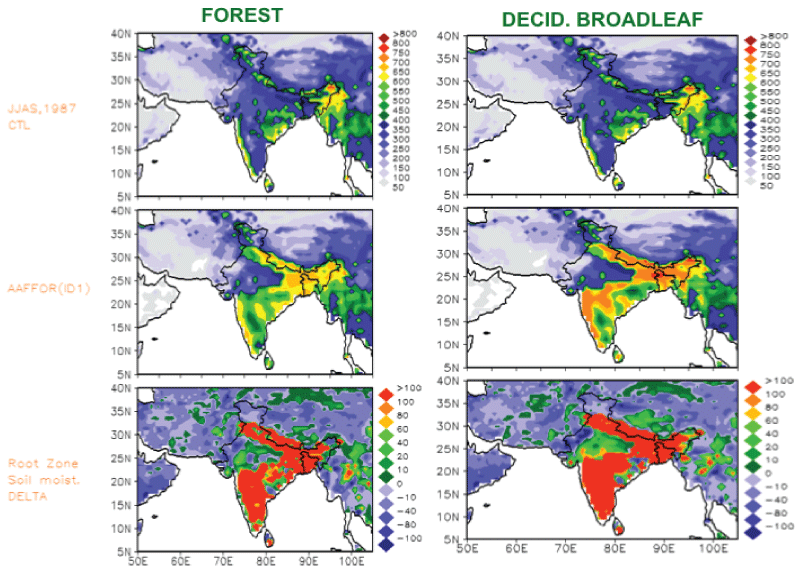
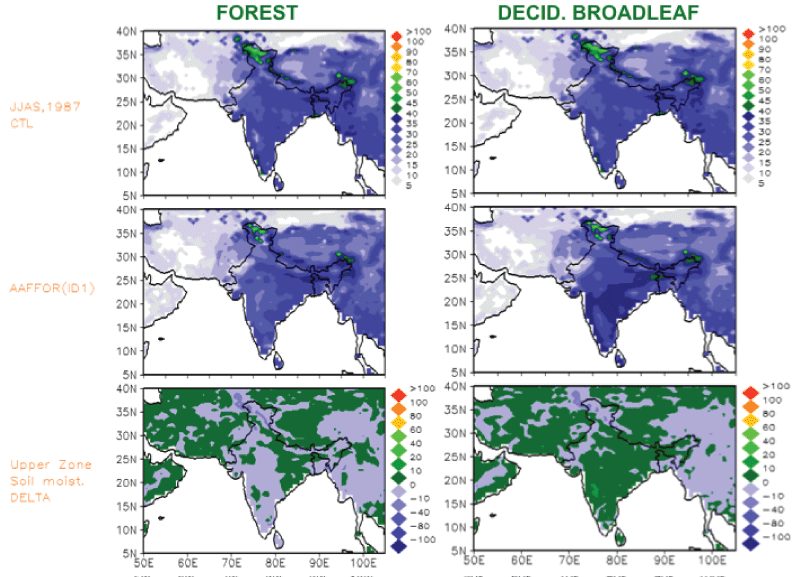
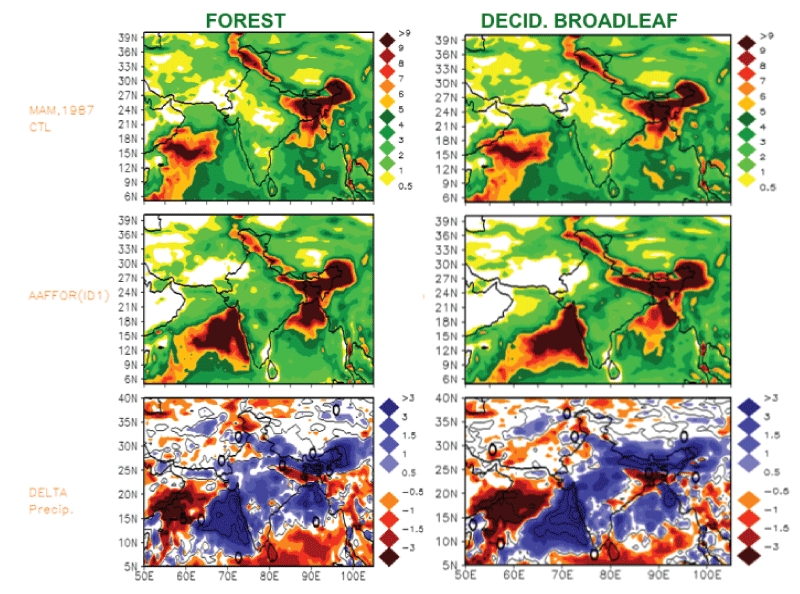
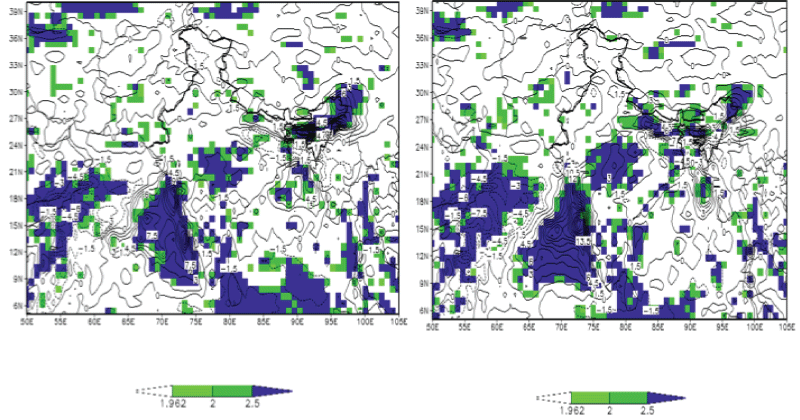
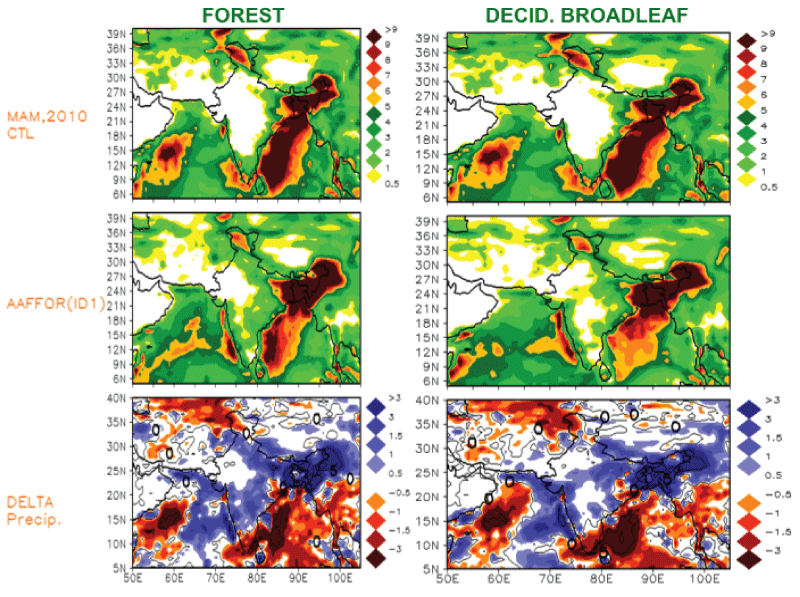
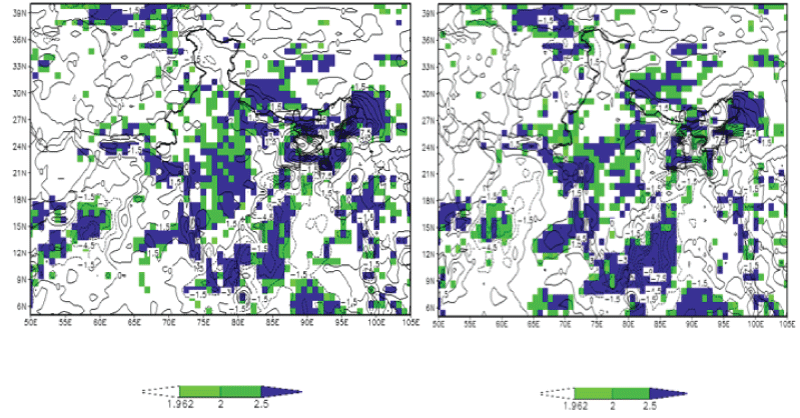
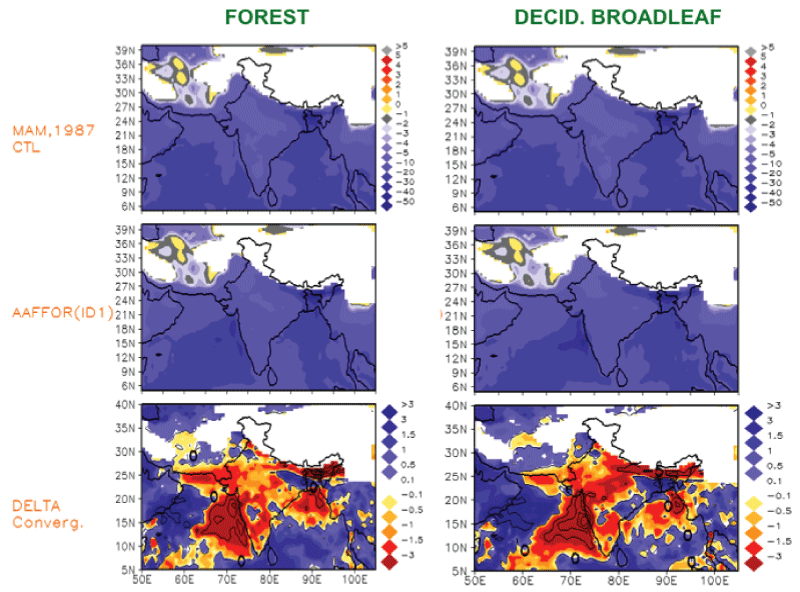
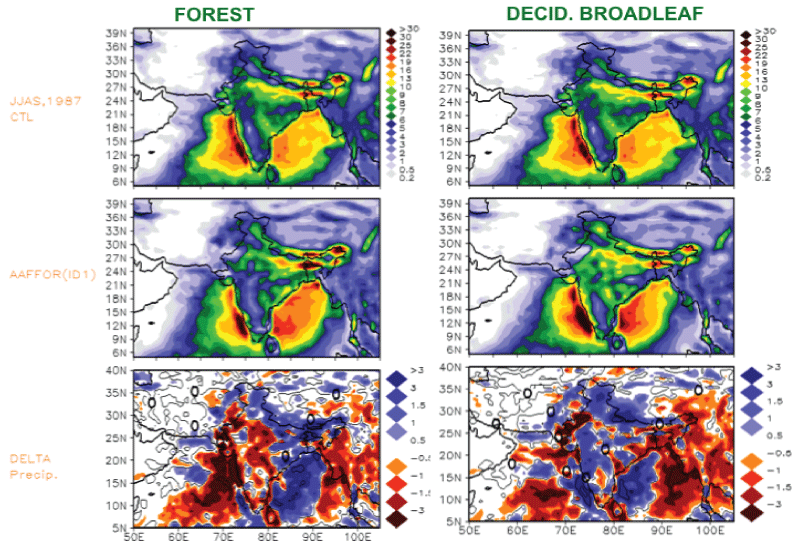
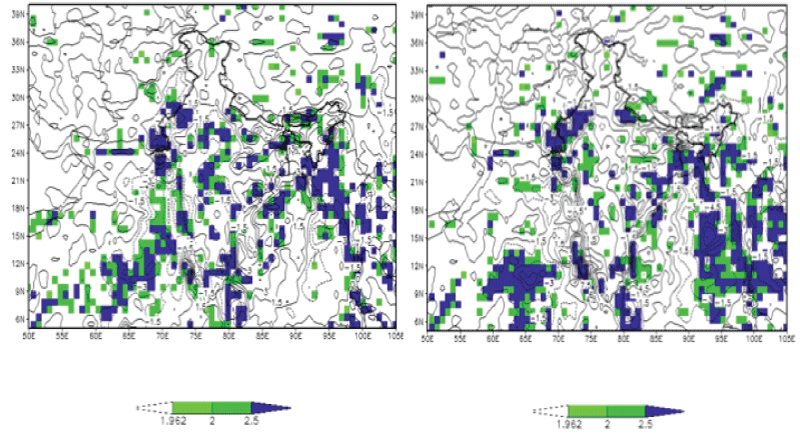
| From Figure 1b, it is observed that due to afforestation over India there is increase in root zone soil moisture (~100 mm) primarily over those regions where afforestation was done in the model. Consequently, the upper zone soil moisture increases over India ~20 mm in the “RBATS-DB” simulation Figure 1c. During the march-april-may MAM season, total precipitation increases over arabian sea AS, bay-of-bengal BOB and Indian Land Region, (western ghats WG, central india CI and indo-gangetic plains IGP) by +1 to +3 mm/day. Figures 2a, 2b, 2g, 2h, 2m shows the differences in total precipitation for MAM, JJAS and OND season of year 1987 respectively. The increase in precipitation over CI, WG and northeastern parts of India during MAM season is significant at 99% level of significance (Figures 2b and 2d)5. Figures 2c and 2d explains the difference in total precipitation for MAM, 2010 season for forest and deciduous broadleaf type design experiment, respectively. Thus, during spring season MAM over India there is increase in precipitation by +0.8 to +1.49 mm/day (Tables 2 and 3). |
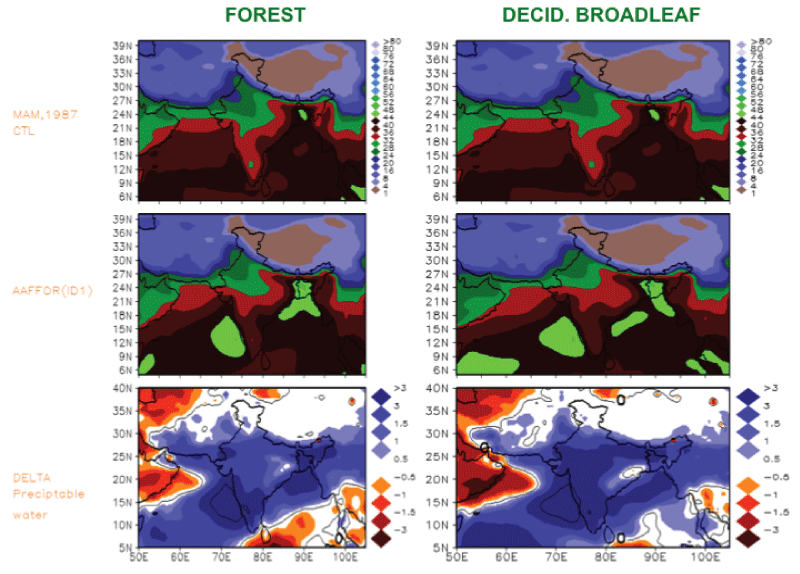
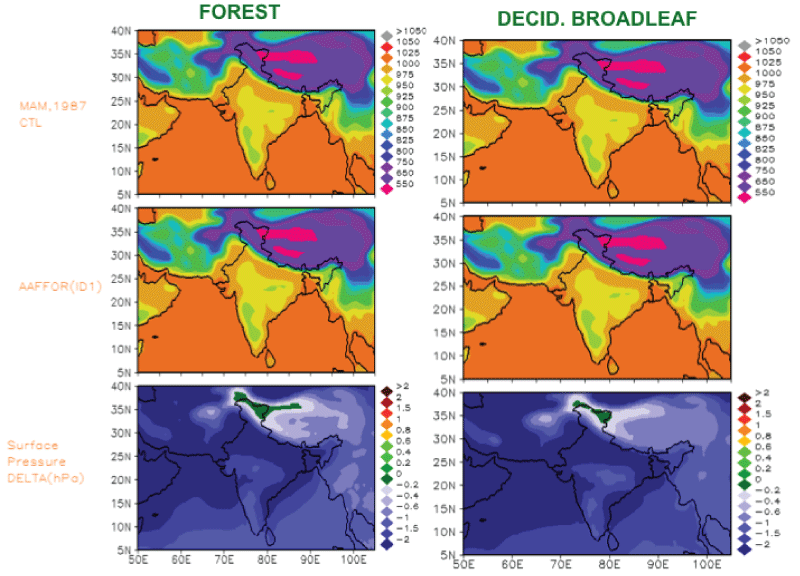
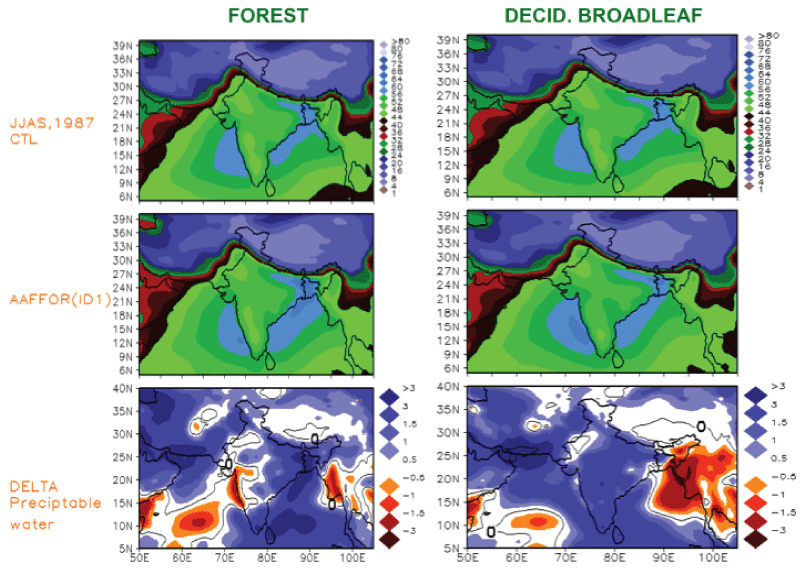
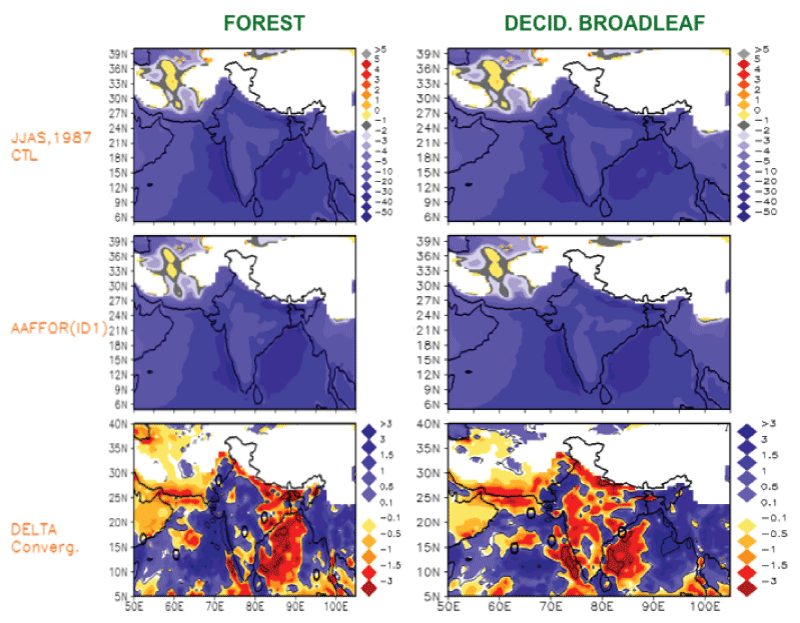
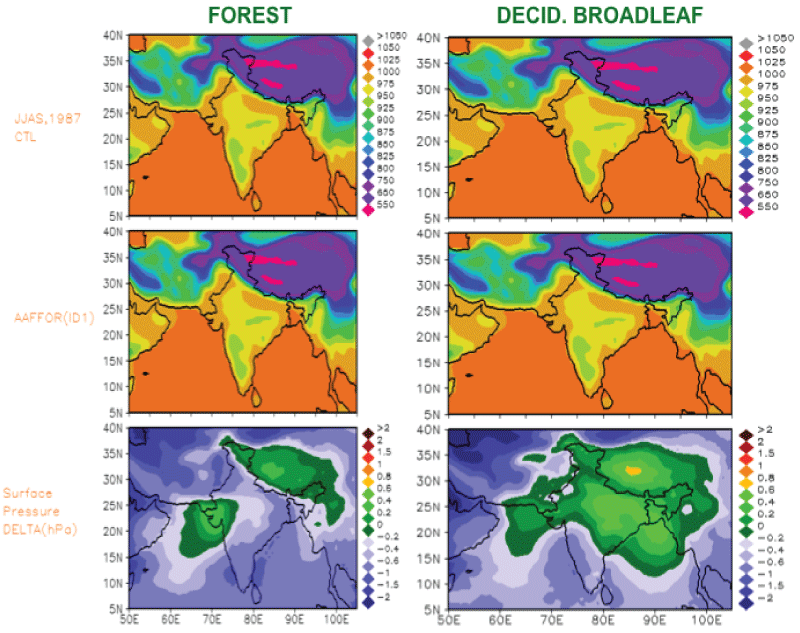
Further two parameters viz. precipitable water and convergence of vertically integrated water vapor flux are used to evaluate the impact of afforestation on precipitation6. Precipitable water6 explains total amount of water vapor in a column or some portion of a column of the atmosphere, measured as if it all fell to the ground as precipitation and can be expressed as  ,where Q is specific humidity. Convergence of vertically integrated water vapor flux in calculated using water vapor conservation equation and is defined as, evapotranspiration-precipitation -ΔQ. Here, -ΔQ is change in vertically integrated specific humidity [10]. Figures 2e and 2j shows that due to afforestation, precipitable water increases by ~2 mm and ~0.92 mm over Indian monsoon domain during MAM and JJAS season of 1987, respectively Tables 2 and 3. Convergence of vertically integrated water vapor Figure 2f map shows that convergence of water vapor flux increases over India and AS, during MAM 1987 season. Here negative (positive) values show increase (decrease) in convergence of water vapor flux in a grid box [10]. From Figure 2g it is observed that during MAM season in both the design experiments due to afforestation, surface pressure decreases by 2hPa over whole India domain. ,where Q is specific humidity. Convergence of vertically integrated water vapor flux in calculated using water vapor conservation equation and is defined as, evapotranspiration-precipitation -ΔQ. Here, -ΔQ is change in vertically integrated specific humidity [10]. Figures 2e and 2j shows that due to afforestation, precipitable water increases by ~2 mm and ~0.92 mm over Indian monsoon domain during MAM and JJAS season of 1987, respectively Tables 2 and 3. Convergence of vertically integrated water vapor Figure 2f map shows that convergence of water vapor flux increases over India and AS, during MAM 1987 season. Here negative (positive) values show increase (decrease) in convergence of water vapor flux in a grid box [10]. From Figure 2g it is observed that during MAM season in both the design experiments due to afforestation, surface pressure decreases by 2hPa over whole India domain. |
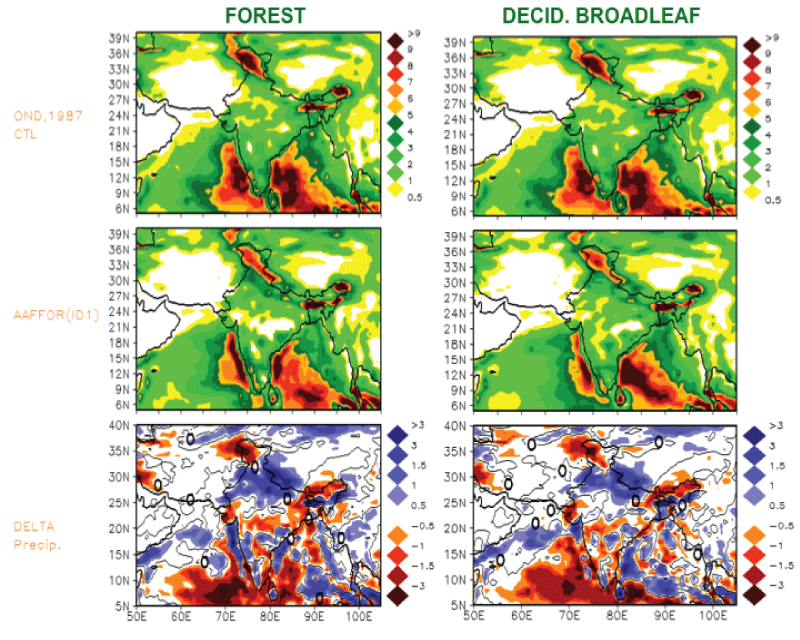
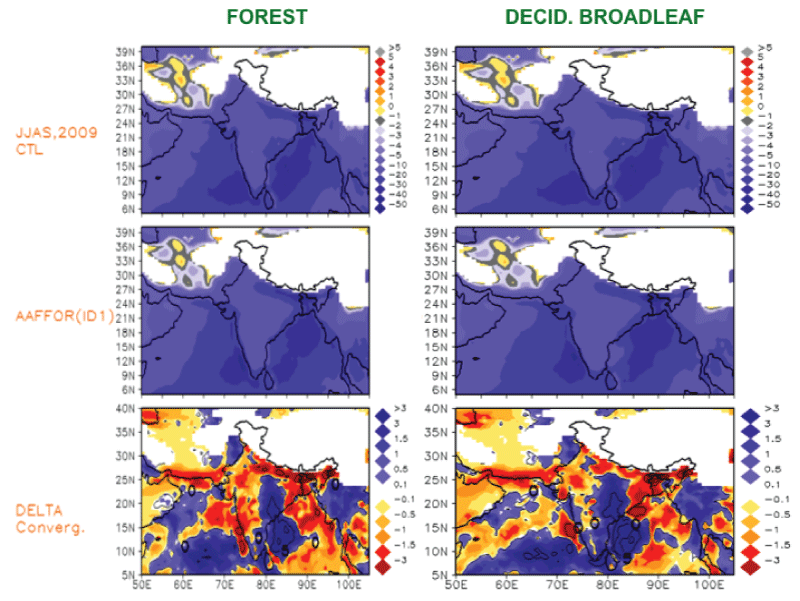
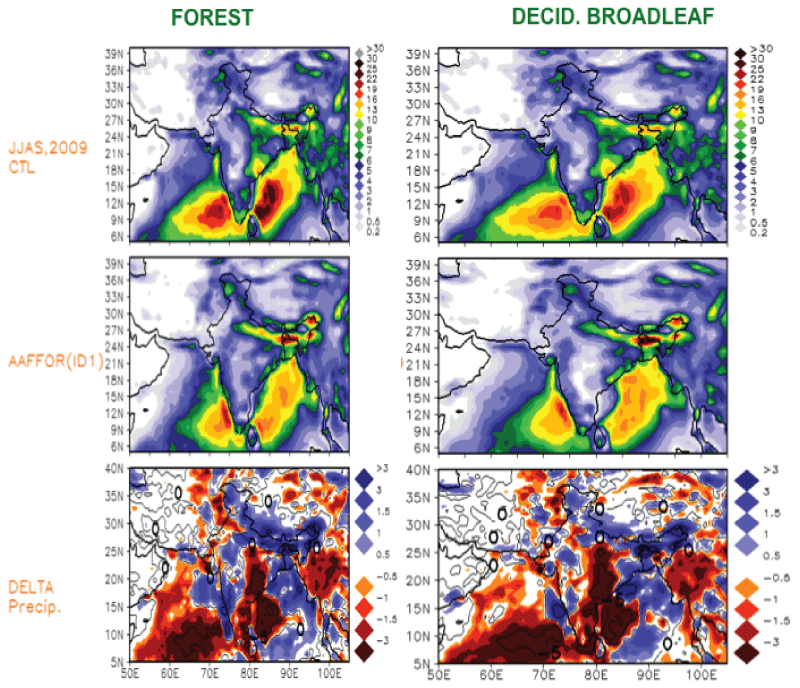
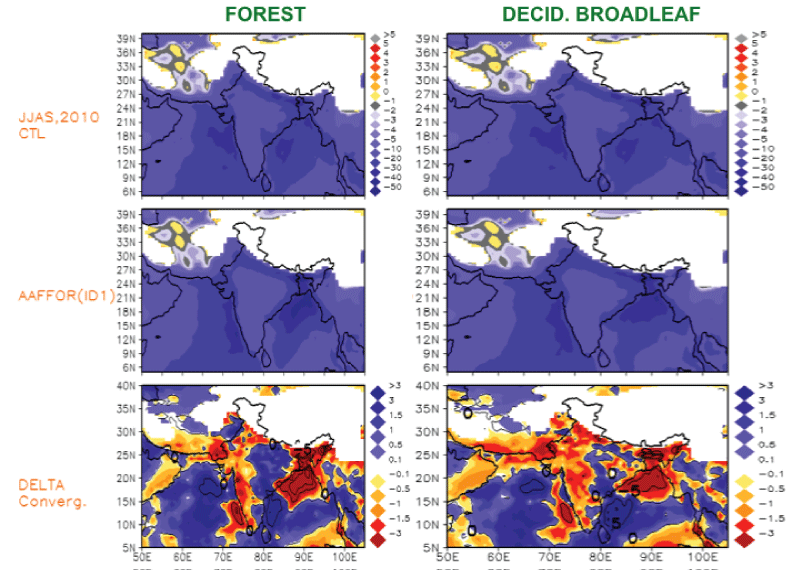
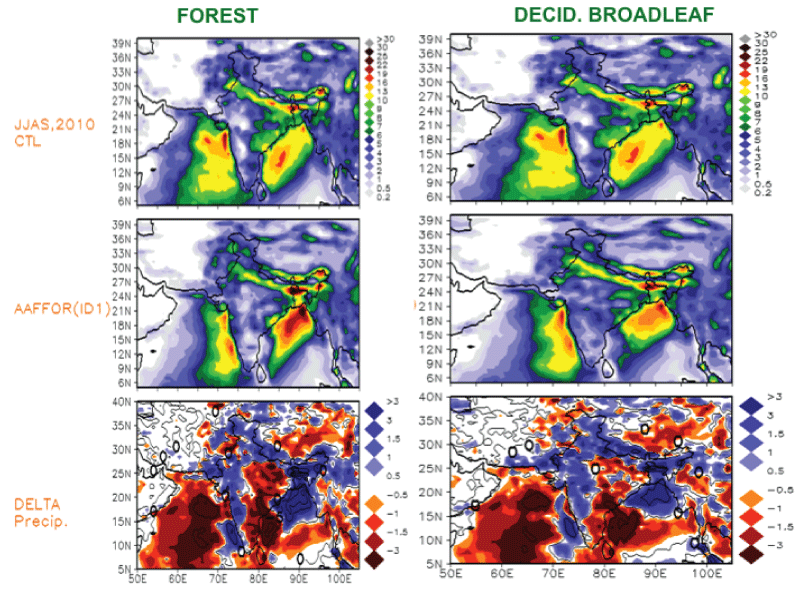
| During the June-July-August-September JJAS season, in the “RBATS-F” design experiment increase in precipitation is observed only over EI, IGP and BOB, whereas in the “RBATS-DB” design experiment precipitation increase over CI, IGP, WG, EI (Figure 2h). But there is decrease in total precipitation over northwestern regions NWP of India, significant at 99% level of significance (Figure 2i). It is observed from Figures 2j and 2k that during JJAS-1987, precipitable water and convergence of vertically integrated water vapor, increases over the regions where afforestation is done in the model. During JJAS season there is decrease in surface pressure over the India domain except some regions like EI and head BOB (Figure 2l). During the octobernovember- december OND-1987 season increase in precipitation is seen only over western Himalayas and adjoining NI region (Figure 2m). From Figures 3a and 3d, it is observed that during the JJAS season of 2009 and 2010, the grid boxes where convergence of water vapor flux decreases increases, precipitation also decreases increases. But precipitable water increases over whole of Indian domain during both MAM and JJAS season of 2009 and 2010 Figure not shown. |
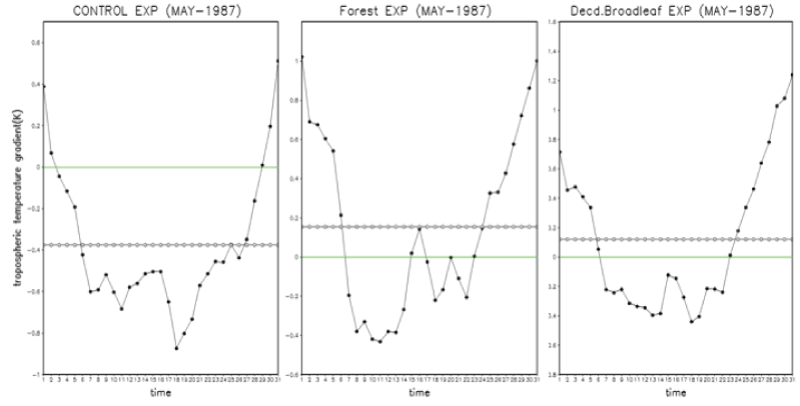
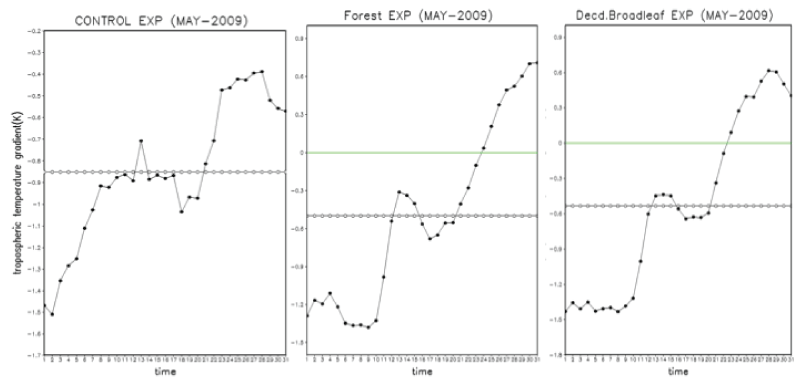
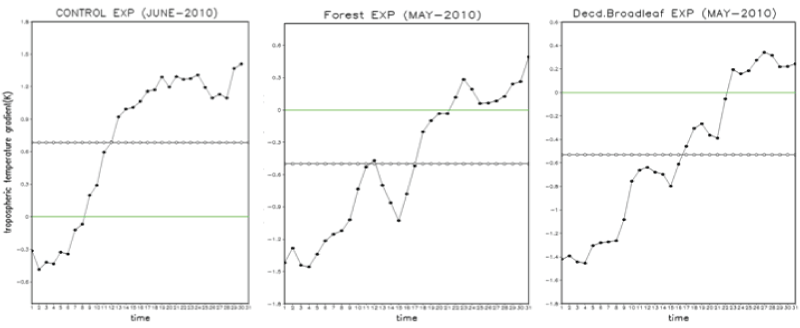
| Measure of the gradient in tropospheric temperature is used to calculate the onset date [5]. According to Goswami et al. [5], onset is declared when TTG changes sign from negative to positive. During the year 1987, onset date in the control and design experiments is on 29th and 24th of the May month, respectively. During the year 2009, onset date in the control and design experiments is on 20th and 12th of the May month, respectively. During the year 2010, onset date in the control and design experiments is on 8th June 2010 and 22nd May 2010, respectively. There is a caution to the readers, all these onset dates are not the exact dates declared by IMD, but are just tentative dates calculated using TTG from model data. From Figure 4a-4c, it can be seen that in the afforestation design experiments the monsoon onset date is advanced by ~1-1.5 week (approximately). |
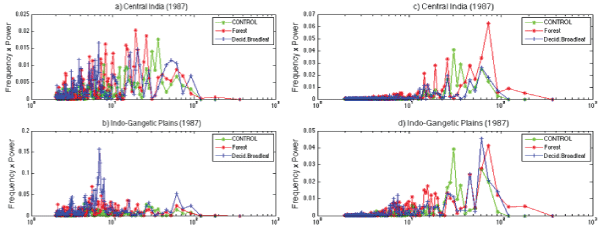
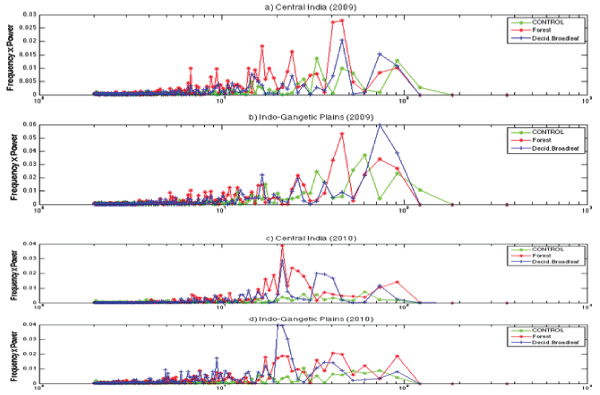
| Rajeevan et al. [22] says that break phases of monsoon are associated with 20 to 30 days signal and 30 to 60 days signal. Previous study reports that active and weak phase of monsoon are the modes of variability of monsoon intraseasonal oscillation [23,24], modulated by Madden-Julian oscillation. From the power spectra charts Figures 4d and 4e of CI and IGP precipitation and soil moisture in the two afforestation design experiments it is observed that an active and weak phase of monsoon is not affected by afforestation over India as the power density during the break phases of the monsoon is not reduced in the two afforestation design experiments. But from Figure 4e it is observed that signature of soil moisture power spectra bear similar structure as precipitation power spectra, both over CI and IGP domain. |
| Hence, temporal characteristics of monsoon oscillations are affected by soil moisture, especially vegetal feedbacks. |
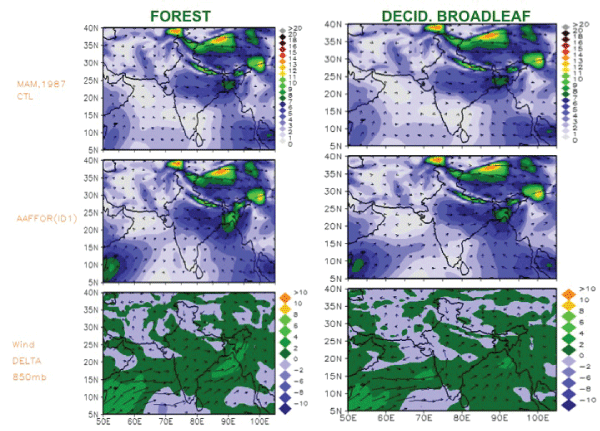
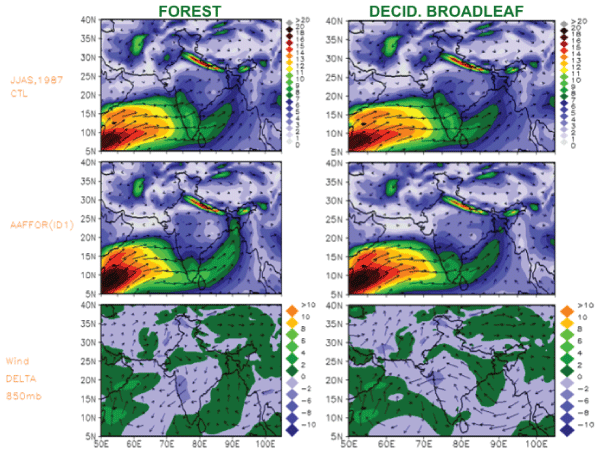
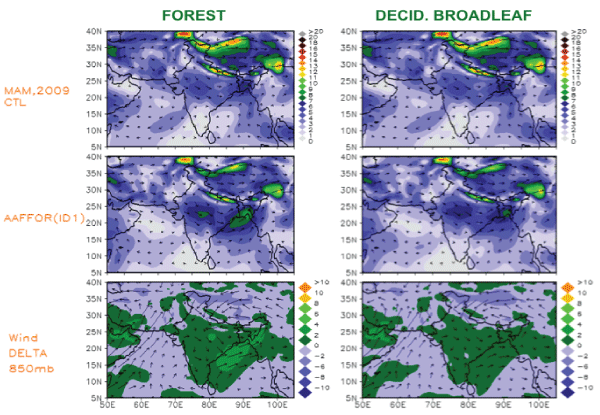
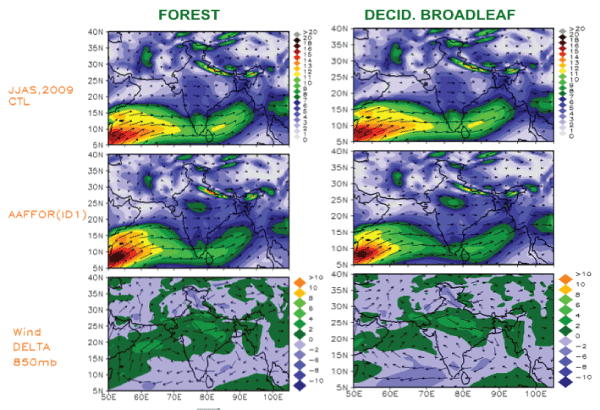
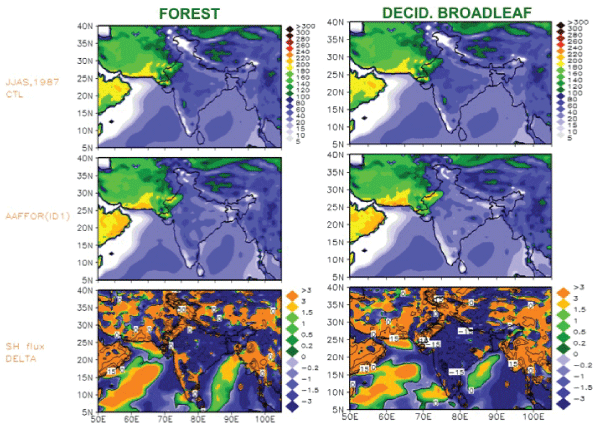
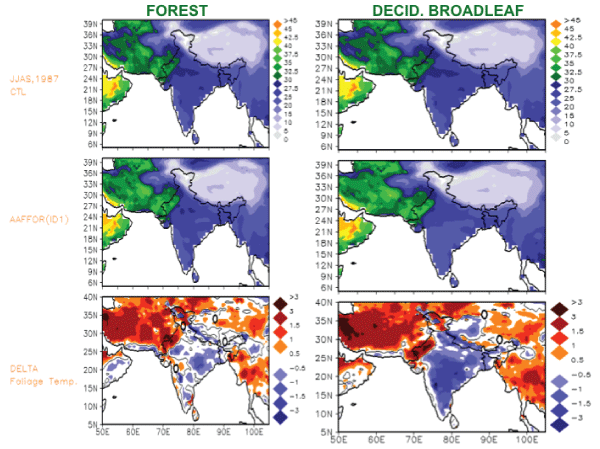
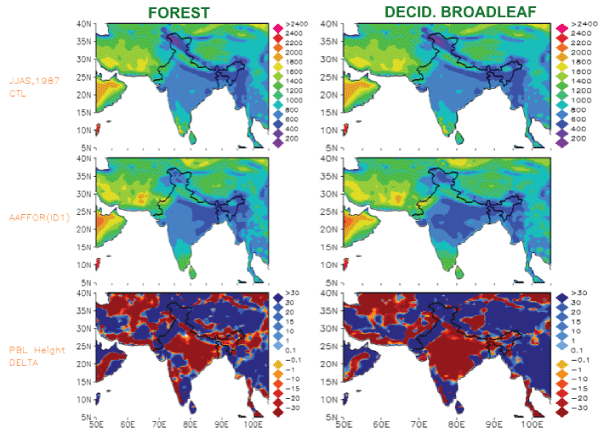
| From Figures 5a-5d, positive anomalous wind circulations are seen over Indian land region during MAM 1987, 2009 season, with a tendency to form cyclonic circulations, whereas during JJAS-2009 season there is tendency to form anti-cyclonic positive anomalous circulations. Thus, afforestation during MAM-1987 season wind speed increases vertically upto ~850 hPa induces ascending air motion, whereas during JJAS season decreases wind speed upto ~850 hPa also induces ascending air motion [7]. During JJAS season in the design experiments, sensible heat flux, foliage temperature, ground temperature, 2-metre temperature and PBL height also decrease over Indian land region Figures 6a-6d, whereas during MAM season PBL height increases over the afforested region of India i.e. in the design experiments. This may produce more clouds and precipitation. The decrease in 2 meter-temperature is during MAM, JJAS and OND season of 1987, 2009 and 2010, but during JFM 2010 there is increase in temperature. |
| Discussions and Conclusions |
| Assessment of modeling the impact of reforestation or afforestation on the Indian monsoon meteorology is studied using regional climate model. Experiments are designed using regional climate model RegCM4.0-BATS. It is pertinent to mention here once again that in this study, the chemistry module is active during the “RBATS-F” design experiment whereas in the second design experiment “RBATSDB” the chemistry module is off. The present study reiterates results from previous afforestation related studies [4] shows that afforestation accelerates significant moisture transport and increase in precipitation. In both the afforestation design experiments there is increase in total and convective precipitation MAM and JJAS over India and also ground and 2-metre temperature decreases. Increase in PBL height during pre-monsoon MAM season over the afforested regions, coupled with increase in wind magnitude and circulation results in instability of moist parcel over afforested region. Hence, afforestation positively impacts regional Indian monsoon meteorology during premonsoon, monsoon and post monsoon season. Decrease in foliage temperature shows that planting trees to mitigate climate change causes cooling and also protects bio-diversity of the India subcontinent [23]. A proposed mechanism based upon results obtained is given below: Increase in afforestation over India → Increase in precipitable water → Increase in convergence of vertically water vapor → Increase in low level winds over afforestation sensitivity region → Increase in LHF and decrease in SHF → Decrease in 2-metre and surface temperature/ground temperature → Decrease in land–sea temperature contrast → Increase in March- April-May precipitation over CI statistically significant but decrease in summer monsoon precipitation (JJAS) over the Indian land region [11]. |
| During the JJAS season most of the circulations over land region is not getting enough energy for intensification. This conclusion can be drawn as it is observed that convergence decreases over the afforested regions during the JJAS season. Hence, preserving ecosystems while increasing agricultural production and pattern i.e. shifting agriculture and cutting forest trees for agricultural land remains a central challenge for sustainable development. Hence, the research outcome of this research study helps to explain that how afforestation could mitigate the impacts of climate change and need for strategic initiatives. Thus, increase in afforestation over India results in increase in precipitation statistically significant only during spring MAM season, soil moisture, convergence of vapor flux and reduced air temperature, 2-meter temperature, foliage temperature. |
| Acknowledgements |
| The author is grateful to Institute student fellowship GATE provided by MHRD Govt. of India. Also acknowledged the central cloud-computing (Baadal) facility available at Computer Services Centre, IIT Delhi for the regional climate model simulations. The author is equally thankful to International Centre for Theoretical Physics, Trieste, Italy for making the regional climate model codes of RegCM4.0 freely available for this research study and NCEP/NCAR for providing highresolution meteorological datasets. The Grid Analysis and Display System GrADS version 2.0 software is used for plotting. The author expresses his gratitude towards Dr. H.C. Upadhyaya for his suggestions to improve the write-up of the study. Wealth of online resource available at www.google.com, scholar.google.com was also helpful. The author also acknowledges the editor, editorial assistant and anonymous reviewers of this manuscript for their critical review and suggestions. |
| 1www.dolr.nc.in/dolr/bio_diesel.asp |
| 2http://www.indianetzone.com/2/indian_forests.htm |
| 3http://globalforestcoalition.org/new-briefing-paper-highlights-dangers-of-afraudulent- accounting-framework-on-land-use-to-potential-climate-agreement/ |
| 4https://www.cbd.int/forest/redd-plus/default.shtml |
| 5The statistical significance is calculated using “t-test statistic” for a twosample difference of means test and the grid cells that are significant are shaded. It is assumed that the population variances are equal (http://ccr.aos. wisc.edu/resources/data_scripts/data_processing/grads/grads_statsig.php) |
| 6http://www.iges.org/grads/gadoc/gadocindex.html |
References
- Somnath J (2012) Diagnostics OfBiosphere-Atmosphere interfacing in Indian Agro-Climate regime. Centre for Atmospheric Science, IIT, Delhi.
- Palm M (2009) Land use in climate policy-forest based options at local level with cases for India. University of Gothenburg, Sweden.
- YongKang X, Shukla J (1994) The Influence of Land Surface Properties on Sahel Climate. Part II- Afforestation. Journal of Climate (American Meteorological Society) 9: 3260-3275.
- Di M, Notaro M, Liu Z, Chen G, Liu Y (2012) Simulated impacts of afforestation in East China monsoon region as modulated by ocean variability. Clim Dynamics 41: 2439-2450.
- Goswami BN, Xavier Prince K, Marzin C (2007) Anobjective definition of the Indian summer monsoon season and a new perspective on the ENSO-monsoon relationship. Quarterly Journal of the Royal Meteorological Society133: 749-764.
- Niyogi D, Kishtawal C, Tripathi S, Govindaraju RS (2010) Observational evidence that agricultural intensification and land use change may be reducing the Indian summer monsoon rainfall. Water Resource Res 46: W03533.
- Ma D, Liu ZY, Lü SH, et al (2013) Short-term climatic impacts of afforestation in the East Asian monsoon region. Chinese Science Bulletin 58: 2073-2081.
- Douglas Ellen M, DevNiyogi S, Frolking JB, Yeluripati A, Roger A, et al. (2006) Changes in moisture and energy fluxes due to agricultural land use and irrigation in the Indian Monsoon Belt. Geophysical Res Letters 33: L14403.
- Douglas EM, Beltrán-Przekurat A, Niyogi D, PielkeSr RA, Vörösmarty CJ (2009) The impact of agricultural intensification and irrigation on land–atmosphere interactions and Indian monsoon precipitation-A mesoscalemodeling perspective. Global and Planetary Change 67: 117-128.
- Saeed F, Hagemann S, Jacob D (2009) Impact of irrigation on the South Asian summer monsoon.Geophys Res Letters 36: L20711.
- Lee E,ChaseTN,RajagopalanB,BarryRG,BiggsTW,Lawrence PJ (2009) Effects of irrigation and vegetation activity on early Indian summer monsoon variability. Int J Climatology 29: 573-581.
- Lee E, Sacks WJ, Chase TN, Foley JA (2011) Simulated impacts of irrigation on the atmospheric circulation over Asia. J Geophys Res 116: D08114.
- Devaraju N, Bala G, Modak A (2015) Effects of large-scale deforestation on precipitation in the monsoon regions: Remote versus local effects 112: 3257-3262.
- Nellie E, Bi X, Giorgi F, Nagarajan B, Pal J, et al. (2010) RegCM Version 4.0 Core Description. The RegCM Team Trieste, Italy.
- Lodh A, Raghava R, Singh K, Kumar S (2014) Climatology of Atmospheric Flow and Land Surface Fields of Indian Monsoon Captured in High Resolution Global and Regional Climate Model. Journal of Earth Science and Climate Change S11:007.
- Lodh A (2015) Studying Himalayan snow - Indian monsoon relationship by some LULCC change sensitivity experiments in RegCM4.0. International Journal of Geology and Earth Sciences 1.
- Lodh A (2015) Impact of Caspian Sea Drying on Indian Monsoon Precipitation and Temperature as Simulated by RegCM4 Model. Hydrology Current Research 6:217.
- http://users.ictp.it/~pubregcm/RegCM4/globedat.htm#part5
- Jha CS, Dutt CBS, BawaKS (2000) Deforestation and land use changes in Western Ghats, India. Current Science 79: 231-238.
- Popp A, Humpenöder F, Weindl I, Bodirsky BL, Bonsch M, et al. (2014)Land-use protection for climate change mitigation. Nature Climate Change 4:1095-1098.
- Kanamitsu W, Ebisuzaki J, Woollen SK, Yang JJ, HniloM, et al. (2002) NCEP-DEO AMIP-II Reanalysis (R-2) 21631-1643. Bulletin of the Atmos Met Soc.
- Rajeevan M, Gadgill S, Bhate J (2010) Active and break spells of the Indian summer monsoon. Journal of Earth system Sciences 119: 229-247.
- Neena JM, Suhas E, Goswami BN (2011) Leading role of internal dynamics in the 2009 Indian summer monsoon drought. J Geophys Res 116: D13103.
- Qi Y, Zhang R, Li T, Wen M (2008) Interactions between the summer mean monsoon and the intraseasonal oscillation in the Indian monsoon region. Geophys Research Letters 35: L17704.
|
 ,where Q is specific humidity. Convergence of vertically integrated water vapor flux in calculated using water vapor conservation equation and is defined as, evapotranspiration-precipitation -ΔQ. Here, -ΔQ is change in vertically integrated specific humidity [10]. Figures 2e and 2j shows that due to afforestation, precipitable water increases by ~2 mm and ~0.92 mm over Indian monsoon domain during MAM and JJAS season of 1987, respectively Tables 2 and 3. Convergence of vertically integrated water vapor Figure 2f map shows that convergence of water vapor flux increases over India and AS, during MAM 1987 season. Here negative (positive) values show increase (decrease) in convergence of water vapor flux in a grid box [10]. From Figure 2g it is observed that during MAM season in both the design experiments due to afforestation, surface pressure decreases by 2hPa over whole India domain.