Research Article Open Access
Overview of the Beef Cattle Industry in China: The widening Deficit between Demand and Output in a Vicious Circle
Han X.P1, Hubbert B2, Hubbert ME2 and Reinhardt CD3*
1Technology Extension Station of Animal Husbandry of Qinghai, China.
2Clayton Livestock Research Center, New Mexico State University, Clayton, New Mexico.
3Department of Animal Sciences and Industry, Kansas State University, Manhattan, Kansas, USA.
- *Corresponding Author:
- Reinhardt CD
Department of Animal Sciences and Industry
Kansas State University
Manhattan, Kansas, USA
Tel: 785-532-1672
E-mail: cdr3@ksu.edu
Received Date: April 11, 2016; Accepted Date: June 13, 2016; Published Date: June 30, 2016
Citation: Han X, Hubbert B, Hubbert ME, Reinhardt CD (2016) Overview of the Beef Cattle Industry in China: The widening Deficit between Demand and Output in a Vicious Circle. J Fisheries Livest Prod 4:190. doi: 10.4172/2332-2608.1000190
Copyright: © 2016 Han X, et al. This is an open-access article distributed under the terms of the Creative Commons Attribution License, which permits unrestricted use, distribution, and reproduction in any medium, provided the original author and source are credited.
Visit for more related articles at Journal of Fisheries & Livestock Production
Abstract
This article introduces current situation of the beef cattle industry in China via its sorted industry, changed inventory and beef production variation. To make the situation more understandable, its advantages and disadvantages are presented from its producer size, indigenous cattle breeds and shrinked inventory with resource shortage of calves for feedlot. Whats more, this paper boiled basically the developing trends into widening deficit between beef import and export, widening margin of output-to-consumption, rapidly increasing average beef consumption and sharp rise beef price. Consequently, we held that the per capita beef consumption in China is fastly increasing, which makes the margin between output and consumption widen gradually, while the low productivities and shrinked cattle inventory making the conditions worse. Under such a condition, the deficit between import and export is expanding. Finally, we suggest that China should supports and extends more applied research works to improve cattle productivities. Besides, China should pay extra attention to standardized production system building and calf-crop operations.
Keywords
China; Beef cattle; productivity; Feedlot
Introduction of the Beef Cattle Industry in China
Cattle raising categories in China
As one of the most populous developing countries in the world, China (in this paper, China refers to China mainland only) has a rapidly-growing cattle industry (including specialized breeds, which include both industrial strains and indigenous breeds, not including buffalo). The breeds are found more commonly in distinctly different agricultural regions of the country which can be divided into three different categories according to the feed resources and environmental conditions extant in those respective regions [1] farming regions, pastoral regions, and farming-pastoral regions. Cattle producers in farming regions formulate the diet for their cattle based mainly on crop residues and grains; operators in pastoral regions graze cattle on pastures with only limited supplementation; producers from farming pastoral-regions graze cattle on the grassland during the daytime and confine cattle during the evening during which time they provide supplements in pens in the form of self-produced grains and crop residues.
Rapid growth in inventory during the past 3 decades
China is one of the largest cattle producing nations in the world, with an inventory of 113.5 million head in 2013, which is third, globally, behind Brazil and India. From 1978 to 2013, the number of cattle in China increased by 60.7 million head, or 115.3%. The beef cattle inventory reached an historic peak of 121.3 million head in 2010, then began to decrease slightly. Brazil had a more rapid increase during this same period than did China, but has remained fairly stable since 2005, while there were fluctuations in India and the United States of America (Figure 1). Regardless, there is an obvious downward recent trend for the cattle inventory in China since 2010 [2].
Rapid development in beef production
As shown by Figure 2, meat production in China has increased an average of 6.3% annually between 1978 and 2013, which has been accompanied by a considerable increase in the production of beef, poultry, sheep and goats, and pork. The output of beef increased 10.5% per year from 196.7 thousand tons in 1978 to 6.4 million tons in 2013, while pork, sheep and goat, and poultry had increased annually by 5.5%, 7.5% and 7.9% respectively. During the past 35 years, the meat production structure of China has changed dramatically. The percentage of pork in total meat production decreased from 81.7% to 63.3%, while poultry, sheep and goat, and beef production increased by 9.2%, 1.7%, and 5.7% respectively (Figure 3). This trend indicates that the production structures of the domestic animal industry are gradually changing.
Weakness of Beef Cattle Industry in China
Low-performance in beef productivity
From 1978 to 2013, there was a major increase in both cattle inventory and cattle meat production in China. The inventory of cattle has increased annually by an average of 2.2%, while beef production has increased by 10.5% annually, which indicates that beef production per head has improved rapidly, from 3.7 kg per animal in 1978 to 56.2 kg per animal in 2013 (Figure 4). However, China still lags behind the United States, which has the greatest beef productivity per head among the top 4 countries based on cattle inventory. The United States currently produces 122.3 kg per animal, which is about 2.2 times as much as China. These results show that China likely has greater production costs per kilogram of beef than the U.S., and is not as competitive in the world beef market.
Small size farm is the main composition of cattle operation in China
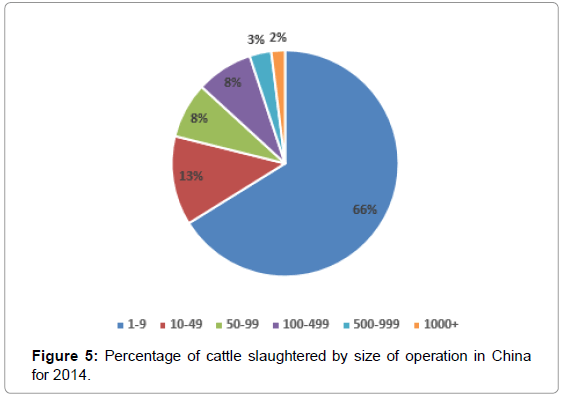
From Table 1 we can conclude that more than 90% of China`s cattle operations slaughter 9 or fewer cattle per year [3]. If we assume that average number of cattle slaughtered in each size category is equal to the median of that size, as shown in Table 2, we see that operations that slaughtered 9 or fewer cattle yearly are responsible for over 50% of the cattle industry in China. Therefore, we can see that small farms are a major component of the Chinese cattle industry (Figure 5).
| Sorted percentage by farm size | 2009 | 2010 | 2011 | 2012 | 2013 | 2014 |
|---|---|---|---|---|---|---|
| 1-9 | 91.69% | 96.03% | 95.67% | 95.65% | 95.42% | 95.29% |
| 10-49 | 3.23% | 3.22% | 3.46% | 3.44% | 3.57% | 3.68% |
| 50-99 | 4.94% | 0.56% | 0.66% | 0.67% | 0.76% | 0.76% |
| 100-499 | 0.13% | 0.15% | 0.18% | 0.21% | 0.22% | 0.23% |
| 500-999 | 0.02% | 0.02% | 0.03% | 0.03% | 0.03% | 0.03% |
| 1000+ | 0.01% | 0.01% | 0.01% | 0.01% | 0.01% | 0.01% |
| Total number of operations | 14482619 | 13545300 | 13094889 | 12653076 | 12337255 | 11604365 |
Table 1: Number of cattle operations sorted by size of operation.
| Percentage by operation size | 2009 | 2010 | 2011 | 2012 | 2013 | 2014 |
|---|---|---|---|---|---|---|
| 1-9 | 47.63% | 71.78% | 69.39% | 68.48% | 66.97% | 66.13% |
| 10-49 | 8.39% | 12.05% | 12.54% | 12.32% | 12.53% | 12.76% |
| 50-99 | 38.46% | 6.32% | 7.21% | 7.16% | 7.96% | 7.95% |
| 100-499 | 3.28% | 5.77% | 6.53% | 7.39% | 7.71% | 8.11% |
| 500-999 | 1.44% | 2.62% | 2.78% | 2.95% | 2.97% | 3.09% |
| 1000+ | 0.81% | 1.46% | 1.56% | 1.71% | 1.85% | 1.96% |
Table 2: Number of cattle slaughtered by herd size in China.
Advantages and disadvantages of indigenous cattle breeds in China
China`s beef cattle industry has many indigenous cattle breeds which can be divided into three general categories according to their production orientation, genetic characteristics, and geographical region where they are predominant: yellow cattle, buffalo, and yak. Yellow cattle have both the widest geographic distribution and the largest population. According to a nation-wide study conducted by the National Animal Husbandry Service of China, there are more than 50 different yellow cattle breeds in China and almost 100 million yellow cattle in China [4]. Yellow cattle have several disadvantages, such as lowproduction performance and low feed conversion ratios. To mitigate these disadvantages, China has introduced many high-performance, foreign, beef cattle breeds into its yellow cattle herds since the 1960s. These introduced breeds mainly include Angus, Limousin, Simmental, Charolais, and Piedmontese. The breed improvement work is gradually increasing productivity of yellow cattle as shown by Figure 4. However, the average productivity of beef production is much lower than in other developed countries because of the large yellow cattle herds. According to the Chinese beef cattle genetic improvement plan for 2015-2025, China has about 1,300 foreign breed or indigenous breed bulls qualified to produce frozen semen, which is far from sufficient to meet the demand for nation-wide breed improvement in a national herd of greater than 113 million animals. The table below compares the production performance of indigenous and foreign cattle breeds [5].
From Table 3 we can conclude that foreign, high-performance breed cattle have greater productivity in birth weight, body weight, average daily gain, and carcass percentage. However, indigenous cattle breeds have some advantages, such as better adaptability to the local environment and less morbidity. There is a likely an advantage to blending the best traits of the introduced breeds with those of the indigenous breeds in China.
| Breed | Production performance |
|---|---|
| Yanbian | Body weight of an adult bull and cow are 644.4 kg and 365.5 kg respectively. From the age of 18 to 24 months, average daily gain averages 813 g. Dressing percentage is 57.7% for cattle slaughtered at 24 of months of age. |
| Luxi | Body weight of an adult bull and cow are 465.5 kg and 365.2 kg. Average daily gain is 610 g for adult cattle. Dressing percentage is 57.3% for cattle slaughtered at 18 months of age, and 58.1% for adult cattle over 24 months of age. Birth weight averages 22-35 kg for males and 18-30 kg for females. |
| Qinchuan | Body weight of an adult bull and cow are 594.5 and 381.3 kg. Average daily gain averages 700 g for adult cattle. Dressing percentage is 58.3% for adult cattle. Birth weight averages 26.7 and 25.3 kg for male and female, respectively. |
| Nanyang | Body weight of and adult bull and cow are 647.9 and 411.9 kg. Average daily gain averages 813 g for adult cattle. Dressing percentage is 55.6% for adult cattle. Birth weight averages 31.2 and 28.6 kg for male and female respectively. |
| Jinnan | Bodyweight of an adult bull and cow are 607.4 and 339.4 kg. Dressing percentage is 52.3% for adult cattle. |
| Qinghai Pleateau yak | Dressing percentage of an adult bull and cow are 51.0% and 48.0% respectively. Birth weight ranges from 12 kg to 16 kg. |
| Angus | Body weight of an adult bull and cow ranges from 700- 900 kg and from 500 to 600 kg. Average daily gain is about 1000 g. Dressing percentage is 60-65% for adult cattle. Birth weight ranges from 25 to 32 kg. |
| Simmental | Body weight of an adult bull ranges from 800-1200 kg, of cow ranges from 650 to 800 kg. Average daily gain is above 1000 g. Dressing percentage is about 63% for adult cattle. Birth weight is 41.6 kg. |
| Piedmontese | Body weight of an adult bull is 800 kg and of cow is 500 kg. Average daily gain is about 1000 g. Dressing percentage is about 62.8% for adult. Birth weight is 41.3 kg for male, and 38.7 kg for female respectively. |
| Charolais | Body weight of an adult bull ranges from 1100 - 1200 kg and of an adult cow ranges from 700 to 800 kg. Average daily gain is about 1400 g. Dressing percentage is 60-65% for adult cattle. Birth weight is approximately 45 kg for males, and 42 kg for females, respectively. |
| Limousin | Body weight of an adult bull is 1200-1500 kg and of an adult cow is 600-800 kg. Average daily gain is 1500-2000 g. Dressing percentage is 63% for cattle slaughtered at age of 18 months. Birth weight ranges from 35-39 kg. |
| Increase percent=(out./cons.in 2015-out./cons.2011) ÷ out./cons. in 2011 √?¬? 100% | |
Table 3: Performance comparison between main native breeds and mainly.
Downsizing inventory and resource shortage of calves
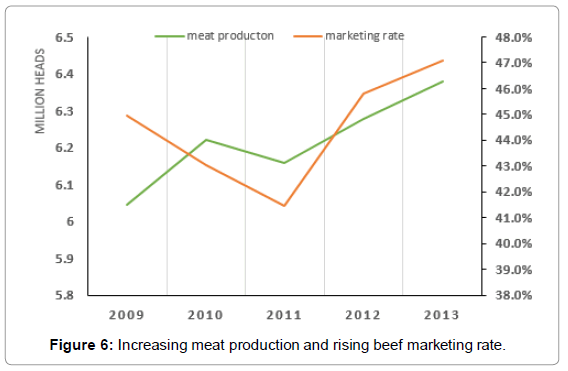
From 2010 to 2013, the Chinese cattle inventory has dropped by about 8 million head, or 7.2%, which may be a critical indicator for the future of China’s cattle industry. At the same time, meat production and sales have increased, as shown in Figure 6. As a result, China's cattle industry entered a vicious circle in which large demand resulted in increased slaughter of females, which caused cattle herds to shrink. The shrinkage in herd size has resulted in a reduction in the production capacity of the cattle industry [6].
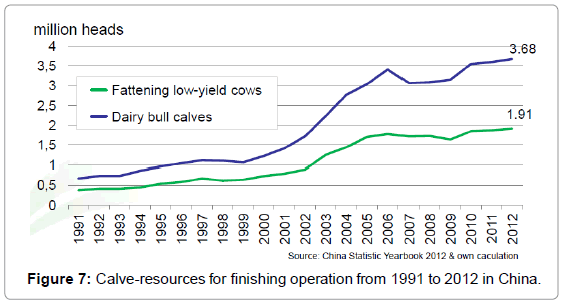
The shrinking herd size has resulted in a shortage of calves available to be procured by finishing operations. In order to obtain a sufficient supply of calves, finishing operations have to rely on low-performance breeds or dairy bull calves, as shown by Figure 7.
Developing Trends of the Cattle Industry in China
Widening deficit between beef imports and exports in China
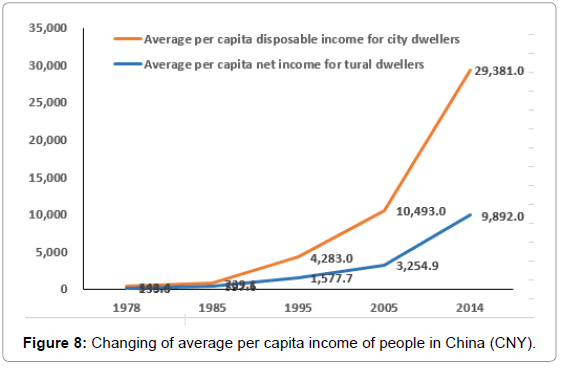
In Table 4 shows an obvious demonstration of the former hypothesis that China may become the fastest-growing beef importer in the world. From 2011 to 2015, the import volume of beef and veal into China has increased to 600,000 tons in 2015 from 29,000 tons in 2011, or an increase of by 113.3% annually. At the same time, imports to the United States increased by 13.7% annually, while imports to Russia and Japan decreased by 8.4% and 0.2% respectively. India, Australia, Brazil and the United States are the top 4 largest exporters of beef and veal, and their export volume changed by 12.1%, 6.52%, 4.9% and -4.9% respectively in the same time span. Unfortunately, the export volume of China has sharply decreased from 22,000 tons in 2011 to 6,500 tons in 2014 by 33.4% annually. A possible reason for the dramatic change in both import and export of beef and veal in China is the rapidly increasing standard of living of the Chinese people (Figure 8), which has led them to consume more beef and veal rather than pork. This shift has expanded the internal demand for beef in China, and created a need for China to both increase the size of its beef herd and to improve the productivity of its beef cattle [8,9]. The rapid growth of China‘s beef and veal consumption per capita is shown in following analysis [8,9] (Figure 8).
| Items | Import volume of beef and veal (1000 tonnes) | ||||
|---|---|---|---|---|---|
| 2011 | 2012 | 2013 | 2014 | 2015 | |
| Russia | 994 | 1027 | 1023 | 929 | 700 |
| Japan | 745 | 737 | 760 | 739 | 740 |
| China | 29 | 99 | 412 | 417 | 600 |
| United States | 933 | 1007 | 1020 | 1337 | 1559 |
| Total Exports | export volume of beef and veal (1000tonnes) | ||||
| India | 1268 | 1411 | 1765 | 2082 | 2000 |
| Brazil | 1340 | 1524 | 1849 | 1909 | 1625 |
| Australia | 1410 | 1407 | 1593 | 1851 | 1815 |
| United States | 1263 | 1112 | 1174 | 1167 | 1035 |
| China | 22 | 12.2 | 5.9 | 6.5 | √?¬† |
Table 4: Beef and veal selected countries summary.
Widening margin of output-to-consumption in China
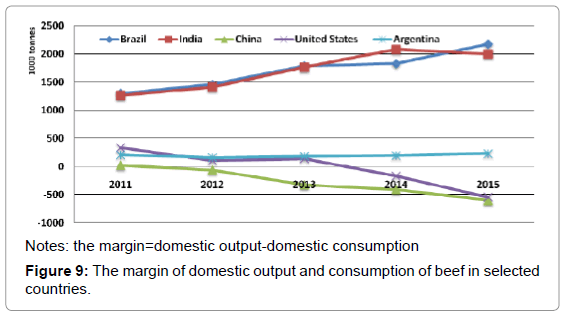
As China’s economy has developed over the past several decades, the standard of living of its people has greatly improved. As a result, domestic beef consumption has increased from 6.4 million tons in 2011 to 7.4 million tons in 2015, representing a 14% increase, while domestic beef production has increased only slightly from 6.5 million tons to 6.8 million tons during the same time interval, representing an increase of only 4.2%. As described in Table 5, China has the greatest market demand. At the same time, the United States saw a decrease in both domestic beef output and consumption.
| Year | 1000 tons, % | |||||||||
|---|---|---|---|---|---|---|---|---|---|---|
| Brazil | India | China | United States | Argentina | ||||||
| Product ion | Consumption | Production | Consumption | Production | Consumption | Production | Consumption | Production | Consumption | |
| 2011 | 9030 | 7730 | 3308 | 2040 | 6475 | 6449 | 11983 | 11646 | 2530 | 2320 |
| 2012 | 9307 | 7845 | 3491 | 2080 | 6623 | 6680 | 11848 | 11739 | 2620 | 2458 |
| 2013 | 9675 | 7885 | 3800 | 2035 | 6730 | 7052 | 11751 | 11608 | 2850 | 2664 |
| 2014 | 9723 | 7896 | 4100 | 2018 | 6890 | 7297 | 11076 | 11242 | 2700 | 2503 |
| 2015 | 10046 | 7870 | 4200 | 2200 | 6750 | 7350 | 10861 | 11400 | 2740 | 2510 |
| Increased percent | 11.2 | 1.8 | 27 | 7.8 | 4.2 | 14 | -9.4 | -2.1 | 8.3 | 8.2 |
| Increase percent=(out./cons.in 2015-out./cons.2011) ÷ out./cons. in 2011 √?¬? 100% | ||||||||||
Table 5: The domestic output and consumption of beef in some countries.
As demonstrated in figure 9, the margin of domestic beef production-to-consumption in Brazil and India has slowly increased, but it has decreased in China and the U.S., and has remained fairly steady in Argentina. These trends suggest that China will become a fast-growing market for imported beef due to its large population and widening gap between production and consumption, while Brazil and India may become the world‘s largest exporters.
Rapidly increasing beef consumption per capita in China
From Table 6, we see that beef and veal consumption per capita in China from 1985 to 2015 increased by 8.6% annually. But the contrast between China and other countries on per capita beef and veal consumption is apparent, even if the global average per capita consumption is almost twice as great as China’s in 2015 [10]. If China maintains its current population, and its per capita beef consumption catches up to the global average, the demand for beef and veal in China will increase by about 3.77 billion tons, which is more than China`s total domestic beef production in 2015. By contrast, per capita beef and veal consumption in Canada, the United States, and Argentina decreased slightly, while beef consumption in Brazil nearly doubled from 14.9 kg per capita in 1985 to 27.0 kg per capita in 2015.
| Items | China | Brazil | Canada | United States | Argentina | World |
|---|---|---|---|---|---|---|
| 1985 | 0.3 | 14.9 | 27.7 | 34.2 | 57.7 | / |
| 1990 | 0.6 | 19.4 | 24.9 | 30.4 | 55.5 | / |
| 1995 | 2 | 23.2 | 23.2 | 30.6 | 43.7 | 6.8 |
| 2000 | 2.9 | 24.7 | 23.3 | 30.8 | 45.2 | 6.7 |
| 2005 | 3 | 24.1 | 21.9 | 29.7 | 43.2 | 6.6 |
| 2010 | 3.3 | 25.5 | 20.2 | 27.1 | 40.3 | 6.6 |
| 2015 | 3.6 | 27 | 17.7 | 23.7 | 41.8 | 6.5 |
Table 6: The average per capita consumption of beef and veal for selected nations. unit for table 6 is kg per capita.
Trends in Chinese beef prices
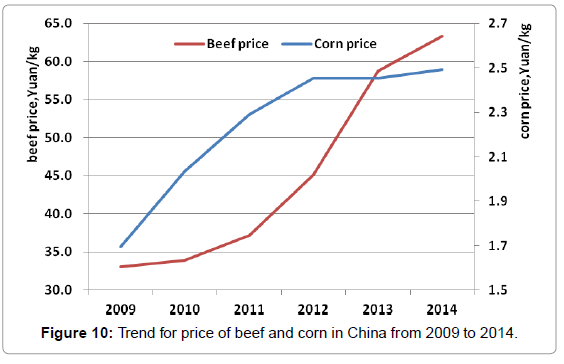
China faces an unusual situation in which both the demand for beef and the average beef price are increasing. As shown in figure 10, the price of beef and corn increased sharply from 2009 to 2014. Because corn is a major component in the diet of finishing beef cattle, the price of corn has a major impact on the cost of producing grain-finished beef. So, when the price of corn increases, assuming that the price of fed cattle stays constant, the profit margin for production of beef declines, placing financial pressures on feedlots. In addition, the price of beef is greatly influenced by the market demand. The recent increase in the price of beef was likely a result of reduced production due to increased female slaughter, the rising price of corn, and the increase in domestic market demand. However, the high price of beef makes beef finishing more profitable, resulting in a sharp rise in the percentage of the total cattle population which have been slaughtered in China as shown in Figure 11 [9].
In Figure 11 shows that the percentage of cattle slaughtered relative to the total cattle inventorincreased sharply from 23.1% in 1995 to 46.6% in 2014, which heavily exceeds 25%, the commonly held safety criteria for slaughter percentage of cattle.
Conclusion and Discussion
From the data presented herein, we can draw several conclusions; From 1978 to 2013, China`s cattle industry has grown, especially in inventory and beef output. However, although the average beef consumption per capita in China has increased, it is still much lower than per capita consumption in other, developed, countries. For the past several years, the increase in beef sales and a shortage of calf supplies available to finishing feedlots has led to a decrease in cattle inventory and total finished beef available for slaughter.
Small farms with 9 or fewer cattle slaughtered per year are responsible for a major portion of Chinese beef production.
The amount of beef in Chinese people‘s diets has increased, while there has been a sharp reduction in pork consumption. Ordinary people are now able to eat beef as a common dish.
The gap between domestic demand and domestic production is getting wider along with the rapid growth of per capita consumption.
Taking the large population and the wide disparity of beef consumption with other developed countries into consideration, it is easy to understand why the ratio of beef import to export is increasing in China.
The beef industry in China is still running with a low efficiency due to the lack of high-performance breeds optimized for local conditions.
Some Suggestions
Some critical measures should be taken to improve the performance of native yellow cattle, such as hybridization with other foreign highperformance breeds, creating new cattle breeds with better adaptability for local resources and environment, because high-heritability traits contribute more than 40% to the performance of beef cattle. Although some breed improvement work has been done in the past, most of the Chinese yellow cattle inventory remains low-performance.
Key technologies should be continuously extended to cover more cattle-raising regions and more individual animals, such as artificial insemination, embryo transfer, and scientific beef cattle diet formulation. These technologies can increase the reproduction ratio, and shorten the length of the beef production cycle to further save costs and decrease the cost per unit of output.
The government should support research aimed at introducing more advanced and practical technologies into the industry. For example, more research into nutrient requirements for different cattle breeds is needed to create an ideal feed mix. Currently, diet formulations for Chinese beef cattle are dependent on information from foreign organizations such as the National Research Council of the United States.
A standardized production system is necessary for China’s cattle production, in order to make the research and implementation of new technologies more feasible.
Calf-crop operation is the key scenario for China`s cattle industry, because the shortage of calves available to finishing feedlots is the biggest limitation to the development of the industry.
So, the government needs to take action and conduct more research into improving the production efficiency of beef cows and calves, and implement incentives to make calf production more efficient and more profitable.
References
- China National Commission of Animal Genetic Resource (2012) Animal Genetic Resources in China:Bovines. Chinese Agricultural Press.
- Food and agriculture organization of the united nations Statistics division
- National Animal Husbandry Service (2014) Chinese Animal Husbandry Yearbook.Chinese Agricultural Press.
- Xu S(2006) Protection and utilization of Chinese yellow cattle resources. Modern livestock and poultry industry 5:39-41.
- Top 5 yellow cattle breed in China.
- Nianba lunar Slight (2016) Ministry of Agriculture of the People√ʬ?¬?s republic of China.
- Wang ML (2013) Inside China`s beef and sheep market.Institute of Agricultural Economics and Development, England.
- USDA (2016)United States Department of Agriculture Foreign Agricultural Service, China.
- National Bureau of Statistics of the People√ʬ?¬?s republic of China (2016) Organization for Economic Co-operation and Development
Relevant Topics
- Acoustic Survey
- Animal Husbandry
- Aquaculture Developement
- Bioacoustics
- Biological Diversity
- Dropline
- Fisheries
- Fisheries Management
- Fishing Vessel
- Gillnet
- Jigging
- Livestock Nutrition
- Livestock Production
- Marine
- Marine Fish
- Maritime Policy
- Pelagic Fish
- Poultry
- Sustainable fishery
- Sustainable Fishing
- Trawling
Recommended Journals
Article Tools
Article Usage
- Total views: 28671
- [From(publication date):
September-2016 - Aug 29, 2025] - Breakdown by view type
- HTML page views : 27326
- PDF downloads : 1345
