Research Article Open Access
Sound Production (Bioacoustic) and Behaviour of Male Fish-Black Tilapia (Oreochromis mossambicus) Against Salinity Changes
Pujiyati S1, Hestirianoto T1, Harahap MS2 and Lubis MZ3*1Lecturer Department of Marine Science and Technology, Faculty of Fisheries and Marine Sciences Bogor Agricultural University Jln. Agatis, Kampus IPB Dramaga, Indonesia.
2Department of Fisheries and Livestock Production, North Labuhanbatu Goverment, Indonesia.
3Marine acoustic laboratory assistant, Department of Marine Science and Technology, Bogor Agricultural University Jln. Agatis, Kampus, Indonesia.
- *Corresponding Author:
- Lubis MZ
Marine acoustic laboratory assistant
Department of Marine Science and Technology
Bogor AgriculturalUniversity Jln. Agatis
Kampus IPB Dramaga Bogor 16680, Indonesia
Tel: +62 251 8622642
E-mail: muhammadz0921@apps.ipb.ac.id
Received Date: March 02, 2016; Accepted Date: May 17, 2016; Published Date: June 05, 2016
Citation: Pujiyati S, Hestirianoto T, Harahap MS, Lubis MZ (2016) Sound Production (Bioacoustic) and Behaviour of Male Fish-Black Tilapia (Oreochromis mossambicus) Against Salinity Changes. J Fisheries Livest Prod 4:188. doi: 10.4172/2332-2608.1000188
Copyright: © 2016 Pujiyati S, et al. This is an open-access article distributed under the terms of the Creative Commons Attribution License, which permits unrestricted use, distribution, and reproduction in any medium, provided the original author and source are credited.
Visit for more related articles at Journal of Fisheries & Livestock Production
Abstract
Sound production of male fish-black Tilapia (Oreochromis mossambicus) used bioacoustic method where this method can be analyze behavior and characteristics of the sound production bubbles of tilapia fish swimming in freshwaters with different salinity. Research activities conducted in June 2013, fish were reared in our Institute’s laboratory (Marine Acoustic) as much as 65 males fish-black Tilapia (Oreochromis mossambicus). Sounds were recorded with a High Tech SQ 03 hydrophone (sensitivity -162 dB re 1 VμPa-1 @20°C, frequency response within ± 1 dB from 7 Hz to 22 kHz) placed just above the rim of a territorial in aquaria with connected to sea phone sensor (Dolphin Ear), with recording software is Wavelab 6, and analysis software of Source Level, and Power Spectral Density (PSD) is Matlab R2008 b. Source level (SL) value is highest on first day after adding saline to 39.11 dB, while the lowest values were also in first day after adding salt levels are 38.72 dB, it clearly proves that the addition of salt levels can affect the value of source level (SL). Highest of PSD in after adding salinity first day with -39.03 dB/Hz, and the lowest value of the PSD which in adding to the salt levels in second day is -49.04 dB/Hz. The results shown prove the effect of salinity on the value of the PSD and also SL. Addition of salt levels greatly affect the value of the intensity, frequency, source level (SL), and power spectral density (PSD) of male fish-black Tilapia (Oreochromis mossambicus).
Keywords
Male fish-black Tilapia; Bioacoustic; Intensity; Source level; Power spectral density
Introduction
The fish have a special sound-producing organs that can emit a signal low frequencies as part of their social behavior. Many species of fish that produce certain sounds even though the mechanism of sound emissions and noise generated in the context of a very different behavior [1]. The fish-black (Oreochromis mossambicus), is a lekbreeding mouth brooding in African cichlid fish. Males of fish-black (Oreochromis mossambicus) form dense nest aggregations in shallow water during breeding season, where they have display to attract mating for females [2]. Study of sound production during courtship and spawning of Oreochromis mossambicus: male–female and male– male interactions, where sounds of Courtship this species may also advertise spawning readiness, sound production have rate is positively correlated in courtship rate [3]. Males of territorial also produce with low-frequency pulsed in acoustic signals during spawning and courtship, probably to attract synchronize to females gamete release have suggested that male–male court ship in fish-black (Oreochromis mossambicus) may be a by-product of a high sexual motivation level, resulting in sex discrimination loss by the courting in male [4]. Conversely in courted males could gain prolonged presence reduced level of attacks in the arenas by the territorial males.
Science of sound production is science in which there are bioacoustic method, Previous research bioacoustics in freshwater fish accordingly [5,6], but in research about against salinity change used freshwater fish accordingly [7-9]. Although interrelationships between behaviour of social (not directly reproduction in involved) and physiology have been extensively studied in several species of teleost [10-13], the role of pheromones in the regulation of social behaviour has received attention of little. The goal of the current study was to determine sound production (bioacoustic) and behaviour of fish-black tilapia (oreochromis mossambicus) against salinity changes. Bioacoustics research may help in understanding the language of communication on fish and fish behavior. Sound recording made widely observed on the condition of artificial environment such as an aquarium. Tilapia fish behavior studies using bioacoustics analysis is required to determine the pattern of change in the sound of fish to the treatment given, so with this interpretation voting results, we can know the behavior of tilapia fish in waters with high salinity.
Methods
Study fish
The research activities conducted in June 2013, fish were reared in our Institute’s laboratory (Marine Acoustic–Watertank-ITK-IPB) as much as 65 males fish-black Tilapia (Oreochromis mossambicus). Fish were kept in mixed-sex groups in 200 l stock aerated aquaria . Water was kept at 26 with a range of ±1°C, and photoperiod was 14 L: 14 D.
Recording and sound analysis
Sounds were recorded with a High Tech SQ 03 hydrophone (sensitivity -162 dB re 1 VμPa-1 @20°C, frequency response within ±1 dB from 7 Hz to 22 kHz) placed just above the rim of a territorial in aquaria with connected to Sea Phone Sensor (Dolphin Ear), with recording software is Wavelab 6. Sounds were digitized at a rate of 22 kHz (16 bit resolution) and analysed with Raven Pro 1.5 with sound duration at rate of 500 ms (Cornell Lab of Ornithology).
Aquarium preparing
Aquarium used to study a length of 50 cm, width 35 cm high and 60 cm which serves as a place of observation. Styrofoam glued outside of the aquarium as a noise reducer. Modification of the aquarium lid 4 is done with the vent cap aquarium with a size of 5 cm x 5 cm to observation and entry of cable hydrophones. Recently enter the water into the aquarium observations. Aquarium is left aerated during the day so that the water be clean and contain enough oxygen. Cleaning the aquarium during the observation made by the method of chiffon, which suck up dirt in the bottom of the aquarium and then throw it away. Aquarium conditions with 65 tail 65 tail of male fish-black tilapia and Illustration of aquarium observations that will be used is shown in Figure 1.
Result and Discussion
Sound of male fish-black Tilapia (Oreochromis mossambicus)
The intensity of the sound produced tilapia fish (Table 1) is influenced by the behavior of tilapia fish because of the influence of the contraction of the muscles of the swim bladder on tilapia fish [14]. High salt content causes swim bladder to contract with large amplitude so that the intensity of the sound produced increases.
| Day | Adding Salt Content (gr) | Sound Velocity (m/s) | Sound Intensity Before Adding Salt | Sound Intensity√?¬† After Adding Salt | ||
|---|---|---|---|---|---|---|
| Highest Intensity (dB) | Lowest Intensity (dB) | Highest Intensity (dB) | Lowest Intensity (dB) | |||
| 1 | 175 | 1546.1250 | -38.79 | -50.71 | -37.33 | -50.82 |
| 2 | 350 | 1545.6050 | -36.34 | -49.59 | -39.53 | -51.52 |
| 3 | 525 | 1545.0850 | -36.61 | -50.18 | -43.29 | -51.16 |
| 4 | 700 | 1544.0450 | -39.30 | -47.23 | -37.71 | -46.25 |
Table 1: Sound production of male Fish-Black Tilapia.
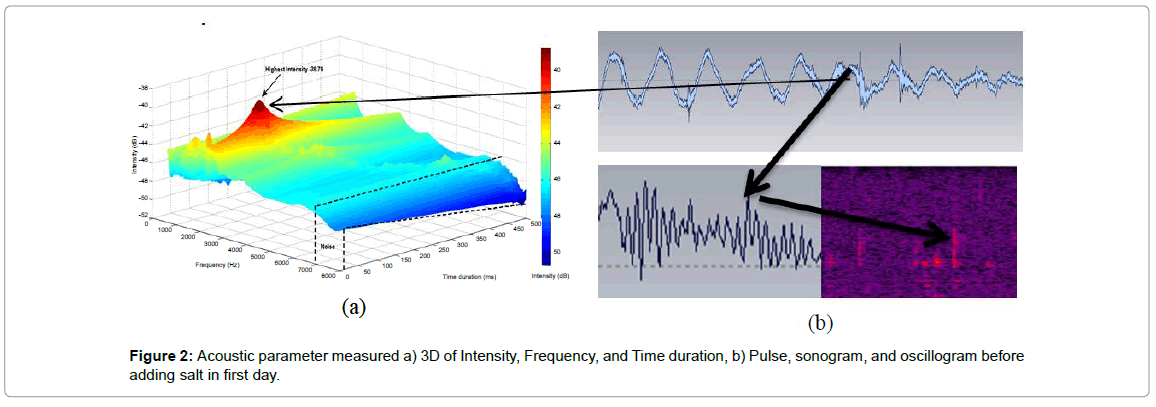
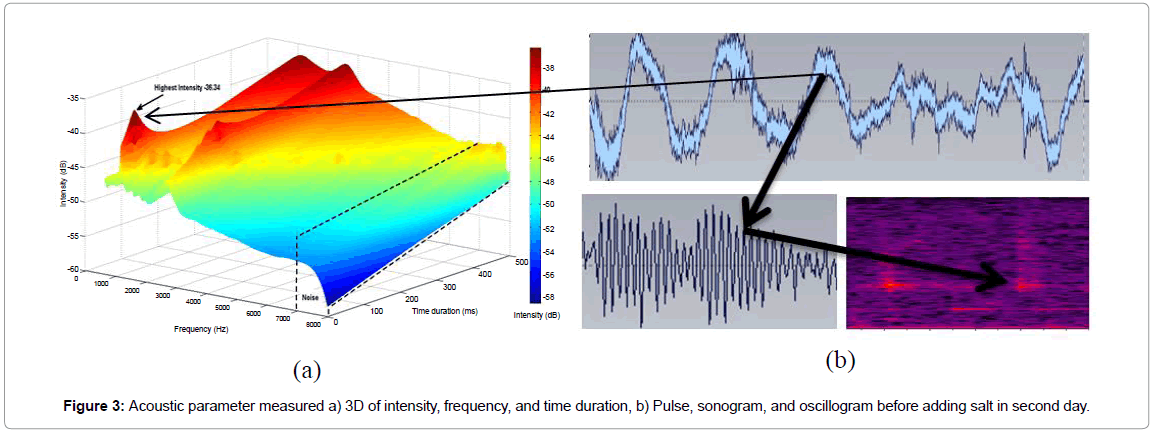
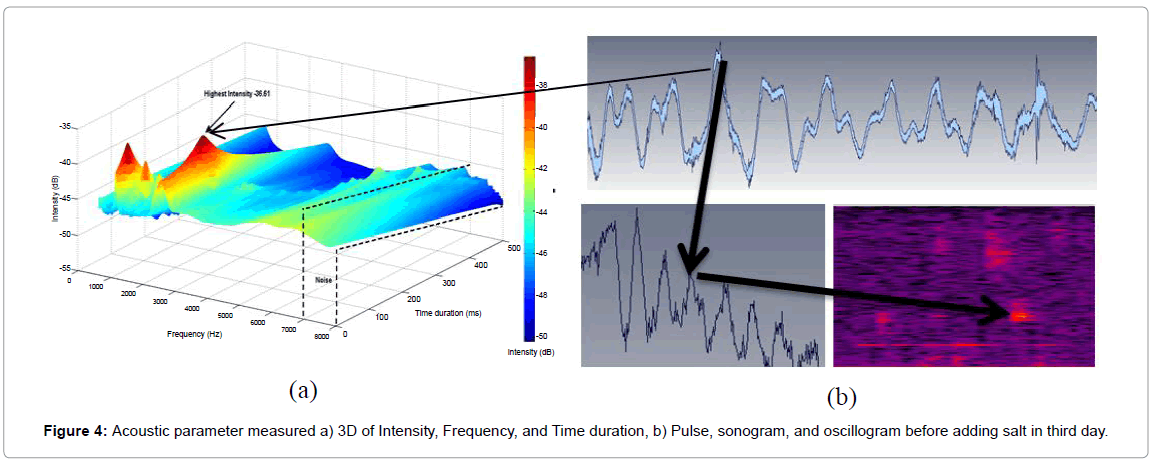
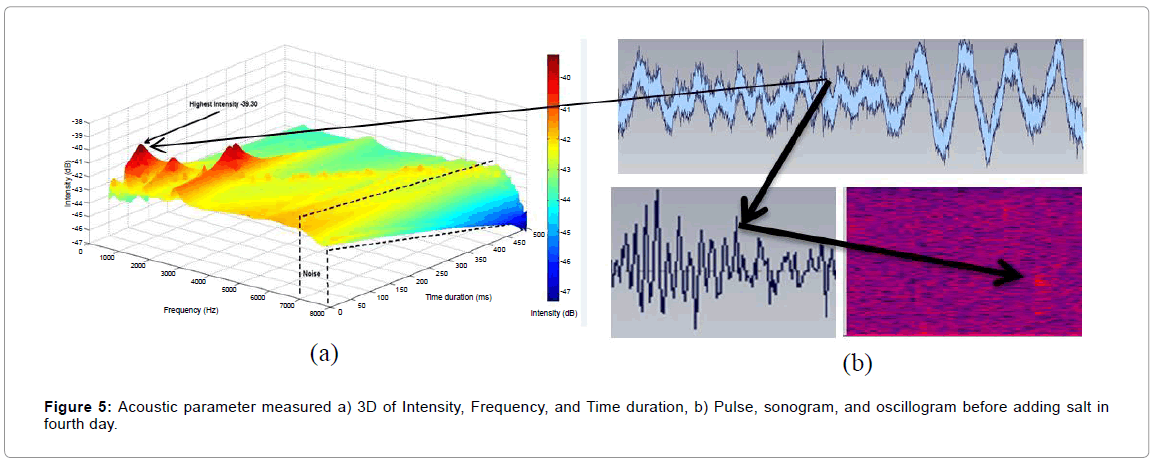
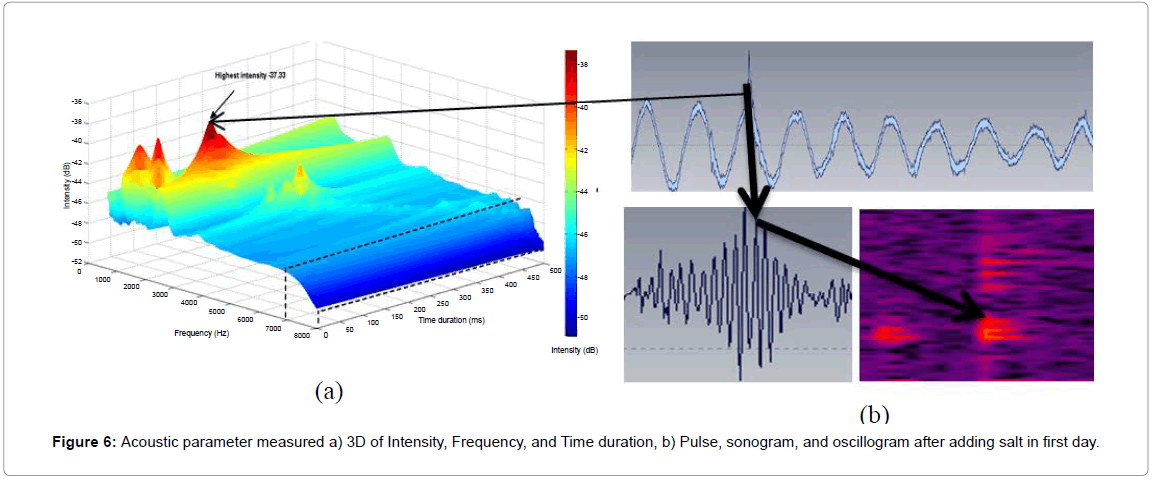
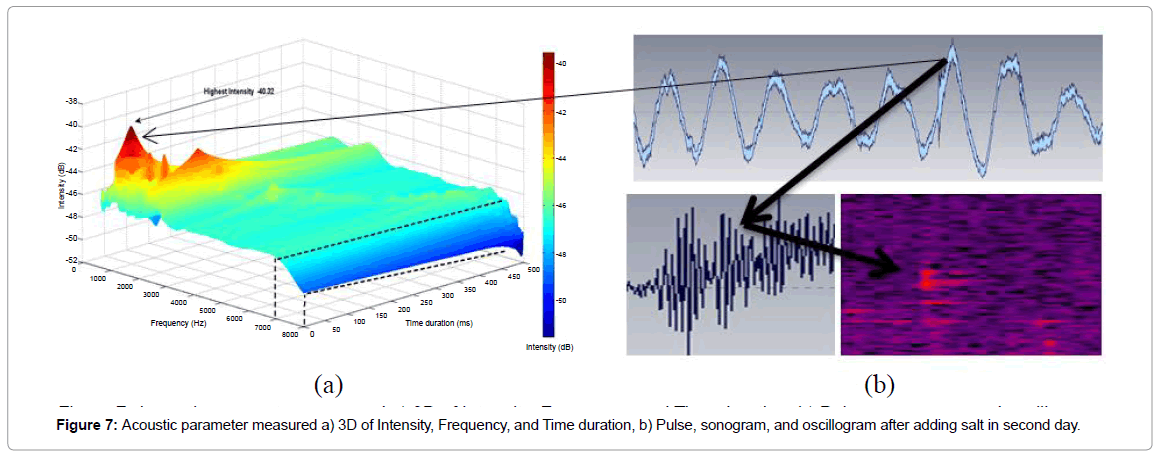
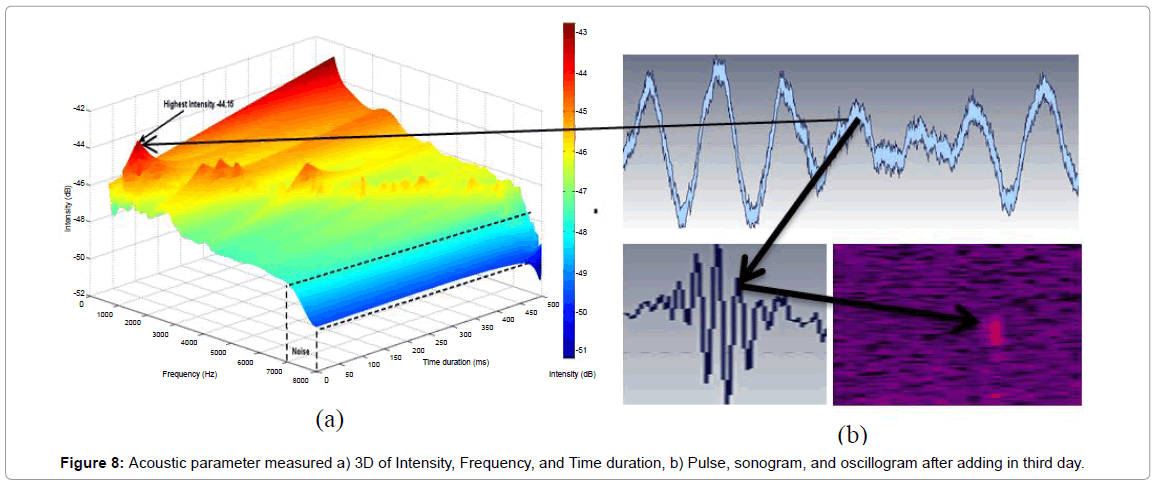
Sonograms and power spectra were produced using the following parameters: filter with band pass filter cut off 1-5 kHz, FFT size 1024 points, time grid resolution 5-8 ms, 50% overlap, analysis block size 512 and smooting window is Gaussian, this result can be seen in Figures 2-9. First day to third day of tilapia fish swim bladder sound is detected for 5 minutes recording for tilapia fish swim bladder can still function normally [15] in Table 1.
With increasing levels of salt each day 175 grams to day-to-4700 grams, show sounds velocity have declining voice and sound intensity of the object has risen 2 dB increase in the intensity of the highs and lows of 1.5 dB. It can show the correlation value of the intensity of sound and movement, the more the addition of salinity, the fish the more moving because of the physiology of the fish was disturbed by the treatment. Addition levels of salt and other substances can damage the physiology of fish and will even cause death [16]. The highest intensity of fourth day study that was on the 2nd day with the addition of 350 grams of salt levels and intensity of -36.34 dB, while the lowest value that was in the second day after being added to the salt content of 350 grams, and intensity of -51.52 dB (Table 1).
In Figure 2 showed 3 D of Intensity, Time duration, and Freq value, this result have highest intensity with -38.79 dB range freq 1-2 kHz. Figure 3a have result the highest intensity with -36.34 dB range freq 0-1 kHz. Figure 4a have result the highest intensity with -36.31 dB range freq 2-3 kHz. Figure 5a have result the highest intensity with -39.30 dB range freq 0-1 kHz. Figure 6a have result the highest intensity with -37.33 dB range freq 1-2 kHz. Figure 7 have result the highest intensity with -40.32 dB range freq 0-1 kHz. Figure 8a have result the highest intensity with -44.15 dB range freq 0-1 kHz. Figure 9a have result the highest intensity with -40.21 dB range freq 1-2 kHz. Figures 2-9b showed pulse length, frequency spectra, and oscillogram in highest value in frequency. This results clearly show that the calculations or methods bioacoustic to fish is needed to determine the productivity and health of the fish [17-23].
Source level (SL) and power spectral density (PSD) of male fish-black Tilapia (Oreochromis mossambicus)
Source Level (SL) obtained by Extraction of data to tx using appropriate algorithms within [3,18,19] and SL results showed that before and after adding salinity have a different value although the use of the object and the same amount of fish. SL value is highest on first day after adding saline to 39.11 dB, while the lowest values were also in first day after adding salt levels are 38.72 dB, it clearly proves that the addition of salt levels can affect the value of source level (SL). Sl of male fish-black Tilapia (oreochromis mossambicus) before and after adding salt day 1-4 can be seen in Figures 10 and 11.
In Figures 12 and 13 showed Power Spectral Density (PSD) of male fish-black Tilapia (oreochromis mossambicus) before and after adding salt day 1-4. Power Spectral Density (PSD) of function to equalize the number of rows and columns of data matrix m-file of the results of the voice recording process. Power spectral density is a useful concept to determine the optimum frequency band of the signal transmission system. PSD is a variation of power (energy) as a function of frequency spectrum in the form of density estimated using FFT processed using Matlab R2008 b. Highest of PSD are in after adding salinity first day with -39.03 dB/Hz, and the lowest value of the PSD which is in adding to the salt levels - 2 is -49.04 dB/Hz. The results shown prove the effect of salinity on the value of the PSD and also SL. Gender greatly, and acoustic modification method affect the frequency of the sound, SL, and the intensity of the sound [18,20-24].
Conclusion
The results showed that the behavior and characteristics of the sound production of male fish-black tilapia experience the difference in line with the change in salinity on aquatic habitat environment. Fluctuations occur because tilapia fish experience stress syndrome swim bladder. Addition of salt levels greatly affect the value of the intensity, frequency, Source Level (SL), and Power Sspectral Density (PSD) of male fish-black Tilapia (Oreochromis mossambicus).
References
- Veerappan N, Pandi, Balasubramanian (2009) Sound Production Behaviour in a Marine Croaker Fish, Kathala axillaris (Cuvier). J Fish and Marine Sciences 1: 206-211.
- Bruton MN, Boltt RE (1975) Aspects of the biology of Tilapia mossambica Peters (Pisces: Cichlidae) in a natural freshwater lake (Lake Sibaya, South Africa). Journal of Fish Biology 7: 423-445.
- Amorim MCP, Fonseca PJ, Almada VC (2003) Sound production during courtship and spawning of Oreochromis mossambicus: male√ʬ?¬?female and male-male interactions. Journal of fish biology 62: 658-672.
- Oliveira RF, Canario AVM (2000) Hormones and social behaviour of cichlid fishes: a case study in the Mozambique tilapia. Journal of Aquariculture and Aquatic Sciences 9: 187-207.
- Lubis MZ (2014) Bioakustik Stridulatory Gerak Ikan Guppy (Poecilia reticulata) Saat Proses Aklimatisasi Kadar Garam. Scientific Repository, Indonesia.
- Mutiara MT, Pamungkas IR., Lubis MZ, Putri DA, Wulandari PD (2014) studies bioacoustics movement of guppies (poecilia reticulata) as a feed diversification of skipjack (katsuwonus pelamis). Scientific Repository, Indonesia.
- Lubis MZ, Pujiyati S (2014) The impact of acclimatization of various salinity to againts mortalitas rate and behaviour fish guppy (poecilia reticulata) as a subtitute for fish bait skipjack (katsuwonuspelamis). Journal Teknologi Perikanan Dan Kelautan 4: 126-129.
- Lubis MZ, Wulandari PD, Pujiyati S (2014) Pengaruh Penambahan Kadar Garam Terhadap Studi Bioakustik Suara Stridulatory Gerak Ikan Guppy (Poecilia Reticulata).
- Harahap MS (2014) Karakteristik Bioakustik Dan Tingkah Laku Ikan Mujair (Oreochromis Mossambicus) Terhadap Perubahan Salinitas. Scientific Repository.
- Johnsson JL, Winberg S, Sloman KA (2006) Social interactions In Behaviour and Physiology of Fish Edited by: Sloman KA, Wilson RW, Balshine S. London: Academic Press: 151-196.
- Oliveira RF (2005) Hormones, social context and animal communication. In Animal Communication Networks, eds. McGregor PK. Cambridge University Press: 481-520.
- Sloman KA, Armstrong JD (2002) Physiological effects of dominance hierarchies: laboratory artefacts or natural phenomena? Journal of fish Biology 61: 1-23.
- Gilmour KM, DiBattista JD, Thomas JB (2005) Physiological causes and consequences of social status in salmonid fish. Integrative and Comparative Biology 45: 263-273.
- Stevens R (1981) Malting and Brewing Science: Malt and Sweet Wort. Chapmanand Hall. London. England.
- Damayanty MM, Abdulgani N (2013) Pengaruh Paparan Sub Lethal Insektisida Diazinon 600 EC terhadap Laju Konsumsi Oksigen dan Laju Pertumbuhan Ikan Mujair (Oreochromis mossambicus). Journal Sains dan Seni ITS 2: E207-E211.
- Yulaipi S, Aunurohim A (2013) Bioakumulasi Logam Berat Timbal (Pb) dan Hubungannya dengan Laju Pertumbuhan Ikan Mujair (Oreochromis mossambicus). Journal Sains dan SeniITS 2: E166-E170.
- Fay RR (2008)Fish bioacoustics, New York : 1851-1860.
- Urick R.J (1975) Principles of Underwater Sound. Kingsport Press: 384.
- Muhammad Z, Pujiyati S (2015) Influence of Addition of Salt Levels Against Study of Bio-Acoustic Sound Stridulatory Movement Fish Guppy (Poecilia reticulata): 1-7.
- McPherson G (2012) Acoustic modification of tilapia behaviour. Proceedings of acoustics.
- Amorim MCP, Almada VC (2005) The outcome of male√ʬ?¬?male encounters affects subsequent sound production during courtship in the cichlid fish Oreochromis mossambicus. Animal Behaviour 69: 595-601.
- Bertucci F, Attia J, Beauchaud M, Mathevon N (2012) Sounds produced by the cichlid fish Metriaclima zebra allow reliable estimation of size and provide information on individual identity. Journal of fish biology 80: 752-766.
- Lubis MZ, Wulandari PD, Hestirianoto T, Pujiyati S (2016) Bioacoustic Spectral Whistle Sound and Behaviour of Male Dolphin Bottle Nose (Tursiops aduncus) at Safari Park Indonesia, Cisarua Bogor. J Marine Sci Res Dev 6: 2-6.
- Rasmussen MH, Miller LA, Au WW (2002) Source levels of clicks from free-ranging white-beaked dolphins (Lagenorhynchus albirostris Gray 1846) recorded in Icelandic waters. The Journal of the Acoustical Society of America 111: 1122-1125.
Relevant Topics
- Acoustic Survey
- Animal Husbandry
- Aquaculture Developement
- Bioacoustics
- Biological Diversity
- Dropline
- Fisheries
- Fisheries Management
- Fishing Vessel
- Gillnet
- Jigging
- Livestock Nutrition
- Livestock Production
- Marine
- Marine Fish
- Maritime Policy
- Pelagic Fish
- Poultry
- Sustainable fishery
- Sustainable Fishing
- Trawling
Recommended Journals
Article Tools
Article Usage
- Total views: 12156
- [From(publication date):
September-2016 - Aug 29, 2025] - Breakdown by view type
- HTML page views : 11178
- PDF downloads : 978


