Special Issue Article Open Access
Assessment of a Low Cost Thin Film Bidirectional Airflow Probe for Pulmonary Applications
| Charles E. Forbes*, Robert E. Coifman and Stephen L. Monfre | |
| Feather Sensors, LLC, 1122 North High Street, Millville, NJ 08332, USA | |
| Corresponding Author : | Charles E. Forbes Feather Sensors, LLC, 1122 North High Street Millville, NJ 08332, USA Tel: 908-581-3166 Fax: 856-327-8030 E-mail: ned@feathersensors.com |
| Received July 31, 2012; Accepted August 01, 2012; Published August 04, 2012 | |
| Citation: Forbes CE, Coifman RE, Monfre SL (2012) Assessment of a Low Cost Thin Film Bidirectional Airflow Probe for Pulmonary Applications. Biochem Physiol S1:001. doi:10.4172/2168-9652.S1-001 | |
| Copyright: © 2012 Forbes CE, et al. This is an open-access article distributed under the terms of the Creative Commons Attribution License, which permits unrestricted use, distribution, and reproduction in any medium, provided the original author and source are credited. | |
Visit for more related articles at Biochemistry & Physiology: Open Access
Abstract
As a device for measuring lung function in pulmonary medicine, we have developed a probe containing a strain gauge housed in a plastic form with two wires that connect to an audio jack, for communication with electronic equipment. This device is proposed as an alternative to sensors currently employed in instruments, such as spirometers and forced oscillation technique devices (FOT). The ruggedness and low cost of the probe make it suitable for personal monitoring devices. The physical properties of our sensor appears to be responsible for two classes of anomaly, in its ability to measure airflow. The first is polymer creep, for which we have developed a correction algorithm yielding a square wave voltage output to a square wave airflow input. The second anomaly is a “hump” in the voltage airflow curve that slightly lowers the accuracy at low flow rates. Other tests show minimal airflow resistance, promise for conformity to American Thoracic Society spirometry waveform standards, utility as a device for measuring bidirectional airflow, and promise for FOT applications. The probes have a simple form factor and are easily manufactured.
| Keywords |
| Spirometry; Forced Oscillation Technique (FOT); Strain Gauges; Thin Film Sensors; Pulmonary Medicine; Asthma; COPD; Polymer Creep; Bidirectional |
| Abbreviations |
| COPD-Chronic Obstructive Pulmonary Disease; FOT-Forced Oscillation Technique; ATS-American Thoracic Society; PWG-Pulmonary Waveform Generator; ASTM-American Society For The Testing Of Materials |
| Introduction |
| Pulmonary diseases are among the most serious public health problems in the world today. The two most prevalent and treatable conditions are asthma and chronic obstructive pulmonary disease (COPD). Globally, the World Health Organization estimates that 300 million people suffer from asthma, and 210 million suffer from COPD [1]. |
| Technology for diagnosis and treatment of these diseases has become increasingly sophisticated over the past several decades. Spirometry is the best generally available method to measure pulmonary function in obstructive lung disease patients able to perform the required forced breathing maneuver [2]. Forced oscillation technique (FOT) devices, which measure pulmonary airway resistance and reactance, are preferred for patients unable to perform the forced maximal inspiration and expiration needed for spirometry. However, presently available FOT equipment is too complex and costly for widespread use. Peak flow meters, which are a crude form of spirometry that measure expiratory airflow rate (PEFR), are used for home monitoring of asthma and COPD patients. About ten to fifteen percent of such patients use this device. |
| The more accurate spirometers and FOT devices use pneumotachometers (pneumotachs), to measure respiratory airflow. Up to now, the most accurate and widely used pneumotachs are of two basic designs-the Fleisch and Lilly designs (A Fleisch pneumotach is shown on the left hand side of Figure 1). A differential pressure transducer measures airflow by the pressure drop it induces across the resistance of an array of parallel air tubes and/or channels. In the Lilly pneumotach, this resistive array is replaced by a partially obstructing mesh, web, or membrane with precisely placed holes. Both have significant drawbacks. Their resistive elements are difficult to clean and disinfect, and they require daily or more frequent calibration, as their calibration varies with barometric pressure. They are sensitive to condensation from human breath, making costly heated pneumotachs necessary for applications with long measurement times. In 2012, a typical quality pneumotach cost about $700. |
| In this paper, we discuss an alternative to the pneumotach, a new probe design that uses a low cost (<$10) flexible strain gauge sensor to measure airflow. The sensor bends, depending on the airflow, and the resistance of the sensing element changes because the sensing element is under compression or tension. This use of a strain gauge mounted at its base presents some challenges, and this paper discusses the methods we applied to address those challenges, in order to obtain quantitative airflow data. The sensor is a low-cost replacement for the pneumotach in spirometers and FOT devices. The sensor components are readily available and inexpensive, creating a significant cost advantage in manufacture. |
| The sensors used are based on strain gauges, which were described by Windows and Margerson [3,4]. As a mature technology, strain gauges are used almost exclusively to measure stress-strain relationships in engineered structural components, such as I-beams in a bridge, airplane wing struts, and electronic balances. The base substrate is polyimide (Kapton) covered by a resistive serpentine foil (constantan), and topped by a thin protective laminate film (Figure 2). When the sensor is bent, the foil will either contract due to compression or extend due to tension. Compression causes the electrical resistance to decrease, while tension causes the resistance to increase. These gauges are usually bonded onto the surface of a steel, aluminum, or concrete test object with cyanoacrylate adhesives, prior to stress-strain measurements. Through testing, we show their suitability for pulmonary applications, namely spirometry and oscillatory techniques such as the Forced Oscillation Technique (FOT). |
| Materials and Methods |
| Probes containing a commercially available sensor were initially fashioned from balsa wood using woodworking shop equipment, and later using a polymer 3D printing technique. Our device is illustrated on the right side of Figure 1. It consists of a commercially available strain gauge housed in a plastic form with two wires that connect to an audio jack, for communication with electronic equipment. |
| Airflow measurements were made using a storage compressor, capable of airflow rates of 6 L/s. Airflow was measured with rotameters available from King Instrument Co. Airflow measurement with these rotameters is sensitive, precise, and reproducible, but they have limited absolute accuracy. Sensor electrical resistance was measured with a conventional Wheatstone bridge, with voltage output amplified by an operational amplifier. |
| A pulmonary waveform generator (PWG) available from MH Custom Design & Manufacturing L.C., Midvale, UT, was used for ATS waveform testing and bidirectional flow measurements. The generator consists of a 3L mechanical syringe (mean diameter, 25.4 cm), with a range of piston movement ~35.6 cm, driven by a computer-controlled, high-precision servo motor. The PWG can theoretically deliver volumes in increments of 0.032 mL. The servomotor is controlled by a dynamic feedback system that makes micro adjustments to the position of the PWG syringe, which increases the accuracy of the delivered flow and volumes. |
| Airflow resistance was measured with equipment previously described by Black et al. [5]. A 12-in diameter subwoofer delivering 8 Hz oscillation, with amplitude of ± 1cm H2O is used in combination with a pneumotachograph (4700 Series, Hans Rudolph, Kansas City, MO) and a differential pressure transducer (ATD02AS, SCIREQ, Montreal, QC). |
| Results |
| Calibrating the probes |
| We are able to show the suitability of our probes for lung airflow measurement by calibrating the electrical responses from our device against known airflow values, which were developed from traditional pneumotach and rotameter measurements. The first tests described here were done to establish the calibration curves for our probes. Once the calibration curve is known for an observed voltage, it is possible to determine airflow, which is required for pulmonary testing. The calibration curves we developed using these tests were internally consistent and reproducible. Our calibration results show promise for gathering data similar to that obtained using pneumotach technology. |
| Square pulse response testing |
| An important performance parameter for a quantitative electrical measuring device is the degree to which a square wave input is reflected by a square wave output. Understanding the response of the sensor to square pulses of airflow is of primary importance in the practical use of devices measuring pulmonary airflow. Square pulse response testing involved turning a pulse of air on and off at ten second intervals, using a gas shut-off valve. In this demanding test, airflow during the pulse should remain constant; i.e., the measured response should be identical to the pulse applied. |
| Figures 3 and 4 show the response of one of the probes to square wave airflow pulses. The electrical response of the probes depends on the direction of the airflow. Under tension, positive pulses are observed; with compression, negative pulses are observed. We have attributed the deviations from square waves to polymer creep, a reversible, elastic stretching of the sensor, particularly the polyimide base layer. |
| An alternative possibility is that the air pulses are changing the temperature of the sensor, causing a change in the response. The sensors during operation are expected to be slightly heated due to resistive heating. The resistance of the sensor is 120 ohms, and 5 V across the Wheatstone bridge is a typical supply voltage. The net resistance across one side of the Wheatstone bridge is 240 ohms (120 ohms from the sensor and 120 ohms from the dummy resistor). Using W=V2/Ω, the wattage generated is 0.025 cal/s, which will be dissipated from the sensor surface during operation. We are currently planning experiments to distinguish these two measurements. In either case, both methods will use exponential correction terms. If temperature effect were the main cause of the observed deviations from square pulses, we would expect the deviations to depend on the airflow, which is not observed. |
| Non-linear effects-creep |
| The sensors used in this study are a composite of two viscoelastic materials: the constantan alloy metal strip and the polyimide substrate. These, along with a protective overcoat, are subject to creep. When the sensor is subjected to airflow and bends, there are tangential forces that result in a net stretching along the length of the sensor, regardless of the direction of the airflow. This stretching is expected to result in increasing the sensor resistance, contributing to the voltage output. We have developed a method to correct for this polymer creep. |
| Our method employs a model that phenomenologically describes many polymers: the Kelvin-Voigt Model. In this widely used model, the material is represented by a Hookean Spring and a Newtonian Dashpot in parallel. |
| The strain, ε, is given by the following convolution integral: |
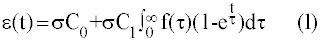 |
| Where σ=applied stress, C0=instantaneous creep compliance, C1=creep compliance coefficient, τ=retardation time, f(τ)=distribution of retardation times, e.g. a square pulse. For constant stress, the creep strain or creep response, εs, will be given by an equation of the form: |
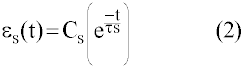 |
| And the creep relaxation by: |
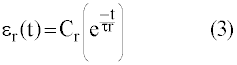 |
| On first principles, calculation of exact polymer creep is very difficult, especially for a thin film composite. There are several test methods for evaluating long-term properties of materials, including creep test ASTM-D2990 [6]. Creep data for polyimides are very limited and application dependent [7]. Our approach is to look for creep in our data model with Eqs. 2 and 3 and correct the final airflow data to be obtained. |
| We have observed that the polymer creep responses are approximately independent of the airflow. This means that the same correction function can be used under a variety of impulse conditions. Two functions are needed: one for the creep response and another for creep relaxation. For example, Figure 5 shows the creep relaxation function for a variety of flow rates ranging from 0.5-12 L/s. |
| Figure 6 shows an example of the use of the creep correction algorithm. The top curve in this figure represents the observed data. The lower green curve is the first derivative of the raw data, and is used to determine when to apply the correction function. The blue curve is the correction function that is added to the original data to yield the corrected data, shown at the bottom in black. |
| For the same set of measurements, once we corrected for creep, we were able to plot the responses of the sensor to airflow, which are shown in the calibration curve in Figure 7. This curve shows the voltage/airflow for two square pulses. The first and the second pulses are almost identical, which indicates that sensor measurements are reproducible. We also see a “hump” in the response curve at low flow rates, when the sensor is in compression. |
| Bidirectional square pulse testing-PWG testing |
| The purpose of this test was to ascertain the probe’s feasibility and ruggedness for bidirectional airflow, i.e., for both inspiration and expiration cycles of human breathing. This experiment simulates a subject exhaling, followed by rapid inhalation. In this experiment, the airflow is controlled by a pulmonary waveform generator (PWG) syringe to give the pulse shaped waveform presented in Figure 8. The airflow is turned on by a 5.0 L piston, followed by a rapid change in airflow direction (as the piston reverses direction), and then an abrupt stop. Since the piston has a fixed volume, the airflow will determine the length of the pulse train. For example, the duration of the 0.5 L/s was 20 s compared to the 12 L/s that occurred in 2 s. |
| The responses to this experiment are shown in Figure 8. Sharp sidewalls are observed, indicating the rapid response time of the probe.The square wave responses observed indicate that this probe is suitable for bidirectional spirometric evaluation. Note that the voltage falls off with increasing airflow. This probe shows a remarkable range of usable airflows and is well suited for testing adult respiration (expiration 0-12 L/s and inspiration 0-4 L/s). These experiments illustrate the ruggedness of the probe. At 12 L/s, the forced airflow corresponds to winds of ~250 miles/hour through our air conduit (~1 cm2). This experiment did no damage to the sensor or probe. |
| Pneumotach testing |
| Further testing involved looking at airflow data in series with a pneumotach at Boston University. Simultaneous airflow data were collected, using our balsa probe in series with a standard pneumotach airflow sensor (4700 Series, Hans Rudolph, Kansas City, MO). Raw data were collected over several days (Figure 9) and showed results under conditions of the low airflow typically observed in human tidal breathing. These data were collected for oscillatory experiments at 8 Hz. In contrast to the linear pneumotach output, they again show the S-shaped calibration curve, as well as the “hump” seen in the rotameter testing (Figure 7). |
| Along with determining calibration curves, three other tests were made on our probes. One measured airflow resistance, which indicates how difficult it is to blow into the device. The second, ATS waveform testing, was made to establish its accuracy as an expiratory airflow-testing device. A third test assessed the response of our probe to sinusoidal pulses of air, which would indicate its utility for FOT. |
| Probe airflow resistance testing |
| The airflow resistance of our probes was measured using Boston University’s FOT equipment at 8 Hz. The probes were attached to the BU equipment, and the resistance of flow was measured by an algorithm involving the Fourier transforms of the raw data for flow and pressure signals. The resistance of our tested probes ranged from 0.06 to 1.86 cm H2O/L/s, well within the range of the pneumotach (4700 Series Hans Rudolph): 1.56 cm H2O/L/s. The American Thoracic Society recommends a mean resistance less than 2.5 cm H2O/L/s [8]. |
| ATS waveform testing |
| One of our early probes was tested using the 24 waveforms specified previously by ATS. Four representative responses are shown along with expected responses in Figure 10. The waveforms intentionally have rough features and are representative of what is expected clinically. After adjustments for sensitivity and baseline correction, we obtained reasonable agreement for the majority of the waveforms. We intend to repeat this study using the correct digitization rate (500 Hz); we used 60 Hz, so our data are underrepresented. |
| Testing for applicability to FOT |
| FOT works by noninvasively assessing respiratory airflow impedance during ventilation [9]. The technique is based on the introduction of a small pressure oscillation (about 2 cm H2O) at the airway opening by means of a speaker or external pressure generator, with simultaneous monitoring of the oscillation pressure and flow [10]. A typical setup is presented in Figure 10. Forced oscillation is applied at a frequency (typically 5-35 Hz) that is much higher than the patient’s breathing rate (2 Hz or lower). The patient experiences only a slight pulsation sensation in the chest area. No forceful breathing is required. The FOT method (Figure 11) is critically dependent on obtaining a clean low frequency response, in the range of 5-35 Hz. When the sensor is subjected to low frequency sound from a subwoofer, the sensor visibly moves in a simple swinging back-and-forth motion within the airflow chamber. |
| The electrical responses for our three probes tested at 5 Hz are presented in figure 12. Clean sinusoidal patterns are noted, indicating our probe is an excellent prospect for oscillatory applications such as FOT. Under conditions where the sensor physically vibrates, there is no need to invoke creep correction. We speculate that once the sensor is in motion, the tangential airflow forces keep the film in stable tension. When this motion stops, the film readjusts through polymer creep and goes back to the “home” position. These observations are very encouraging and will be the subject of future studies. |
| Discussion |
| Raw sensor data are confounded by two physical characteristics of the base polyimide film. The first we attribute to polymer creep, for which we developed a correction algorithm. Creep is only observed at the beginning and end of an airflow event, and corrections are applied using the first derivative of the data stream to specify when the corrections are to be applied. |
| A second challenge in developing airflow data for our probes was to understand the nature of the “hump” effect arising from the sensor element when it goes into compression. This “hump” is seen in the S-shaped calibration curves in Figures 7 and 9. The “hump” is observed at negative low flow rates, and is possibly the result of the sensor overcoming the slight banana curvature that occurs when the airflow in the sensor changes direction and the conditions of compression and tension reverse. We believe the banana curvature may arise from the composite manufacturing process. Even in Kapton film, the base material of the stain gauge is not perfectly flat, due to roll-to-roll processing at the time of manufacture. The “hump” lowers the accuracy at low flow rates, when the sensor is in compression. For higher accuracy in spirometry applications, the preferred direction of the probe for the expiration phase should be when the sensor is in tension. Spirometry is clinically more informative during expiration, rather than inhalation. |
| Our sensor probe has a number of desirable attributes for application to the clinical and investigational measurement of human and animal respiratory airflow. A primary advantage is low cost. It is also portable, bidirectional, rugged, and stable over the full range of human respiratory airflow. It is easy to clean and disinfect, and does not require calibration every day or every time it is moved. Testing of our probes using a number of methodologies shows workable calibration curves, low airflow resistance, promise for conformity to ATS spirometry waveform standards, utility as a device for measuring bidirectional airflow, and promise for FOT applications. Tests suggest a role for our probe in both spirometry and oscillatory techniques, such as FOT. We believe personal pulmonary monitoring devices can be made with our probe, with better warning alerts for early signs of developing asthma exacerbations. Cost savings resulting from earlier recognition and treatment will more than cover the added cost of these devices and an electronic alerting system. |
| As we continue to develop new probes and sensors, we envision a new generation of pulmonary sensors measuring not only airflow, but also, with additional sensing elements fabricated on the film, capable of monitoring pressure [11], temperature [12], or more complex functions, such as micro fluidic channels for dispersing drugs [13,14]. Such developments are feasible, given the functionality of polyimide substrate. The most widely used polyimide is Kapton, a high performance polymer that is used in the electronics and chemical industries and functions as flexible circuit board. Its most remarkable properties are its thermal and chemical stability [15]. Kapton is tough, flexible, and stable to molten solder. Amorphous silicon transistors have been fabricated on the surface [16,17], and it can be processed [18-20] using roll-to-roll printing techniques [21,22]. |
| Acknowledgements |
| The authors are grateful to John Weiler, MD at CompleWare, North Liberty, IA 52317, for access to PWG equipment at their site, as well as Alex Stanzler at CareFusion, Yorba Linda, CA 92887. |
| We also wish to thank Kenneth R Lutchen, Ph.D., Dean, College of Engineering, Boston University, for preliminary FOT oscillation measurements. We also appreciate the help in preparing this manuscript from Catherine Yang, Ph.D., Chair & Professor, Chemistry & Biochemistry, Rowan University. |
References
|
Relevant Topics
- Analytical Biochemistry
- Applied Biochemistry
- Carbohydrate Biochemistry
- Cellular Biochemistry
- Clinical_Biochemistry
- Comparative Biochemistry
- Environmental Biochemistry
- Forensic Biochemistry
- Lipid Biochemistry
- Medical_Biochemistry
- Metabolomics
- Nutritional Biochemistry
- Pesticide Biochemistry
- Process Biochemistry
- Protein_Biochemistry
- Single-Cell Biochemistry
- Soil_Biochemistry
Recommended Journals
- Biosensor Journals
- Cellular Biology Journal
- Journal of Biochemistry and Microbial Toxicology
- Journal of Biochemistry and Cell Biology
- Journal of Biological and Medical Sciences
- Journal of Cell Biology & Immunology
- Journal of Cellular and Molecular Pharmacology
- Journal of Chemical Biology & Therapeutics
- Journal of Phytochemicistry And Biochemistry
Article Tools
Article Usage
- Total views: 14345
- [From(publication date):
September-2015 - Aug 17, 2025] - Breakdown by view type
- HTML page views : 9758
- PDF downloads : 4587