ISSN: 2165-7904
Journal of Obesity & Weight Loss Therapy
Make the best use of Scientific Research and information from our 700+ peer reviewed, Open Access Journals that operates with the help of 50,000+ Editorial Board Members and esteemed reviewers and 1000+ Scientific associations in Medical, Clinical, Pharmaceutical, Engineering, Technology and Management Fields.
Meet Inspiring Speakers and Experts at our 3000+ Global Conferenceseries Events with over 600+ Conferences, 1200+ Symposiums and 1200+ Workshops on Medical, Pharma, Engineering, Science, Technology and Business
Research Article Open Access
Relative Satiety Value of Candy and Gum: Potential Therapies for Childhood Obesity
| Hirsch JW1, Aiello SR2 and Hirsch AR1* | |
| 1Smell and Taste Treatment and Research Foundation at Chicago, USA | |
| 2University of Michigan, Ann Arbor, USA | |
| Corresponding Author : | Alan Hirsch Smell & Taste Treatment and Research Foundation Ltd., 845 North Michigan Avenue, Suite 990W, Chicago, IL. 60611, USA Tel: 312-649-5829 Fax: 312-649-0458 E-mail: dr.hirsch@smellandtaste.org |
| Received June 01, 2012; Accepted June 22, 2012; Published June 26, 2012 | |
| Citation: Hirsch JW, Aiello SR, Hirsch AR (2012) Relative Satiety Value of Candy and Gum: Potential Therapies for Childhood Obesity. J Obes Wt Loss Ther 2:139. doi:10.4172/2165-7904.1000139 | |
| Copyright: ©2012 Hirsch JW, et al. This is an open-access article distributed under the terms of the Creative Commons Attribution License, which permits unrestricted use, distribution, and reproduction in any medium, provided the original author and source are credited. | |
Visit for more related articles at Journal of Obesity & Weight Loss Therapy
| Introduction |
| Obesity is endemic in American society [1]. Two out of three adults are either overweight or obese, provoking a cascade of chronic diseases ranging from diabetes to osteoarthritis [2,3]. Similarly, children have not been spared such an affliction. In the last 30 years among US children 6-11 years old, obesity prevalence has quadrupled***[4,5]. Thirty-two percent are beyond normal weight [6]. Myriad factors have been postulated as contributors for this condition, primarily focusing upon reduced calorie expenditure coupled with excess consumption [7]. One of the mechanisms for regulation of such consumption is hunger, and its opposite, satiety, or the sense of fullness [8]. Hunger for food is the sensation of a desire or need to eat. Satiety is the sense of fullness or lack of desire to eat. Approaches that influence these may be useful in helping to reduce food intake. |
| A variety of factors have been postulated to impact satiety of both external and internal origin. External factors in food include bulk and volume, degree of flavoring, visual presentation, and relative fat, protein, and sugar content [9]. Internal mechanisms include the psychological, hormonal, physical, and chemosensory spheres. In the psychological realm, anywhere from the number of people with whom one eats, the duration of the meal, whether the television is playing during the meal, or even the belief that the food is of greater nutritional value, all affect the satiety level [10-13]. Hormones, including gherlin, and leptin similarly can affect satiety [14]. Ingestion of food physically expands the stomach, causing stretch receptors to fire, signaling a sense of fullness [15]. This effect of volume of food inducing satiety has been labeled, allesthesia [16]. The chemosensory system, through smell and taste, regulates feelings of hunger through the process of sensory specific satiety [17]. All of these work together in regulating perception of fullness. Thus, satiety is not solely based on the number of calories consumed, but rather, on more complex internal and external factors. |
| Regardless of the underlying physiological mechanisms, assessment of degree of satiety produced through consumption of different foods has been proposed. In that study, isocaloric foods were categorized based on degree of satiety compared to a standard of white bread in 13 adults in Australia [18]. |
| Use of commercially available chewing gum may also act to induce satiety. Chewing alone, without ingestion, has been suggested as a pathway for induction of satiety, possibly through jaw movement provoking release of serotonin, which indirectly acts to suppress appetite [19]. Experiments in adults have generally demonstrated mastication of chewing gum reduces hunger, and subsequent consumption. Mastication of unflavored gum decreased self-reported hunger ratings [20]. Consistent with these findings, food consumption after ten minutes of gum chewing was also demonstrated to be reduced [21]. Likewise, chewing sweetened and artificially sweetened gum for 30-45 minutes over a three-hour period decreased both hunger for sweets and sweet snack consumption [22,23]. |
| Contradictory results have also been reported. Chewing artificially sweetened gum compared to no gum chewing was shown to actually increase hunger [20]. In another study, fifty adults chewing a 3 gram serving of Wrigley's Juicy Fruit Gum for twenty minutes had no effect on visual analogue scale (VAS) measurement of hunger rating [24]. Thus, the impact of chewing gum on satiety remains a question. |
| The relative satiety values on children for different flavors of chewing gum or brands of gum have never been assessed. In addition to gum flavors and brands, no similar satiety classification has been established in foods preferred and commonly consumed by children. Furthermore, no one has ever assessed the relative satiety value of food and gum sharing similar sensory properties (beyond sweet or salty). |
| Experiment 1: The Relative Satiety Value of Candy Bars in American Children |
| The objective of this study was to determine if the satiety index which Holt had delineated using culturally relevant foods in Australian adults, would also apply to American children using hedonically preferred confectionaries [18]. |
| Methods |
| Using satiety index of Holt as a model [18], eight different types of candy were chosen for examination. These were selected based on authors' hedonic preferences, availability at the local drug store chain, and ease of distribution in isocaloric packaging. |
| All candies were segregated for disposition in approximately isocaloric amounts of 95 ± 5 Calories as follows: |
| White bread (Wonder Bread, Small), two slices, with a total of 95 calories was also chosen for a baseline value, as per Holt's study [18]. |
| Study subjects were recruited using a convenience sampling technique from seventh grade classes in a Chicago suburb. Selection criteria of volunteers was based on absence of allergy to nuts, no restriction with regard to eating of candy, and signed parental and child consent. All subjects were age 12 or 13. Forty-two percent [10] were boys and 58% [14] were girls. None experienced negative hedonics toward the foods tested. No one ate anything for one hour prior to testing, or anything other than test material during the testing session. Subjects were provided a different candy bar each day in a randomized order to avoid any influence of effect of order on presentation. Subjects, on a VAS, rated their degree of hunger from extremely hungry to full. (Figure 1) |
| This was completed immediately prior to, immediately after, and 15 and 30 minutes after eating, as signaled by the principal investigator. Subjects were required to complete consumption of candy bar within two minutes of initiation. Forms were filled out independently and without sharing of information. Data was collected, collated, and statistically analyzed similar to that of the methods of Holt [18]. In that study, prolonged degree of satiety and amount consumed in snacks and at the next meal correlated with self-rating of satiety at 15 and 30 minutes. Degree of satiety was calculated by determining the area under the curve, the AUC (Figure 2). |
| Integer values from one to seven were provided for each selfassessment hunger/satiety level, one being extremely hungry, and seven being full. |
| The satiety index was calculated by determining the 15 and 30 minute post-prandial satiety level, adjusting for the initial level of hunger (i.e., if initially full, even consumption of more food can not have an even greater effect on fullness, whereas if initially extremely hungry, a smaller amount of food may have a greater effect). |
| This was accomplished through the following calculation, |
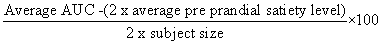 |
| This data was normalized (by multiplying by 1.15) to set white bread satiety index value equal to Holt's standard 100% [18]. |
| Results |
| With white bread as a reference of 100%, 100 kcal of different candies demonstrated substantial differences in their satiating capacities, despite isoenergetic servings (Table 2). |
| Starbursts and Gummy Bears were approximately a third more satiating than white bread. Star Bursts were 40% more satiating than Tootsie Rolls. |
| This study extends Holt's satiety index in regards to candy bars [18]. In that study, she found the average satiety index score for snacks and confectionary was 100; with Mars Bars being 70 and Jelly Beans 118. Those results were very close to what our findings were with similar candies: Twix 95.8, and Star Bursts, 135. Furthermore, this was confirmed in a subject size twice that of Holt's [18]. These findings further extend the concept of satiety index from Australian adults to American children and refine it in reference to specific American confectionaries. |
| Experiment 2: The Relative Satiety Value of Chewing Gum in American Children |
| This work examines if commercially available chewing gum falls under the spectrum of the satiety index when applied to children. A standardized control, 110 calorie white bread, was then used to compare satiety value of these chewing gums. |
| Methods |
| Using the same satiety assessment protocol as in experiment one, 11 different types of gum were chosen for examination. These were selected based on authors' hedonic preferences. |
| All gums tested were ≤ 5 calories per piece. White bread (Texas Toast, Butternut), one slice, with a total of 110 calories was chosen for a baseline value, as per Holt and Hirsch's studies [18,25]. |
| Selection criteria of volunteers were based on no restriction with regard to chewing gum, signed parental and child consent forms and were recruited as per experiment one protocol. One-half were of each gender. None experienced negative hedonics toward the gums tested. Satiety index was accomplished as per experiment 1. |
| This data was normalized (by multiplying by 1.28) to set white bread satiety index value equal to Holt's standard 100% [18]. Statistical significance was determined using the small sample student t test for the difference between two means, with a confidence level of 95% [26,27]. |
| Thus, the satiety of a slice of white bread served as the standardized control value, the independent variable was the type of gum, and the dependent variable was the satiety value of each type of gum. |
| Results |
| With white bread was set as a reference of 100%, the satiety index level of the gums tested ranked at different degrees of satiety (Table 3, Figure 3). |
| While Orbit Bubble mint was almost twice as satiating as Orbit Sweet mint, no statistically significant difference was seen with any gum compared to white bread (t ≤ 2.042 at 3 degrees of freedom, p > 0.05). Hence, all gums tested delivered approximately the same satiety index as white bread, however with less than 1/20th the calories. |
| Experiment 3: The Satiety Value of Sugar Free Orbit Bubblemint Chewing Gum |
| The goal of this study is to determine with a larger sample size the satiety value of Sugar Free Orbit Bubble mint Chewing Gum as compared to white bread. It was hypothesized that a stick of sugarless chewing gum has a satiety value approximately equivalent to that of white bread, the normal standard control for food satiety studies [18,25,28]. |
| Methods |
| With the same protocol of experiment 2, Sugar Free Orbit Bubble mint Chewing Gum with less than 5 calories per stick was chosen for examination. Study subjects were recruited using a convenience sampling technique from a middle and high school in a Chicago suburb. All subjects ranged from 12 to 17. Twelve were boys and ten were girls. None experienced negative hedonics towards the gum tested. |
| Satiety index was assessed as per experiment 2. This data was normalized (by multiplying by 2.08) to set white bread satiety index value equal to Holt's standard 100% [18]. Statistical significance was determined using the Sign Test [26,27]. |
| Thus, the satiety of a slice of white bread served as the standardized control value, the independent variable was the Sugar Free Orbit Bubble mint Chewing Gum, and the dependent variable was the satiety value of the gum. |
| Results |
| With white bread was set as a reference of 100%, the satiety levels of the Sugar Free Orbit Bubble mint Chewing Gum were as per Table 4 and Table 5. |
| Average satiety index for white bread equals 0.48. Setting the white bread satiety index to equal 1.00. |
| 0.48 x =100%, therefore x = 2.08 (correction factor). |
| Corrected satiety index of Sugar Free Orbit Bubble mint Chewing Gum: |
| 0.61 x 2.08 = 1.27 x 100 = 127% |
| While Sugar Free Orbit Bubble mint Chewing Gum was 27% more satiating, no statistically significant difference was seen compared to white bread. Using the Sign test, the two-sided p value equals 100%. Thus, the satiety index for both was not statistically significantly different. The hypothesis was accepted: the satiety index of these two was approximately equivalent. |
| Experiment 4: The Relative Satiety of Apple Pie Compared to Apple Pie Flavored Gum. |
| The goal of this study is to determine the satiety value of Wrigley's Extra Dessert Delight Apple Pie Sugar-Free Gum as compared to a 100 calorie slice of apple pie. |
| Methods |
| Experimental protocol was that of experiment 3. Using Wrigley's Extra Dessert Delight Apple Pie Sugar-Free Gum as a model and a slice of apple pie as the standard. |
| Market Pantry Apple Pie (Target Brand) is 2,280 calories. Cut into 23 equal slices, each slice contained approximately 100 calories. This level of calorie was chosen to conform with prior studies [18,25,28,29]. |
| Selection criteria of volunteers were based on no restriction with regard to chewing gum or eating pie and were recruited as per experiment three protocols. Subjects ranged from 13 to 16 years old (average 13.8). Thirteen were girls and 11 were boys. None experienced negative hedonics toward the gum or pie tested. |
| Satiety index was assessed as per experiment three. |
| Statistical significance was determined using the 2-tail Sign Test with statistical significance determined at p<0.05 [26,27]. |
| Thus, each person served as their own control, the independent variables were mastication of the Wrigley's Extra Dessert Delight Apple Pie Sugar-Free Gum and consumption of a 100 calorie slice of apple pie, and the dependent variables were the satiety values of the gum and the apple pie. |
| Results |
| Subjects were dichotomized based on whether they underwent testing first with gum or with apple pie. Satiety indexes were compared for gum tested first as compared to second. If no statistically significant difference was seen, it would suggest the absence of an effect of order of presentation. The same analysis was also performed for apple pie first versus second. No statistically significant difference was seen using the 2-tail Sign test for paired difference between means for the satiety indexes. For gum first, the average satiety index was 0.8125 for gum, and 0.75 for pie. For pie first, the average satiety index was 0.4688 for pie, and 0.9588 for gum. For pie first then gum, p=1.00. For first gum then pie, p= 0.065. These results demonstrate that the order of presentation was not the cause of the findings. |
| The combined groups (both gum and pie first) the average satiety index for gum equals 0.917, and for pie equals 0.563, the paired difference of which was not a significant difference (2-tailed p value = 0.096). Thus, the mean satiety value of Wrigley's Extra Dessert Delight Apple Pie Sugar-Free Gum is not statistically different from the mean satiety value of a 100 calorie slice of apple pie (Table 6A-6C,7A-7C and 8). |
| These results of the SIGN Test show that there is no statistically significant paired-difference between the Satiety Index for gum and the Satiety Index for pie in the group that was exposed to gum first (p<0.05). |
| Using the SIGN Test, 2-tailed p-value = 0.065. |
| These results of the SIGN Test show that, for a 2-tailed test, the paired-difference values of the Satiety Index for gum minus the Satiety Index for pie are not statistically significant (p<0.05). |
| Using the SIGN Test, and 2-tailed p-value = 0.096. |
| These p-value results of the SIGN Test show that there is not a statistically significant paired-difference between gum satiety and pie satiety using a 2-tailed test (p<0.05) |
| This statistical test demonstrates that the satiety index for a slice of apple pie and this flavored chewing gum are not significantly different from each other. The hypothesis was accepted: the satiety indexes of these two were statistically equivalent. |
| General Discussion |
| Hedonically positive popular isoenergic confections have a hierarchal influence on long-term satiety as determined by the satiety index. The reason for this is unknown, but may have to do with chemosensory influence [30,31]. For instance, Star Bursts have a 40% greater satiety value than Tootsie Rolls. Yet, on casual inspection, these candies seem very similar. Tootsie Rolls and Star Bursts both are individually packaged with multiple packages per portion, and are grossly similar in terms of texture, chewiness, and sweetness. However, Star Bursts, unlike Tootsie Rolls, possess different flavors with each portion, and thus, a more diverse chemosensory experience. This suggests that sensory induced satiety may be an important element in production of the satiety index. This can be investigated further by testing other foods with similar calorie and varying sensory characteristics |
| Hedonically positive commercially available sugar-free gums demonstrated a hierarchical influence on long-term satiety. This may be due to both chemosensory and kinesthetic influences [30,31]. Expanding the procedure to a greater variety of gums and foods may allow for the development of a "children's satiety index" which ultimately, may have utility as part of a child's weight control program. The equivalent satiety value of all gums tested suggests that it is the action of chewing the gum, more than the intrinsic properties of the gum itself, which has the satiating properties. Furthermore, that satiety from gum is equal to that of white bread, but with 1/20th the number of calories, suggests that chewing sugar-free gum should be considered as part of the therapeutic armamentarium in treatment of obesity in children. In light of the current crisis of childhood obesity, further exploration into this arena is warranted. |
| Limitations of Findings |
| Findings have to be considered with reference to subjects' selected and food assessed. While subject size was more than quadruple that of the original published reference [18], a larger sample size would have been preferred. Subjects were from suburban Chicago and thus were not geographically or demographically diverse. Different results may have been found in other geographic regions in the US. Likewise, different age groupings of children may present with alternative satiety index scores. Like so many other physiological parameters which change throughout childhood and adolescence, the satiety value of foods or gums consumed or masticated by a five year old may not be identical to that of a 17 year old. |
| The food or gums chosen to evaluate may have influenced the results. Non-confectionary foods and high calorie gums were not evaluated, and this may have provided additional important satiety index values. The total calories provided in our study were approximately one half of that of Holt in the candy study and 1/40th in the gum studies [18]. We don't believe this had any substantial influence since the satiety index we found closely resembled the confectionary satiety index of Holt's. Part of the rationale for choosing the candies and gums in the study was the authors' hedonic preference. It is unknown to what degree hedonics influence satiety index. This deserves further exploration. |
| Experimental Error |
| There are several sources of possible experimental error. Experiment design mandated a period of fasting prior to initiation of study. While not at lunch, it is possible students secretively may have eaten during these food-free class periods. If this happened, initial hunger may have been less, and a ceiling effect may have occurred and thus, true gum or pie-induced satiety may have exceeded what was actually recorded. The Hawthorne Effect may have also skewed data. The Hawthorne Effect is whereby the mere act of observation and recording effects results [32]. Forcing subjects to record their level of satiety, may in and of itself, have influenced their levels of satiety. Further evidence for the presence of this may be extrapolated from the study of more wedges which found that imagining eating a food, in and of itself, induces a reduction in desire to eat that food [33]. However, such an effect should have influenced the pie, bread, and the gum equally. No effect of stage in menstrual cycle for female subjects was controlled. This may be relevant since such hormonal changes can affect satiety [34]. This is unlikely in this sample since one would not anticipate all female subjects to be at the same state, and moreover any hormonal changes would have affected satiety assessment of the food and gum equally in each individual. |
| Conclusion |
| In children candy bars show distinct levels of satiety indices. The multi-flavored, different sensory stimulating and tensile nature Starbursts led to further investigation of gums with varying sensory characteristics. Chewing gum is as satisfying as white bread, with 1/20th the caloric intake. Further exploration showed that the action of chewing was responsible for equal satiety values across several flavors of chewing gum. When comparing chewing gum satiety values of the chewing gum to white bread, the satiety values were found to be equivalent. Similarly, chewing a piece of apple pie flavored gum as satiating as eating a 100 calorie slice of apple pie. Chewing sugarfree gum should be considered as part of the therapeutic approach in treatment of obesity in children. In light of the current crisis of childhood obesity, further exploration into this arena is warranted. |
References
- Flum DR, Khan TV, Dellinger EP (2007) Toward the rational and equitable use of bariatric surgery. JAMA 298: 1442-1444.
- Flegal KM, Carroll MD, Ogden CL, Curtin LR (2010) Prevalence and trends in obesity among US adults 1999-2008. JAMA 303: 235-241.
- Gaziano JM (2010) Fifth Phase of the Epidemiologic Transition: The Age of Obesity and Inactivity. JAMA 303: 275-276.
- Ogden CL, Carroll ME, Kit BK, Flegal KM (2012) Prevalence of obesity in the United States, 2009-2010. NCHS Data Brief 1-8.
- Troiano RP, Flegal KM, Kuczmarski RJ, Campbell SM, Johnson CL (1995) Overweight prevalence and trends for children and adolescents: the National Health and Nutrition Examination Surveys, 1963 to 1991. Arch Pediatr Adolesc Med 149: 1085-1091.
- Ogden CL, Carroll MD, Curtin LR, Lamb MM, Flegal KM (2010) Prevalence of High Body Mass Index in US Children and Adolescents, 2007-2008. JAMA 303: 242-249.
- McTigue KM, Harris R, Hemphill B, Lux L, Sutton S, et al. (2003) Screening and interventions for obesity in adults: summary of the evidence for the US Preventative Services Task Force. Ann Intern Med 139: 933-949.
- Kruse HP (2001) Can satiety be measured? Nahrung 45: 298-301.
- Cabanac M (1990) Taste: the maximization of multidimensional pleasure. In: Capaldi ED, Powley TL (Eds.). Taste, experience, and feeding. American Psychological Association Washington, DC.
- de Castro JM (2000) Eating behavior: lessons from the real world of humans. Nutrition 16: 800-813.
- Rozin P (1990) The importance of social factors in understanding the acquisition of food habits. In: Capaldi ED, Powley TL (Eds.). Taste, experience, and feeding. American Psychological Association Washington, DC.
- Lowe MR, Bocarsley ME, DelParigi A (2008) Human eating motivation in times of plenty: Biological, environmental, and psychosocial influences. In: Harris RBS, Mattes RD (Eds.). Appetite and food intake: behavioral and psychological considerations. Taylor & Frances, London.
- Meiselman HL (2006) The role of context in food choice, food acceptance and food consumption. In: Shepherd R, Raats M (Eds.). The psychology of food choice. CABI, Cambridge, USA.
- Teff KL, Kapadia C (2008) Role of postabsorptive endocrine factors on human feeding and regulation of body adiposity. Appetite and food intake: behavioral and physiological, CRC press.
- Peters HPF, Mela DJ (2008) The role of the gastrointestinal tract in satiation, satiety, and food intake: evidence from research in humans. In: Harris, RBS, Mattes RD (Eds.). Appetite and food intake: behavioral and psychological considerations. CRC Press, Boca Raton.
- Bartoshuk LM (1990) Distinctions between taste and smell relevant to the role of experience. In: Capaldi ED, Powley TL (Eds.). Taste, experience, and feeding. American Psychological Association, Washington, DC.
- Rolls ET (1993) The neural control of feeding in primates. In: Booth DA (Ed.). Neurophysiology of ingestion. Pergamon Press Inc, Tarrytown, NY.
- Holt SH, Miller JC, Petocz P, Farmakalidis E (1995) A satiety index of common foods. Eur J Clin Nutr 49: 675-690.
- Curro FA (2008) Gum chewing as an adjunct to use of medications. J Am Dent Assoc 139: 6S-8S.
- Todoff M, Alleva A (1990) Oral stimulation with aspartame increases hunger. Physiol Behav 47: 555-559.
- Sakata O, Kohyama K, Satake T, Saito Y (2008) Extraction of Alpha Activities from an EEG Obtained During Gum Chewing. IEEJ Trans Elec Electron Engg 3: 324-333.
- Hetherington MM (2005) Potential role for chewing in satiety and appetite control. Am Dietet Assoc Annual Mtg.
- Hetherington MM, Boyland E (2007) Short-term effects of chewing gum on snack intake and appetite. Appetite 48: 397-401.
- Julis RA, Mattes RD (2007) Influence of sweetened chewing gum on appetite, meal patterning and energy intake. Appetite 48: 167-175.
- Hirsch AR, Soto MO, Hirsch JA (2010) The Relative Satiety Value of Candy Bars in American Children. Smell & Taste Treatment and Research Foundation.
- Mendewhall W, Reinmuth JE (1978) Statistic for management and economics. Duxbury Press, North Scitvate, MA.
- Crow EL, Davis FA, Maxfield MW (1960) Statistics manual. Dover Publications, New York.
- Hirsch JW, Soto M, Hirsch AR (2011) The Relative Satiety Value of Chewing Gum on American Children. Chemical Senses 36: 843.
- Hirsch JW, Soto M, Hirsch AR (2011) The Relative Satiety Value of Sugar Free Orbit Bubblemint Chewing Gum in American Children. AChemS XXXIV.
- Rolls ET (2005) Taste, olfactory, and food texture processing in the brain, and the control of food intake. Physiol Behav 85: 45-56.
- Rolls BJ, Rolls ET, Rowe EA, Sweeney K (1981) Sensory specific satiety in man. Physiol Behav 27: 137-142.
- Rosenthal R (1996) Experimenter effects in behavioral research. Appleton-Centruy-Crofts, New York.
- Morewedge CK, Huh YE, Vosgerau J (2010) Thought for food: imagined consumption reduces actual consumption. Science 330: 1530-1533.
- Dye L, Blundell JE (1997) Menstrual cycle and appetite control: implications for weight regulation. Hum Reprod 12: 1142-1151.
Tables and Figures at a glance
| Table 1 | Table 2 | Table 3 | Table 4 |
| Table 5 | Table 6 | Table 7 | Table 8 |
Figures at a glance
 |
 |
 |
| Figure 1 | Figure 2 | Figure 3 |
Relevant Topics
- Android Obesity
- Anti Obesity Medication
- Bariatric Surgery
- Best Ways to Lose Weight
- Body Mass Index (BMI)
- Child Obesity Statistics
- Comorbidities of Obesity
- Diabetes and Obesity
- Diabetic Diet
- Diet
- Etiology of Obesity
- Exogenous Obesity
- Fat Burning Foods
- Gastric By-pass Surgery
- Genetics of Obesity
- Global Obesity Statistics
- Gynoid Obesity
- Junk Food and Childhood Obesity
- Obesity
- Obesity and Cancer
- Obesity and Nutrition
- Obesity and Sleep Apnea
- Obesity Complications
- Obesity in Pregnancy
- Obesity in United States
- Visceral Obesity
- Weight Loss
- Weight Loss Clinics
- Weight Loss Supplements
- Weight Management Programs
Recommended Journals
Article Tools
Article Usage
- Total views: 16565
- [From(publication date):
July-2012 - Aug 19, 2025] - Breakdown by view type
- HTML page views : 11966
- PDF downloads : 4599