Research Article Open Access
Alleviation of the Effects of Copper Chloride on Vigna unguiculata (L) using Ulva lactuca
Duraipandian M1, Sevugaperumal R1, Ramasubramanian V1* and Ganesh D2
1Department of Botany, Ayya Nadar Janaki Ammal College, Sivakasi, Virudhunagar District, Tamil Nadu, India
2School of Biotechnology, Madurai Kamaraj University, Madurai, Tamil Nadu, India
- *Corresponding Author:
- Ramasubramanian V
Department of Botany
Ayya Nadar Janaki Ammal College, Sivakasi
Virudhunagar District, Tamil Nadu, India
Tel: +919443225407
E-mail: drvrams@gmail.com
Received date: November 16, 2016; Accepted date: December 7, 2016; Published date: December 22, 2016
Citation: Duraipandian M, Sevugaperumal R, Ramasubramanian V, Ganesh D (2016) Alleviation of the Effects of Copper Chloride on Vigna unguiculata (L) using Ulva lactuca. Biochem Physiol 5:213. doi:10.4172/2168-9652.1000213
Copyright: © 2016, Duraipandian M, et al. This is an open-access article distributed under the terms of the Creative Commons Attribution License, which permits unrestricted use, distribution and reproduction in any medium, provided the original author and source are credited
Visit for more related articles at Biochemistry & Physiology: Open Access
Abstract
Our environment is polluted from heavy metal using industries. It is due to anthropogenic activities. The heavy metals are in excess is toxic to animals, plants and microorganisms. The excess of copper can affect the entire plant systems. Copper is one of the major source pollutants in ocean and terrestrial. To remove the excess copper pollution by biosorption is an easiest technique by using Ulva lactuca. In this present study, Cow pea Vigna unguiculata (L) seedlings were treated with 6 mM copper chloride, water control and Ulva lactuca bio sorbent (2 g/L, 4 g/L, 6 g/L and 8 g/L), its influence on the biochemical, enzymatic and morphometric characteristics were studied. The morphometric parameters such as fresh weight, leaf area, shoot length, dry weight and root length is increased than that of 6 mM treated control. The pigments such as chlorophyll a, chlorophyll b, total chlorophyll, carotenoids are steadily increased and anthocyanin content was decreased than the control 6 mM copper chloride. Biochemical characters such as protein and soluble sugar were increased with 6 mM of copper chloride. On the opposing the contents of proline, free amino acid, total phenol and leaf nitrate were decreased in the 6 mM of copper chloride. The enzyme activities such as peroxidase, catalase are decreased and the nitrate reductase is increased. Atomic Absorption Spectroscopy (AAS) was employed to conclude the copper in the treated and control plants and 6 mM Cu2+ reveals that vigorously affected the Vigna unguiculata (L) (cow pea) plants and The green algae Ulva lactuca is effectively biosorbed the copper heavy metal and get rid from soil pollution and improve crop yield.
Keywords
Cow pea; Copper toxicity; Bio sorption; Atomic absorption spectroscopy.
Introduction
Heavy metal pollution is common in India. Mining and agriculture areas are the documented cases of metal toxicity. Heavy metal toxicity is the primary concern and bioavailability of the heavy metals plays many roles in the soil. Organic matter, pH, clays, redox conditions and hydrous oxides and total metal concentrations these factors affect the bioavailability. Heavy metal toxic due to human influences such as metal releasing industries [1]. Copper ion as an essential micronutrient and is important in maintaining cellular homeostasis [2]. However, Excess of copper is highly toxic to growth of plants, damage the plant internal structure and completely inhibit the plant growth.
The heavy metal copper at high concentrations to the plants show the blue to brown or yellow in colour and growth is stunted. Excess copper levels decrease plant vigour, iron intake and seed germination. Various problems arise during the neutralizing copper in soil. The copper toxicity is due to continuous use of fungicides. The persistence of copper in soil is many years and has solubility is low.
Copper is not regularly present at higher concentration in soil, but when it’s present at above the permissible concentration then it effects the environment [3]. Copper toxicity is a problem of both agricultural and environmental significance. Sources of copper contamination by agrochemicals, agricultural wastes, urban, smelting, mining and industries. The indicator of bioavailability of copper is Cu2+ [4]. Macro algae are among the most complex and reliable organisms in studies of heavy metal pollution due to their rapid rate of metal accumulation from aqueous solutions [5].
Biological monitoring of marine water primarily focuses on the red algae [6], brown algae [7] and most of the studies says that Ulva lactuca accumulate high heavy metals and only concentrations of these elements in the organisms, and not of the sample site (water, sediments) have been characterized.
Various organisms are used to analyse the heavy metal concentrations in natural environment on the extent of contamination and shall reveal possible applications of using Ulva lactuca as bioindicator [8]. Most studies reported the Ulva lactuca do accumulate and bio indicate the heavy metal ions. Most of the Ulva lactuca algae are grown in marine and brackish water [9].
Materials and Methods
The Experimental and control plants seeds were allowed to grow in 1:1:1 ratio of uniformly mixed red, black and sandy soil and allowed to grow in the seeds. After twelve days, the seedling of (cow pea) Vigna unguiculata (L) were treated with various concentrations of copper chloride with Ulva lactuca was collected from uvari coastal area Tamil Nadu, shade dried and finally powdered by milling (Set I).
The optimum concentration of 6 mM of copper level based on LSD analysis [10] was mixed with various concentrations (2 g/L, 4 g/L, 6 g/L and 8 g/L) of Ulva lactuca seaweed dry powder, constantly shaken in shaker for 12 h, filtered using filter paper and the plants of another set was treated with the filtrate (Set II).
Twelve days later plants of Set I and Set II, the growth parameters such as root length and shoot length are measured by scale and represented in cm2. The morphology of leaf area was measured by conventional graphical method by drawing the outline of the leaf in a graph sheet and counting the small and big squares with in it and expressed in cm2. The dry weight and fresh weight of the seedlings were obtained using an electronic weighing balance.
To quantify the chlorophyll from leaves, fresh leaves were deveined and cut into small bits, from the pool leaf bits, a sample of 100-200 mg was weighed. The leaf bits were homogenized in 100% acetone liquid using mortar and pestle. The homogenate was centrifuged at 4000 rpm (revolution per minute) for 5 min at room temperature (27ºC). Extraction with 100% acetone liquid was repeated till the pellet becomes white/pale yellow in colour. The supernatant was used for the estimation of photosynthetic pigments.
In spectrophotometric measurements the blanks were used for the subtraction of all the readings. The absorbance was measured at 645 nm, 470 nm and 662 nm, for chlorophyll a, chlorophyll b and carotenoids respectively using a lab systronics spectrophotometer model no: 106. The amount of chlorophyll b, total chlorophyll and chlorophyll a was calculated using the formulae of Welburn and Lichtenthaler [11].
Chlorophyll a (mg/L)=11.75 × A662-2.35 × A645
Chlorophyll b (mg/L)=18.61 × A645-3.96 × A662
Total chlorophyll=chlorophyll a+chlorophyll b
The carotenoid content was calculated using the following formula:
Xanthophyll+Carotenes=1000 × A470-2.27 Ca-8.14 Cb/227
Ca=Total chlorophyll a
Cb=Total chlorophyll b
The anthocyanin content was estimated by inoculating 200 mg of leaf samples inoculating in 200 ml of extraction medium that consists of methanol, diluted water and HCl acid in the ratio of 50:20:1, respectively. The incubation was extended to 48 h at 4ºC in dark condition with agitation. After 48 h, the solution was collected and the optical density is measured at 630 nm and 657nm. The absorbance value of anthocyanin content was estimated by Mancinelli et al. method [12].
Absorbance of anthocyanin=A530–0.3 × A657
The total soluble sugar or glucose was measured by anthrone solvent method likewise the total amino acid content was measured by ninhydrin indicator method [13]. The protein content was measured, alkaline copper mixture with folin phenol [14]. The proline was estimated using glacial acetic acid and sulphosalicylic acid [15]. The biochemicals were estimated using standard value. The in vivo nitrate reductase (NR) enzyme activity was assayed according to Jaworski et al. [16] method with modification. 100 mg fresh leaf material chopped and it was incubated in scintillation vials containing 5 mL of incubation medium composed of 200 mM KNO3, 100 mM KH2PO4- KOH buffer pH 7.5, 1% (v/v) n-propanol and 0.1% Triton X 100(v/v). Incubation was carried out in dark for 1 h at room temperature (27ºC) with occasional shaking. Aliquots of 0.5 ml was taken from the vials and analysed for nitrite after 1 h incubation. To 0.5 ml distilled water (H2O), 1 of 3% sulphanilamide and one ml of N-1-N (Naphthyl ethylene-diamine dihydrochloride) were added in quick succession. 15 min were allowed for colour formation and absorbance was measured at 540 nm. The nitrite was estimated with the help of a standard nitrite curve. The activities of peroxidase and catalase enzyme extracts of the leaves of experimental plants were extracted by grinding per gram of leaf in five mL of 100 mM phosphate buffer (pH 6.0) and filtered through a three layered cheese cloth and run at 3000 rpm for 30 min. The supernatant obtained was served as the source for crude enzymes such as peroxidise and catalase. To assay peroxidise enzyme activity, the enzyme extract was added to pyrogallol which gets oxidized to a coloured derivative in the presence of hydrogen peroxide (H2O2) (1% v/v).
The amount of pupurogallin formed during the reaction was assayed spectroscopically [17]. To 2 mL of pyrogallol phosphate buffer (0.058 M pyrogallol dissolved in 0.1 M phosphate buffer pH 6.0), an aliqot of 0.1 ml of enzyme extract was added. Then, absorbance was set to zero at 420 nm. To this, 0.5 mL of hydrogen peroxide (H2O2) (1% v/v) was added. Then, the content was thoroughly mixed and the absorbance was measured using systronics model no. 106 spectrophotometer. The difference in the absorbance at an interval of 20 s for a period of 3 min was measured. The peroxidise activity was expressed as moles of hydrogen peroxide (H2O2) reduced per unit enzyme per unit time.
To assay the catalase enzyme activity, three ml of phosphate buffer was added to one mL of H2O2 and one ml of enzyme extract [18]. The reaction mixture was incubated at 25ºC for 1 min. The reaction was terminated by the addition of 1 ml of sulphuric acid (H2SO4). The end point was the persistence of pink colour at least for 15 s. The catalase activity was expressed in micromoles hydrogen peroxide (H2O2) catalysed per unit time per mg protein. The heavy metal accumulation of the experimental plants was analysed at the end of the plant life. Heavy metal copper concentrations in plants were analysed using Baker et al. method [19,20].
The plant sample as a whole was washed, dried in oven at 160ºC for 40 min and digested in a mixture of (HNO3) and perchloric acid (10:1). Then the solution was centrifuged at 5000 rpm (revolution per minute) for 5 min and double filtered with What mann filter paper no: 4 and the filtrate was analysed for copper concentration by Atomic Absorption Spectrometry (Shimadzu Model AA–6300), available in the Science Instrumentation Centre of Ayya Nadar Janaki Ammal College (Autonomous), Sivakasi, Tamil Nadu.
Statistical Analysis
For the growth parameters the average value of ten independent samples and for the enzymatic readings, pigmental parameters and biochemical parameters the average value of five were considered. The data were reported as mean ± SE (standard error) and the percent activity was represented in the parentheses. Statistical analysis - One way ANOVA – Turkey test was done using the statistical package, Origin – version 7.0.
Results
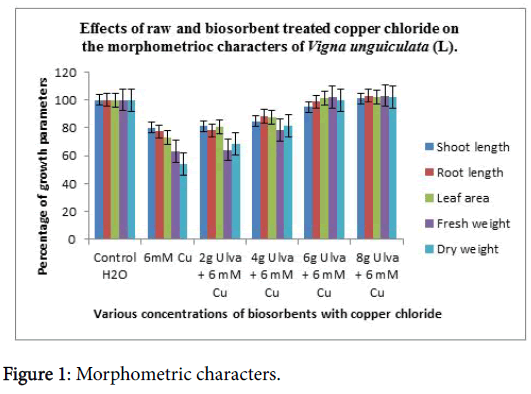
The results obtained from both Sets I and II on the effects of different concentration of copper chloride were summarized and discussed. The results showed that the measured by centimetre scale used to measure growth characters such as shoot length, root length, fresh weight, dry weight and leaf area increased in plants supplied with bio sorbent treated copper chloride with Ulva lactuca (Table 1 and Figure 1).
| Concentration | Shoot length | Root length | Leaf area | Fresh weight | Dry weight |
|---|---|---|---|---|---|
| Control (H2O) | 48.00 ± 0.0577 (100) | 16.30 ± 0.115 (100) | 13.70 ± 0.115 (100) | 02.85 ± 0.028 (100) | 0.16 ± 0.005 (100) |
| 6 mM Cu2+ | 38.53 ± 0.290 (80.30) | 12.60 ± 0.322 (77.30) | 10.05 ± 0.008 (73.40) | 01.80 ± 0.057 (63.20) | 0.08 ± 0.003 (54.20) |
| 2 g Ulva+6 mM Cu2+ | 39.00 ± 0.577aâ?° (81.30) | 12.75 ± 0.180aâ?° (78.26) | 11.02 ± 0.011aâ?° (80.40) | 01.82 ± 0.012aâ?° (64.10) | 0.11 ± 0.011aâ?° (68.80) |
| 4 g Ulva+6 mM Cu2+ | 40.66 ± 0.881aâ?° (84.70) | 14.39 ± 0.180aâ?° (88.30) | 12.04 ± 0.021aâ?° (87.90) | 02.23 ± 0.040aâ?° (78.40) | 0.13 ± 0.005aâ?° (81.30) |
| 6 g Ulva+6 mM Cu2+ | 45.66 ± 0.666aâ?° (95.10) | 16.11 ± 0.160aâ?° 98.80) | 13.80 ± 0.173aâ?° (101) | 02.89 ± 0.026aâ?° (102) | 0.16 ± 0.005aâ?° (100) |
| 8 g Ulva+6 mM Cu2+ | 48.33 ± 0.333aâ?° (101) | 16.75 ± 0.178aâ?° (103) | 14.03 ± 0.012aâ?° (100) | 02.94 ± 0.010aâ?° (103) | 0.16 ± 0.003aâ?° (102) |
| Values are an average of six observations. Values in parenthesis are percentage activity with respect to control. Mean ± SE a – 2 g, 4 g, 6 g and 8 g Ulva lactuca treatment compared with control, â?°Significance (P ≤ 0.05 – Turkey test) | |||||
Table 1: Effects of raw and bio sorbent treated copper chloride on the growth parameters of Vigna unguiculata (L).
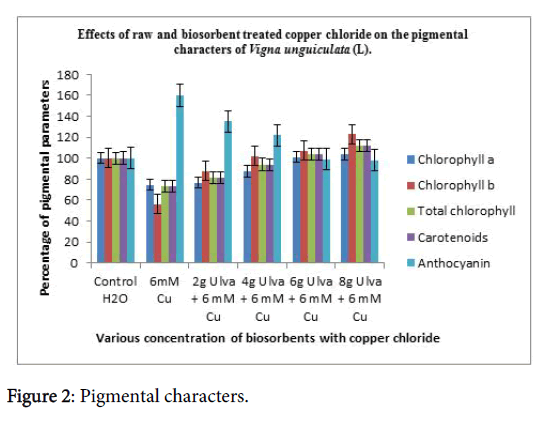
| Concentration | Chlorophyll a (mg/g LFW) | Chlorophyll b (mg/g LFW) | Total chlorophyll (mg/g LFW) | Carotenoids (mg/g LFW) | Anthocyanin (mg/g LFW) |
|---|---|---|---|---|---|
| Control (H2O) | 21.25 ± 0.340 (100) | 17.50 ± 0.360 (100) | 38.42 ± 0.443 (100) | 00.34 ± 0.005 (100) | 15.83 ± 0.061 (100) |
| 6 mM Cu2+ | 15.84 ± 0.096 (74.60) | 09.86 ± 0.098 (56.30) | 28.15 ± 0.324 (73.3) | 00.25 ± 0.002 (73.2) | 25.27 ± 0.163 (160) |
| 2 g Ulva+6 mM Cu2+ | 16.28 ± 0.169aâ?° (76.6) | 15.39 ± 0.163aâ?° (87.9) | 31.34 ± 0.512aâ?° (81.6) | 00.27 ± 0.002aâ?° (81.4) | 21.37 ± 0.480aâ?° (135) |
| 4 g Ulva+6 mM Cu2+ | 18.57 ± 0.302aâ?° (87.4) | 17.88 ± 0.082aâ?° (102) | 36.12 ± 0.558aâ?° (94) | 00.35 ± 0.007aâ?° (93.7) | 19.31 ± 0.497aâ?° (122) |
| 6 g Ulva+6 mM Cu2+ | 21.55 ± 0.653aâ?° (101) | 18.78 ± 0.247aâ?° (107) | 40.01 ± 0.816aâ?° (104) | 00.35 ± 0.007aâ?° (104) | 15.71 ± 0.191aâ?° (99.2) |
| 8 g Ulva+6 mM Cu2+ | 22.08 ± 0.019aâ?° (104) | 21.46 ± 0.095aâ?° (123) | 43.29 ± 0.387aâ?° (113) | 00.38 ± 0.0009aâ?° (112) | 15.53 ± 0.187aâ?° (98.1) |
| Values are an average of six observations. Values in parenthesis are percentage activity with respect to control. Mean ± SE a – 2 g, 4 g, 6 g and 8 g Ulva lactuca treatment compared with control, â?°Significance (P ≤ 0.05 – Turkey test) | |||||
Table 2: Effects of raw and bio sorbent treated copper chloride on the pigmental characters of Vigna unguiculata (L).
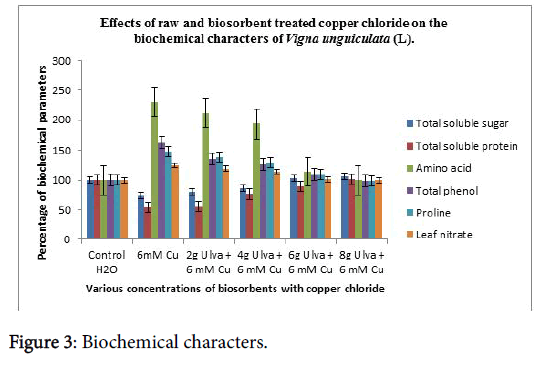
| Concentration | Total soluble sugar (mg/g LFW) | Total soluble protein (mg/g LFW) | Amino acid (µMole/g LFW) | Total phenol (µMole/g LFW) | Proline (µMole/g LFW) | Leaf nitrate (µMole/g LFW) |
|---|---|---|---|---|---|---|
| Control (H2O) | 04.56 ± 0.134 (100) | 03.60 ± 0.052 (100) | 02.88 ± 0.277 (100) | 03.58 ± 0.036 (100) | 07.22 ± 0.129 (100) | 00.17 ± 0.001 (100) |
| 6 mM Cu2+ | 03.36 ± 0.051 (73.70) | 01.93 ± 0.024 (53.70) | 06.65 ± 0.190 (230) | 05.82 ± 0.108 (163) | 10.71 ± 0.050 (148) | 00.22 ± 0.0004 (125) |
| 2 g Ulva+6 mM Cu2+ | 03.64 ± 0.020aâ?° (79.7) | 02.00 ± 0.023aâ?° (55.7) | 06.12 ± 0.243aâ?° (212) | 04.83 ± 0.112aâ?° (135) | 10.02 ± 0.089aâ?° (139) | 00.21 ± 0.002aâ?° (119) |
| 4 g Ulva+6 mM Cu2+ | 03.93 ± 0.029aâ?° (86.1) | 02.53 ± 0.108aâ?° (76.3) | 05.60 ± 0.157aâ?° (194) | 04.52 ± 0.075aâ?° (126) | 09.30 ± 0.015aâ?° (129) | 00.20 ± 0.001aâ?° (114) |
| 6 g Ulva+6 mM Cu2+ | 04.70 ± 0.040aâ?° (103) | 03.50 ± 0.146aâ?° (89.1) | 03.28 ± 0.196aâ?° (114) | 03.92 ± 0.018aâ?° (110) | 07.90 ± 0.109aâ?° (109) | 00.17 ± 0.003aâ?° (101) |
| 8 g Ulva+6 mM Cu2+ | 04.85 ± 0.112aâ?° (106) | 03.68 ± 0.008aâ?° (102) | 02.88 ± 0.186aâ?° (99.9) | 03.53 ± 0.044aâ?° (98.6) | 07.08 ± 0.247aâ?° (98.1) | 00.17 ± 0.001aâ?° (100) |
| Values are an average of six observations. Values in parenthesis are percentage activity with respect to control. Mean ± SE a – 2 g, 4 g, 6 g and 8 g Ulva lactuca treatment compared with control, â?°Significance (P ≤ 0.05 – Turkey test) | ||||||
Table 3: Effects of raw and bio sorbent treated copper chloride on the biochemical characters of Vigna unguiculata (L).
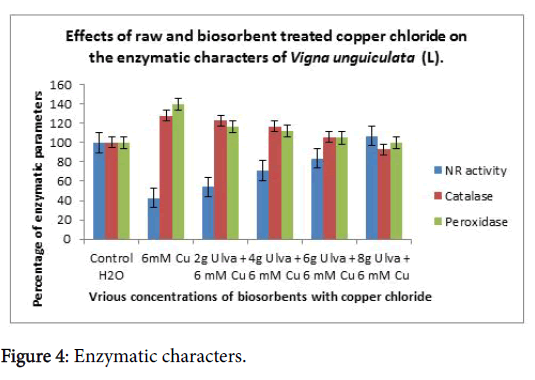
| Concentration | NR Activity (µMole/g LFW) | Catalase (µMole/g LFW) | Peroxidase (µMole/g LFW) |
|---|---|---|---|
| Control (H2O) | 02.23 ± 0.101 (100) | 03.20 ± 0.038 (100) | 08.73 ± 0.331 (100) |
| 6 mM Cu2+ | 00.91 ± 0.066 (42.7) | 04.09 ± 0.021 (128) | 12.22 ± 0.310 (140) |
| 2 g Ulva+6 mM Cu2+ | 01.20 ± 0.040aâ?° (53.9) | 03.94 ± 0.045aâ?° (123) | 10.20 ± 0.197aâ?° (117) |
| 4 g Ulva+6 mM Cu2+ | 01.55 ± 0.105aâ?° (71) | 03.73 ± 0.038aâ?° (117) | 09.74 ± 0.340aâ?° (112) |
| 6 g Ulva+6 mM Cu2+ | 02.00 ± 0.072aâ?° (83.8) | 03.40 ± 0.032aâ?° (106) | 09.20 ± 0.079aâ?° (105) |
| 8 g Ulva+6 mM Cu2+ | 02.33 ± 0.075aâ?° (107) | 02.97 ± 0.058aâ?° (93.1) | 08.71 ± 0.160aâ?° (99.8) |
| Values are an average of six observations. Values in parenthesis are percentage activity with respect to control. Mean ± SE a – 2 g, 4 g, 6 g and 8 g Ulva lactuca treatment compared with control, â?°Significance (P ≤ 0.05 – Turkey test) | |||
Table 4: Effects of raw and bio sorbent treated copper chloride on the enzymatic characters of Vigna unguiculata (L).
| Sample | AAS in ppm |
|---|---|
| Sample 1 (Control) | 4.6977 |
| Sample 2 (6 mM Cu) | 5.7085 |
| Sample 3 (2 g Ulva+6 mM) | 5.2196 |
| Sample 4 (4 g Ulva+6 mM) | 4.8925 |
| Sample 5 (6 g Ulva+6 mM) | 3.5288 |
| Sample 6 (8 g Ulva+6 mM) | 3.1244 |
Table 5: Atomic absorption spectroscopic studies.
The levels of chlorophyll content and carotenoid content increased but the level of anthocyanin content decreased (Table 2 and Figure 2). Similarly the protein content and total soluble sugar content increased and the free amino acid, total phenol, proline and leaf nitrate decreased (Table 3 and Figure 3). The activity of nitrate reductase (NR) activity increased, but the catalase and peroxidase decreased (Table 4 and Figure 4). The copper content of the treated and control seedling of Vigna unguiculata (L) was finally estimated using Atomic absorption spectroscopy study (Table 5).
Discussion
The exposure of plants to toxic levels of heavy metals triggers a wide range of physiological and metabolic alterations [21,22]. In the present study, a remarkable positive correlation between soil and shoot Cu2+ concentrations was observed, and the Cu2+ concentration reached 43 and 119 mg/kg (DW) with the 0.2 and 1.0 mM/kg Cu2+ treatments, respectively [23]. A 12 h exposure to 6 mM Cu2+ killed >70% of yeast cells and <2% remained viable when treated with 8 mM Cu2+ [24]. Plant shoots shows interveinal chlorosis with highest copper concentrations with Iron (Fe) deficiency [25].
The Ulva treated crop plants do increase betaines and increase photosynthetic pigments [26] and do increase chloroplasts [27]. The 1% Ulva extract along with 50% chemical fertilizers enhanced the content of protein, carbohydrate and lipid in Tagetus erecta [28].
The Ulva lactuca showed 50% decrease in nitrate and ammonium concentrations [29]. Ulva lactuca extract contain ascorbic acid, proline, and glutathione required for the induction of antioxidant enzymes responsible for decreasing ROS levels in the salinity stressed plant [30-32]. The Ulva biosorbed plants do increase selenate and it is responsible for the level of phenols and flavonoids increment [33].
The antioxidant activities such as nitrate reductase activities to the seaweed extract by foliar application provides the assimilation of biostimulant by leaves such as growth hormone or other metabolites that were responsible for enhancement of nitrate reductase activity, the foliar application of seaweed extract increased this enzymatic activity and Ulva rigida extract was found more effective than Fucus spiralis [34]. The SWE enhance the tolerance of salt stress by activation of antioxidant enzymatic system of SOD, CAT and APX and by increasing the total phenolic content which contributes to protection of plants against oxidative damage to plant cell catalysed by reactive oxygen species [35]. The pre-treatments with seaweed extract in crop plants show the catalase and peroxidase activities were significantly suppressed [36].
The presented data with the possible molecular mechanism involved with the biosorption of excess heavy metal ion (Cu2+) by Ulva lactuca dry powder extract and get polluted soil become fertile for plant growth.
References
- Helmisaari HS, Derome J, Fritze H, Nieminen T, Palmgren K, et al. (1995) Copper in scots pine forests around a heavy metal smelter in South – Western Finland. Water Air and Soil Pollution 85: 1727-1732.
- Marschner P (1995) Mineral nutrition of higher plants. Academic Press 2: 889.
- McBride MB, Richards BK, Steehuis T, Russo JJ, Sauve S (1997) Mobility and solubility of toxic metals and nutrients in soil fifteen years after sludge application. Soil Sci 162: 487-500.
- Sauve S, Cook N, Hendershot WH, McBride MB (1996) Linking plant tissue concentrations and soil copper pools in urban contaminated soils. Environmental Pollution 94: 153-157.
- Phillips DJH (1977) The use of biological indicator organisms to monitor trace metal pollution in marine and esturine environments. Environmental Pollution 13: 281-317.
- Muse JO, Tudino MB, d’Huicque L, Troccoli OE, Carducci CN (1995) A survey of some trace elements in seaweeds from patagonia, argentina. Environmental Pollution 87: 249-253.
- Bryon GW, Hummerstone LG (1973) Brown seaweed as indicator of heavy metals in estuaries in south-west England. J Mar Biol Assoc 53: 705-720.
- Villares R, Puente X, Carballeira A (2002) Seasonal variation and background levels of heavy metals in two green seaweeds. Environmental Pollution 119: 79-90.
- Rybak A, Messyasz B (2010) Occurrence of macroalgae from the ulva genera (Ulvaceae: Chlorophyta) in the wielkopolska region. Nad Fizj Pol Zach Ser Bot 58: 127-136.
- Zar JK (1984) Biostatistical analysis. Science, p: 94.
- Welburn AR, Lichtenthaler H (1984) In advances in photosynthesis research, (ed.Sybesma) martinus nijhoff, Co. The Hague. II: 9-12.
- Mancinelli AL, Lunguist PHY, Anderson DR, Rabino I (1973) Photocontrol of anthocyanin synthesis, the action of streptomycin on the synthesis of chlorophyll and anthocyanin. Plant Physiol 55: 251-257.
- Jayaraman J (1981) Laboratory manual in biochemistry, Willey-Eastern Company Limited, Madras, 1-65.
- Lowry OH, Rosenbury NJ, Farr AL, Randall RJ (1951) Protein measurement with folin phenol reagent. J Bio Chem 193: 262-275.
- Bates LS, Waldren RP, Teare ID (1973) Rapid determination of free proline in water-stress studies. Plant and Soil 39: 205-207.
- Jaworski EG (1971) Nitrate reductase assay in intact plant tissues. Biochem Biophy Res Commun 43: 1274-1279.
- Addy SK, Goodman RN (1972) Polyphenol oxidase and peroxidise activity in apple leaves inoculated with a virulent or avirulent strain for Erwinia amylovora. Indian Phytopath 25: 575-579.
- Kar M, Mishra D (1976) Catalase, peroxidise and polyphenol oxidase activities during rice leaf senescence. Plant Physiol 57: 315-319.
- Baker AJM, Grath SP, Sidholi CMD, Reeves RD (1994) The possibility of in situ heavy metal decontamination of polluted soil using crop and metal accumulating plants. Res Conser Recycle 11: 41-49.
- Jayakumar K, Cheruth Abdul Jaleel (2009) Uptake and accumulation of cobalt in plants: A study based on exogenous cobalt in soybean. Botany Research International 2: 310-314.
- Gupta SD, Dubey RS (2011) In reactive oxygen species and antioxidants in higher plants: Metal toxicity, oxidative stress and antioxidative defence system in plants. CRC Press, USA, pp: 177-203.
- Villiers F, Ducruix, C, Hugouvieux, V (2011) Investing the plant response to cadmium exposure by proteomic and metabolomic approaches. Proteomics 11: 1650-1663.
- Xiong ZT, Wang H (2005) Copper toxicity and bioaccumulation in Chinese cabbage (Brassica pekinensis Rupr). Environ Toxicol 20: 4741-4749.
- Qiuli L, Zhou B (2007) Copper and manganese induce yeast apoptosis via different pathways. Mol Biol Cell 18: 4741-4749.
- Kopittke PM, Dart PJ, Menzies NW (2007) Toxic effects of low concentrations of cu on nodulation of cowpea (Vigna unguiculata). Environ Pollut 145: 309-315.
- Blunden G, Jenkins T, Wan LY (1997) Enhanced leaf chlorophyll levels in plants treated with seaweed extracts. J Appl Phycol 8: 535-543.
- Atzmon N, Van staden J (1994) The effect of seaweed concentrate on the growth of Pinus pinea seedlings. New Forest 8: 279-288.
- Sridhar S, Rengasamy R (2010) Effect of seaweed liquid fertilizer on the growth, biochemical constituents and yield of Tagetes erecta under field trial. J Phytol 2: 61-68.
- Thomas TE, Horrison PJ (1987) Rapid ammonium uptake and nitrogen interactions in five intertidal seaweeds grown under field conditions. J Exp Mar Biol Ecol: 1-8.
- Hoque AM, Okuma E, Banu MN, Nakamura Y, Shimoishi Y, et al. (2007) Exogenous proline mitigates the detrimental effects of salt stress more than exogenous betaine by increasing antioxidant enzyme activities. J Plant Physiol 164: 553-561.
- Hemida KA, Ali RM, Ibrahim WM, Makram AS (2014) Ameliorative role of some antioxidant compounds on physiological parameters and antioxidants response of wheat (Triticum aestivum L.) seedlings under salinity stress. Life Sci J 11: 324-342.
- Nounjan P, Nghia T, Theerakulpisut P (2012) Exogenous proline and trehalose promote recovery of rice seedlings from salt-stress and differentially modulate antioxidant enzymes and expression related genes. J Plant Physiol 169: 596-604.
- Schiavona M, Mora I, Pilon-smits EAH, Matozzo V, Malagoli M, et al. (2012) Accumulation of selenium in Ulva sp. and effects on morphology, ultrastructure and antioxidant enzymes and metabolites. Aquat Toxicol 122-123: 222-231.
- Latique S, Chernane H, Mansori M, Kaoua EM (2013) Seaweed liquid fertilizer effect on physiological and biochemical parameters of bean plant (Phaseolus vulgaris var. paulista) under hydroponic system. Eur Sci J 9: 1857-7881.
- Chernanel H, Latique SM, et al. (2015) Salt stress tolerance and antioxidative mechanisms in wheat plants (Triticum durum L.) by seaweed extracts application. IOSR Journal of Agriculture and Veterinary Science 8: 36-44.
- Gharib F, Ibrahim MZ, El-Hameed IM, Salem OM, Zakaria EA (2014) Effects of Sargassum latifolium extracts on growth, oil content and enzymatic activities of rosemary plants under salinity stress. Life Sci J 11: 933-945.
Relevant Topics
- Analytical Biochemistry
- Applied Biochemistry
- Carbohydrate Biochemistry
- Cellular Biochemistry
- Clinical_Biochemistry
- Comparative Biochemistry
- Environmental Biochemistry
- Forensic Biochemistry
- Lipid Biochemistry
- Medical_Biochemistry
- Metabolomics
- Nutritional Biochemistry
- Pesticide Biochemistry
- Process Biochemistry
- Protein_Biochemistry
- Single-Cell Biochemistry
- Soil_Biochemistry
Recommended Journals
- Biosensor Journals
- Cellular Biology Journal
- Journal of Biochemistry and Microbial Toxicology
- Journal of Biochemistry and Cell Biology
- Journal of Biological and Medical Sciences
- Journal of Cell Biology & Immunology
- Journal of Cellular and Molecular Pharmacology
- Journal of Chemical Biology & Therapeutics
- Journal of Phytochemicistry And Biochemistry
Article Tools
Article Usage
- Total views: 5420
- [From(publication date):
December-2016 - Aug 20, 2025] - Breakdown by view type
- HTML page views : 4423
- PDF downloads : 997
