 Spanish
  Chinese
  Russian
  German
  French
  Japanese
  Portuguese
  Hindi
Hindi Our Group organises 3000+ Global Conferenceseries Events every year across USA, Europe & Asia with support from 1000 more scientific Societies and Publishes 700+ Open Access Journals which contains over 50000 eminent personalities, reputed scientists as editorial board members.
Open Access Journals gaining more Readers and Citations
700 Journals and 15,000,000 Readers Each Journal is getting 25,000+ Readers
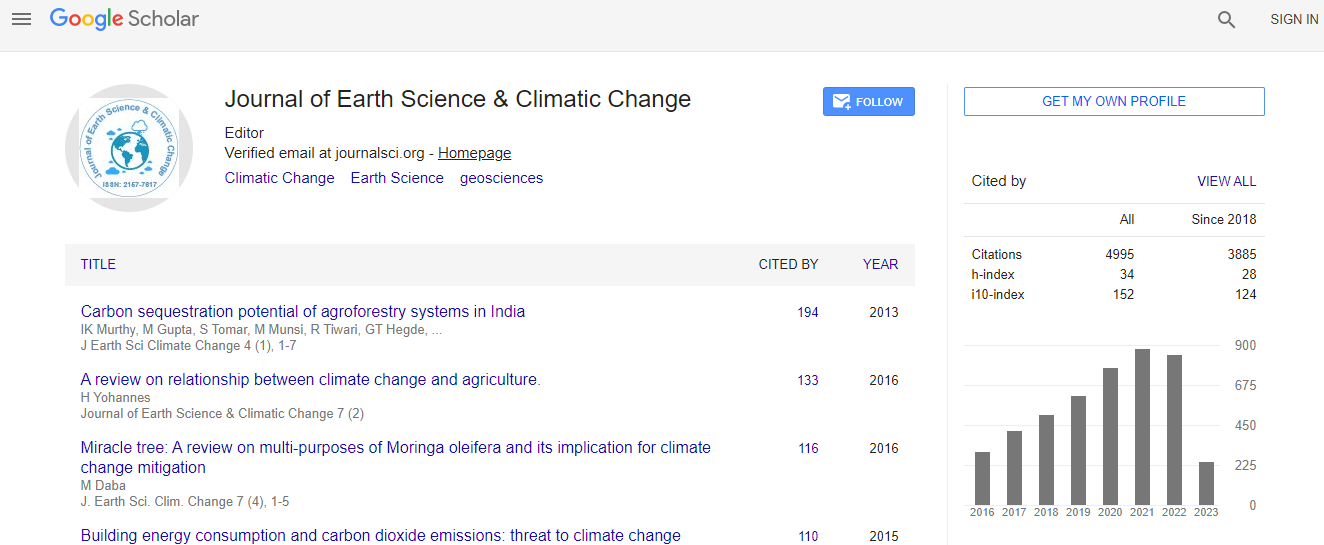
Google Scholar citation report
Citations : 5125
Journal of Earth Science & Climatic Change received 5125 citations as per Google Scholar report
Journal of Earth Science & Climatic Change peer review process verified at publons

Indexed In
- CAS Source Index (CASSI)
- Index Copernicus
- Google Scholar
- Sherpa Romeo
- Online Access to Research in the Environment (OARE)
- Open J Gate
- Genamics JournalSeek
- JournalTOCs
- Ulrich's Periodicals Directory
- Access to Global Online Research in Agriculture (AGORA)
- Centre for Agriculture and Biosciences International (CABI)
- RefSeek
- Hamdard University
- EBSCO A-Z
- OCLC- WorldCat
- Proquest Summons
- SWB online catalog
- Publons
- Euro Pub
- ICMJE
Useful Links
Recommended Journals
Related Subjects
Share This Page
In Association with

Patterns of daily average US temperatures over the period 1975-2016
4th World Congress on Climate Change and Global Warming
Suree Chooprateep and Weerinrada Wongrin
Chiang Mai University, Thailand
ScientificTracks Abstracts: J Earth Sci Clim Change
Abstract
In this study, various statistical methods were used to analyze models of climatic variations of air surface temperatures in daily average temperatures in the USA from 1975 to 2016. Average daily temperature data was obtained from the US National Oceanic and Atmospheric Administration (NOAA). The temperatures collected from 115 stations in USA, over a period of 42 years were analyzed to account the temperature variability. Temperature data recorded on the leap years were omitted in order to maintain equal observations for each year. To reduce the serial correlation between daily temperatures for each station, the 5-day average temperature was compute and used in this study. For each station, the first model was fit for year and 5-day average temperatures and the fitted models were displayed as the seasonal patterns. Next, factor analysis was applied to account for spatial correlations and also to consolidate all stations into five regions, specifically West, North East, East, South and South West regions. The classification from factor analysis can be explained 66.6% of the total variance. For each region, the second model was fit for year and month variables and this model contains the year and month effects only. For five regions, the average temperature in each month of year and annual temperature were estimated with 95% confidence interval. The temperature patterns for all regions can be showed in the same graph. For each month of year the estimated minimum temperatures in January were different among the regions. The temperature increased sharply from February to July, then decreased from August to December. For the annual trend, the highest temperature was in the south region and the lowest temperature was in the northeast region.Biography
Suree Chooprateep has her expertise in Applied Statistics. She has experience in research and teaching applied statistics, time series analysis, statistical methods and statistical analysis of data at the Department of Statistics, Chiang Mai University, Thailand. Her most recent research involves modeling of temperatures, such as temperatures in Southeast Asia, sea surface temperatures of the North Atlantic Ocean and solar absorption by clouds in Australia. She continues to do research related to modeling of temperatures in the United States and rainfall patterns in Thailand.
E-mail: suree.choo@gmail.com