Research Article Open Access
The Effect of the Posterior Loading on the Spine of a School Child
Samir Zahaf1*, Bensamine Mansouri1, Abderrahmane Belarbi1 and Zitouni Azari21Department of Mechanical Engineering, University of Sciences and Technology, Oran, Algeria
2Laboratory of Biomechanics, Polymers and Structures, ENIM-Metz, France
- Corresponding Author:
- Samir Zahaf
Department of Mechanical Engineering
University of Sciences and Technology, Oran, Algeria
Tel: +213 (041)-56 03 27
E-mail: zahafsamir1983@gmail.com
Received Date: July 27, 2016; Accepted Date: August 18, 2016; Published Date: August 26, 2016
Citation: Zahaf S, Mansouri B, Belarbi A, Azari Z (2016) The Effect of the Posterior Loading on the Spine of a School Child. Adv Cancer Prev 1:112. doi:10.4172/2472-0429.1000112
Copyright: © 2016 Zahaf S, et al. This is an open-access article distributed under the terms of the Creative Commons Attribution License, which permits unrestricted use, distribution, and reproduction in any medium, provided the original author and source are credited.
Visit for more related articles at Advances in Cancer Prevention
Abstract
The objective of this work is to study the effect of the backpack on the components of the spine system of a child school, know the effect of an eccentric force on the intervertebral discs, the creating a 3D model of the spine of a child of 38 kg overall weight under the effect of three eccentric load (P2, P3, P4) plus P1 compression load and calculated by the element method ends, For the boundary conditions we fixed the sacrum (Embedding the sacrum). We propose in this section to draw up a comprehensive study of the distributions of stresses and normal elastic strain of Von Mises in the intervertebral discs based on loads supported. The results show that the stress and strain of Von Mises are highest and concentrated in four intervertebral discs (D1, D2, D3 and D4), which causes a problem that calls (herniated disc). We concluded that the cause of the posterior load, a 300 mm lever arm with a 150 N force present maximum Von Mises stresses concentrated in four intervertebral discs (D1, D2, D3, D4), which justifies the distance between the load which is the point of application of the load and the axis of the spine plays a very important role in increasing the solicitation of the latter.
Keywords
Child; Herniated discs; Lumbar-thoracic; Intervertebral discs; Finite element; Biomechanics; Von Mises stress-strain; Disc degeneration
Introduction
Biomechanics is an important part of biology. Since 1978 there has been an enormous increase in scientific contributions from physicians and engineers. Recent basic study had been developed in many experiments and numerical analysis. In the last decade, more papers have been published in this area than ever before10 years old [1].
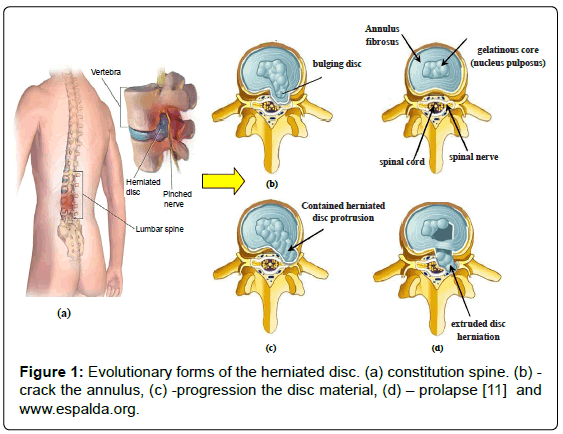
Lumbar disc herniation is defined as a more or less projection of the disc material (Figure 1) through a dehiscence of the fibrous ring, especially sitting at L4L5 or L5S1 [2]. Several terms have been used for designating this affection, especially by varying the degree of outsourcing the nucleus [3]. For a degenerated disc in flexioncompression, hernia corresponds to a migration (protrusion) posterior and especially posterolateral of the nucleus pulposus, pulling on the fibers of the anulus or bursting them, which extends towards the channel final spinal. The nucleus may outsource completely covered by the remaining ligament of the posterior annulus (prolapse appointed position) or may exceed this ligament and to project into the channel, becoming a “sequestered disc fragment.” In all these situations the nervous structures can be compressed, generating low back pain or radiculalgia and important functional limitations [4]. The etiological factors are many: disc degeneration related to age, acute trauma, minor trauma but repeated [5-7], structural deficiencies of the annulus [8,9], biochemical factors or genetic, responsible for hereditary predisposition for herniated discs adult or juvenile Simmons’96; Matsui’98. More rarely, a rigid fusion can cause a hernia at adjacent [10].
Figure 1: Evolutionary forms of the herniated disc. (a) constitution spine. (b) - crack the annulus, (c) -progression the disc material, (d) – prolapse [11] and www.espalda.org.
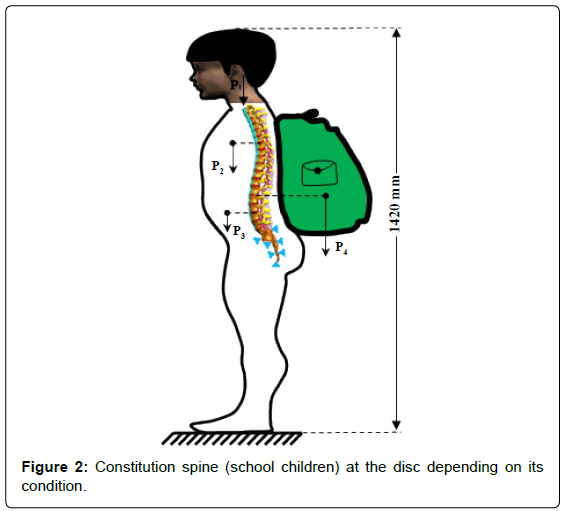
Wearing a backpack too heavy (Figure 2) is certainly an aggravating factor and can cause long-term pain in the neck and shoulder, upper and lower back, pressure on the hips and knees and deformities of the spine, in biomechanics weight of the backpack is an eccentric posterior load applied to the lumbosacral spine, the weight should not exceed 10% of the weight of the child. It is between 8 and 15 years since the child’s back is the most fragile, and scientific studies have demonstrated imaging (MRI) the risk of joint damage and intervertebral disc are real.
The diagram Figure 2 represents a school child to age 10 years of overall specific weight 38 kg to wear a backpack, backpack is the mass of 15 kg representing the weight P4.
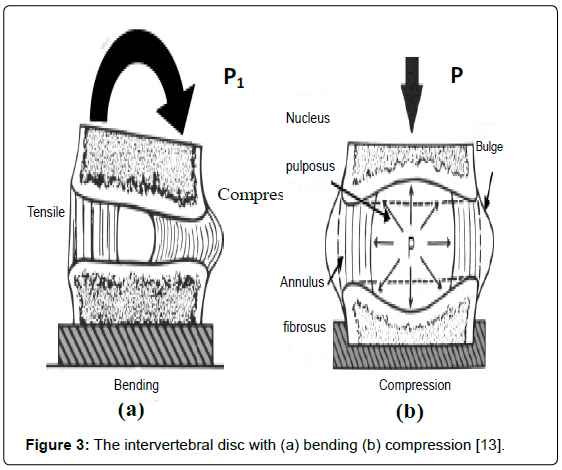
The MRI study [11,12], alerts of this overweight effect in the development of degenerative disc disease, back pain and then herniated disc (Figure 3). In this work, the simulation of the disc degeneration, based on a finite element model of the spine depending on the mechanical properties were established; the boundary condition has been applied in the frontal plane to define restriction on movements of translation and rotation of the spine.
We propose in this work to draw up a comprehensive study of stresses and deformations in the spinal discs distributions based on supported loads. The results show that the level of degeneration increased in all intervertebral discs but concentrated in the four disks D1, D2, D3 and D4.
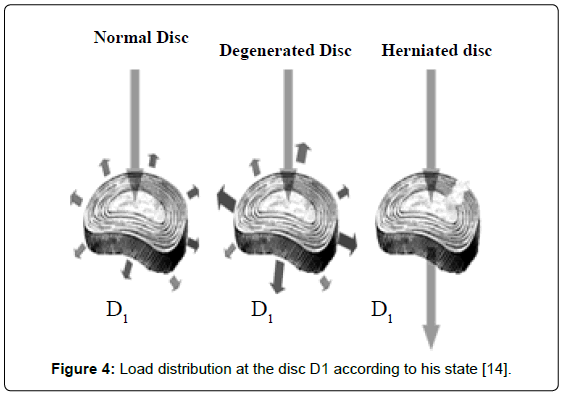
Figure 3 shows two vertebrae of the spinal column with an intervertebral disc under the effect of a compound loading (compression P1+bending moment P4). The compressive load P1 creates an internal pressure in the nucleus, this pressure will there after generate the disc degeneration or degenerative disc disease (Figure 4) as regards the forward flexion P4, if the load of the schoolbag increases, automatically distance between the point of load application and the axis of the spinal column increases, we see that the posterior portion of the annulus fibrosis is compressed and the other front portion is tensioned, that is to say the nucleus pulpous burst back (posterior compression), this compression produced by disc protrusion comes into contact with a nerve root called herniated disc.
Material and Methods
The objective of this study was to investigate the effects induced by an eccentric load of the backpack on the back of a child, know the effect of an eccentric load on the intervertebral discs, created a 3D model of spine, the total mass of child is 38 kg under the effect of three eccentric loads (p2, p3, p4) plus a p1 compression load and calculated by the finit element method, the boundary conditions we fixed the sacrum (incorporation of the sacrum).
The analysis of biomechanical problems includes several steps.
The first is to study the form to define the geometrical configuration of the object, which allows the reconstitution of the vertebra, the ligament and bone using CAD programs.
The result is a 3D geometric model including these three components will then be prepared for use in finite element analyzes for the study of stresses and deformations distribution in the system.
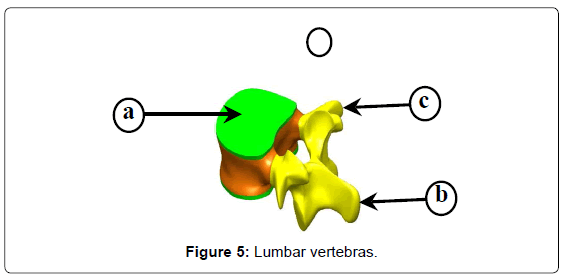
The steps for the execution of the 3D vertebra model (Figure 5) are as follow:
a) Draw cortical bone that is the upper hinge and the lower hinge, then make the smoothing process; this gives a solid body called the vertebral body.
b) Secondly, draw the posterior arch (blade with the pedicle) with the spinous process.
c) Finally we draw the transverse process.
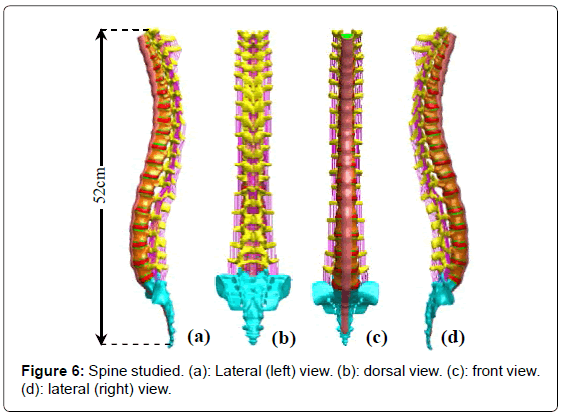
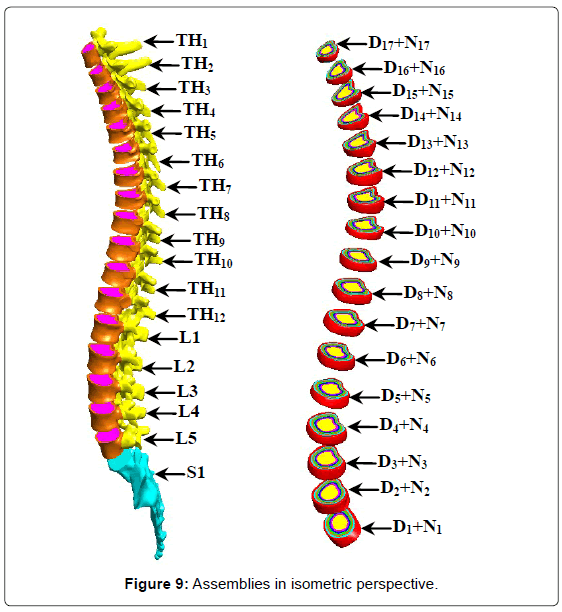
The simulation of the disc degeneration is based on a finite element model of the healthy spine. Figure 6 shows a spine model, this consists of five lumbar vertebrae (L1, L2, L3, L4 and L5) plus the sacrum, twelve thoracic vertebrae (TH1, TH2, TH3, TH4, TH5, TH6, TH7, TH8, TH9, TH10, TH11, TH12) and 17 inter vertebral discs between (S1-L5, L5- L4, L4-L3, L3-L2, L2-L1, L1-TH12 TH12-TH11, TH11, TH10, TH10- TH9, TH9-TH8, TH8-TH7, TH7-TH6, TH6-TH5, TH5-TH4, TH3- TH4, TH3-TH2 TH2-TH1) and various ligaments thoracic lumbar spine (anterior longitudinal ligament, posterior longitudinal ligament, ligament interspinous, ligament supraspinatus, yellow ligament and capsular ligament).
In static loading conditions, the model of the reconstructed spine is used in an analysis for studying the role of the inter vertebral discs and the stress distribution in these disks as well as its supporting structures.
The spine is reconstructed in 3D to study the system dimensions (IVD - ligament-bone) (Figure 7).
In order to define the boundary conditions, restriction on movements of translation and rotation of the spine has been applied in the lower plane, and defined as having zero displacements. Several charges in the anterior direction were applied as follows:
• The application of the load on the upper side of the thoracic vertebra TH1.
• The fixed part applied to the body of the sacrum.
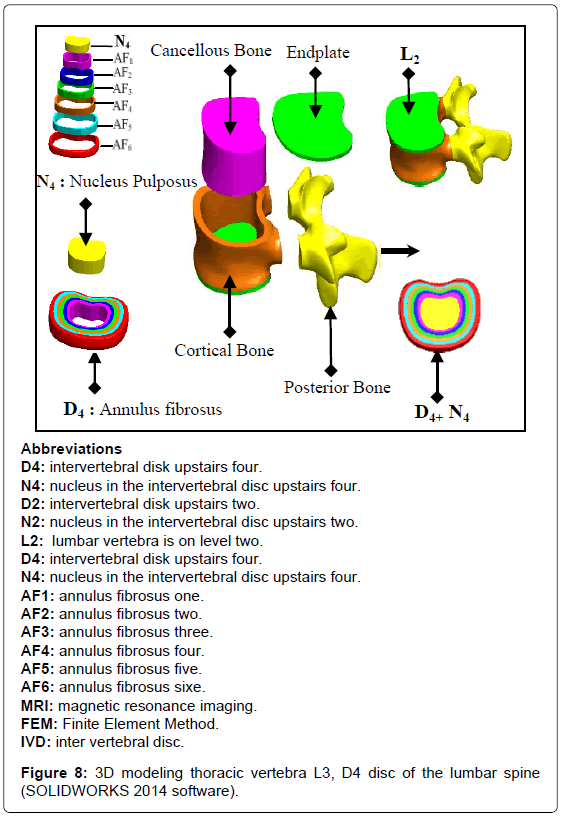
• The interfaces between the different components of the system of the spine, the cortical bone, the inter vertebral disk and ligament are treated as perfectly bonded interfaces (Figures 7 and 8).
Figure 9 shows an isometric view of an explored assembly of the spine and each component of the spine system is denoted by letters.
The selection of constitutive equations of the vertebral bone is defined as the part of the bone which carries the inter vertebral disc, composed of cortical bone, cancellous bone, the posterior arch, with a Young’s modulus of about 12000 MPa. It is well known that cortical bone has better load capacity than the cancellous bone. Cortical bone is considered as an isotropic material, and homogeneous linear elastic (Table 1).
| Authors | σr(MPa) |
|---|---|
| BROWN (axial direction) | 1.4 |
| GALANTE (horizontal direction) | 3.5 ± 0.3 |
| GALANTE (fiber direction) | 10.7 ± 0.9 |
| WU | 3.7 |
Table 1: Mechanical characteristics of disc tissue [15].
Table 1 shows the tensile strength of the structure annulus fibrosis according to different authors. These materials are anisotropic and non-linear elastic.
The behavior of inter-transverse ligament and inter-spinous ligament is nonlinear viscoelastic as in previous studies [13-16]; a linear elastic model is chosen to represent this behavior.
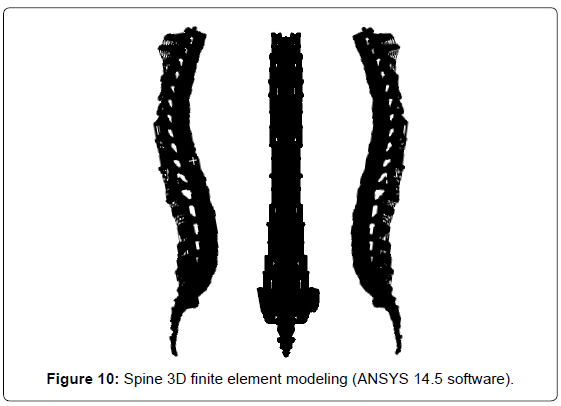
ANSYS WORKBENCH software was used for analyzing this geometry and generates the most suitable mesh. For the studied behavior, we used tetrahedral elements, type Solid187 conforming to defined parametric surfaces interfaces (Figure 10).
It is necessary to mesh the components of the spine with small and confused elements to ensure optimum accuracy of the results of stresses and strains in the inter vertebral discs.
The material properties of the spine components were selected after a careful review of the published literature (Table 2); it was considered appropriate to define the cortical and cancellous bone as homogeneous and isotropic. The magnitudes of 12000 MPa and 100 MPa (cortical and cancellous, respectively) were observed in all studies by various researchers.
| Material | Young modulus (MPa) | Poisson coefficient | References |
|---|---|---|---|
| Cortical Bone | 12000 | 0.3 | [17,19-28,33,42,44,45-47,49,50] |
| CancellousBone | 100 | 0.2 | [17,19-28,33,42,44,45-47,49,50] |
| PosteriorBone | 3500 | 0.25 | [19,20,21,24,25,27,28,30,33,34,43-46] |
| Cartilage Endplates | 12000 | 0.3 | [27,29,31,35] |
| AnnulusGround Substance | 4.2 | 0.45 | [17,20,23,25-29,31,33,37,38,41-46,49,50] |
| Nucleus Pulposus | 1 | 0.499 | [18,20-24,26,27,33,36,39,40-45,49,50] |
| Anterior Longitudinal Ligament | 20 | 0.3 | [20,21,23-25,43,44,47,48] |
| Posterior Longitudinal Ligament | 20 | 0.3 | [20,21,23,24,43,44,47,48] |
| LigamentumFlavum | 19.5 | 0.3 | [20,21,23,24,43,44,47,48] |
| Intertransverse Ligament | 58.7 | 0.3 | [20,21,23,24,43,44,47,48] |
| Inter-Spinous Ligament | 11.6 | 0.3 | [20,21,23,24,43,44,47,48] |
| Supra-Spinous Ligament | 15 | 0.3 | [20,21,23,24,43,44,47,48] |
| Capsular Ligament | 32.9 | 0.3 | [20,21,23,24,43,44,47,48] |
Table 2: Material Properties Specified in the Model.
Since physiologically the nucleus is fluid filled, the elements were assigned low stiffness values (1 MPa) and near incompressibility properties (Poisson’s ratio of 0.499). Biologically, the annulus fibrosus is comprised of layers of collagen fibers, which attributes to its nonhomogenous characteristics. However, due to limitations in modeling abilities, the annulus was defined as a homogenous structure with a magnitude of 4.2 MPa.
This was based on the modulus of the ground substance (4.2 MPa) and the collagen fibers reported in the literature, taking into account the volume fraction of each component. The complete model of the spine (Figure 10) was realized by the SOLIDWORKS SOFTWARE VERSION 2014 and was then transferred to the software Calculates each element ends ANSYS 14.5 WORKBENCHE generated the default mesh then generated linear global custom mesh tetrahedra 10 nodes conform to surface.
The three views of spine model with condensed mesh are shown in Figure 10. All element and node numbers are specified in Table 3.
| Component | Nodes | Elements | Thickness |
|---|---|---|---|
| Cortical Bone | 724644 | 471775 | 1mm |
| Cancellous Bone | 454799 | 2377296 | 1mm |
| Posterior Bone | 3E+06 | 2377091 | 1mm |
| Cartilage endplates | 395500 | 234465 | 1mm |
| AnnulusGround Substance | 502860 | 244392 | 1mm |
| Nucleus Pulposus | 97864 | 63524 | 1mm |
| Anterior Longitudinal Ligament | 127791 | 74925 | 1mm |
| Posterior Longitudinal Ligament | 37241 | 19574 | 1mm |
| LigamentumFlavum | 30226 | 13447 | 1mm |
| Transverse Ligament | 285328 | 131648 | 1mm |
| Inter-Spinous Ligament | 28968 | 13158 | 1mm |
| Supra-Spinous Ligament | 17833 | 8279 | 1mm |
| Capsular ligament | 51816 | 24072 | 1mm |
| TOTAL | 6E+06 | 6053646 | 1mm |
Table 3: Element and node numbers in the column vertebral system components.
Figure 10 shows a complete model that consists of 6053646 elements and 6196007 nodes. Cortical bone contains (471775 elements and 724644 nodes), cancellous bone contains (2377296 elements 454799 nodes).
The posterior arch was modeled with tetrahedral elements to 10 nodes contains (2377091 elements, 3441137 nodes), the nucleus pulposus in the annulus fibrosus were modeled with tetrahedral type elements 10 nodes (63524 element 97864 nodes), the annulus fibrosus were modeled with elements of type tetrahedral to 10 nodes (244392 elements, 502860 nodes). The gelatinous cartilage modeled with a tetrahedral element to 10 nodes (234465 elements, 395500 nodes) [20-40].
Finally, the different types of ligaments generated by a tetrahedral mesh to 10 nodes (Table 3).
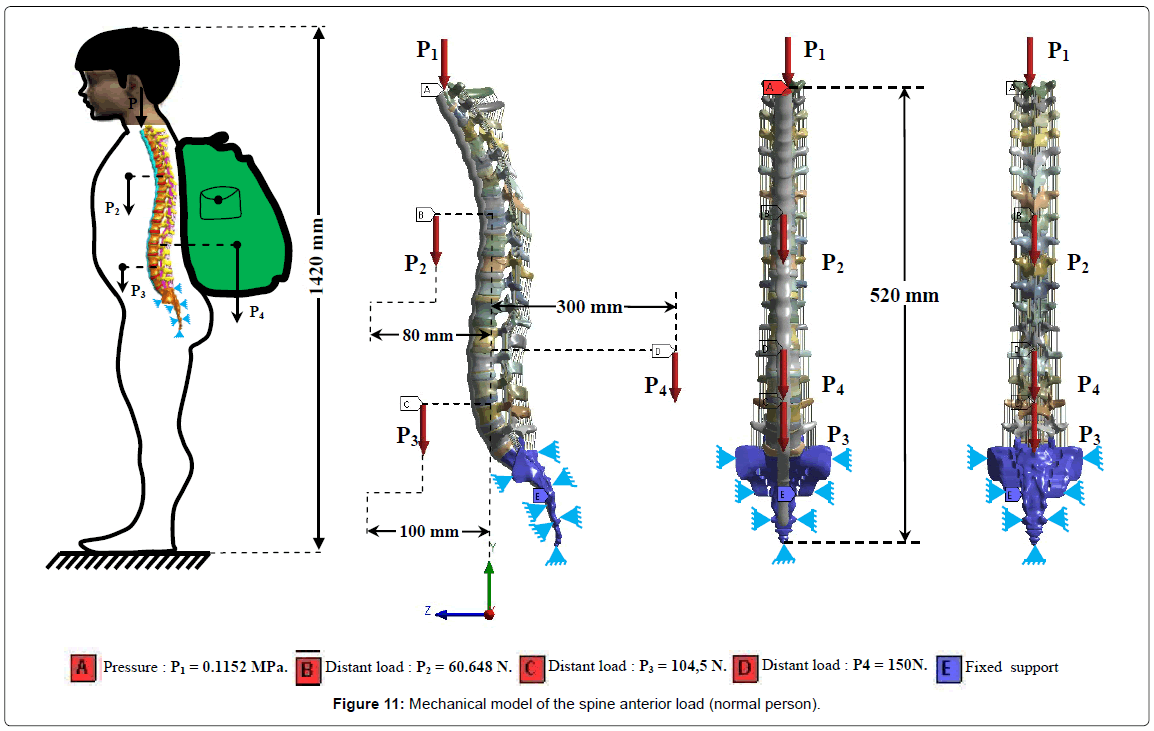
The diagram in Figure 11 represents a school child standing of 38 kg overall density, total mass (Head, Neck, Arm (left + right) Forearm (left + right) hand (left + right) is 6.9572 kg deviser by the upper surface of TH1 thoracic vertebra showing the pressure P1, P2 charge represents the mass of the body superior Trunk is 6.0648 kg, the distance between the load P2 is the point of application of the load and the axis (yy ‘) is 80 mm (Figure 11) [40-53].
The total mass of the lower trunk of the human body equals 10.45 kg represented by P3, the distance between the point of application of the load P3 and the axis (yy ‘) is 100 mm mm (Figure 11).
P4 load is the maximum weight of the backpack worn by the child (15 kg), the distance between the P4 specific weight that is the point of application of the load and the axis of the spine (300 mm) mm (Figure 11).
For the boundary conditions we fixed the sacrum (Embedding the sacrum) mm (Figure 11).
We propose in this section to draw up a comprehensive study of the distributions of the normal stresses of Von Mises and normal elastic strain of Von Mises in the intervertebral discs as a function of supported loads. Distributions of global stress state for each component of our model were presented in the posterior loading effect.
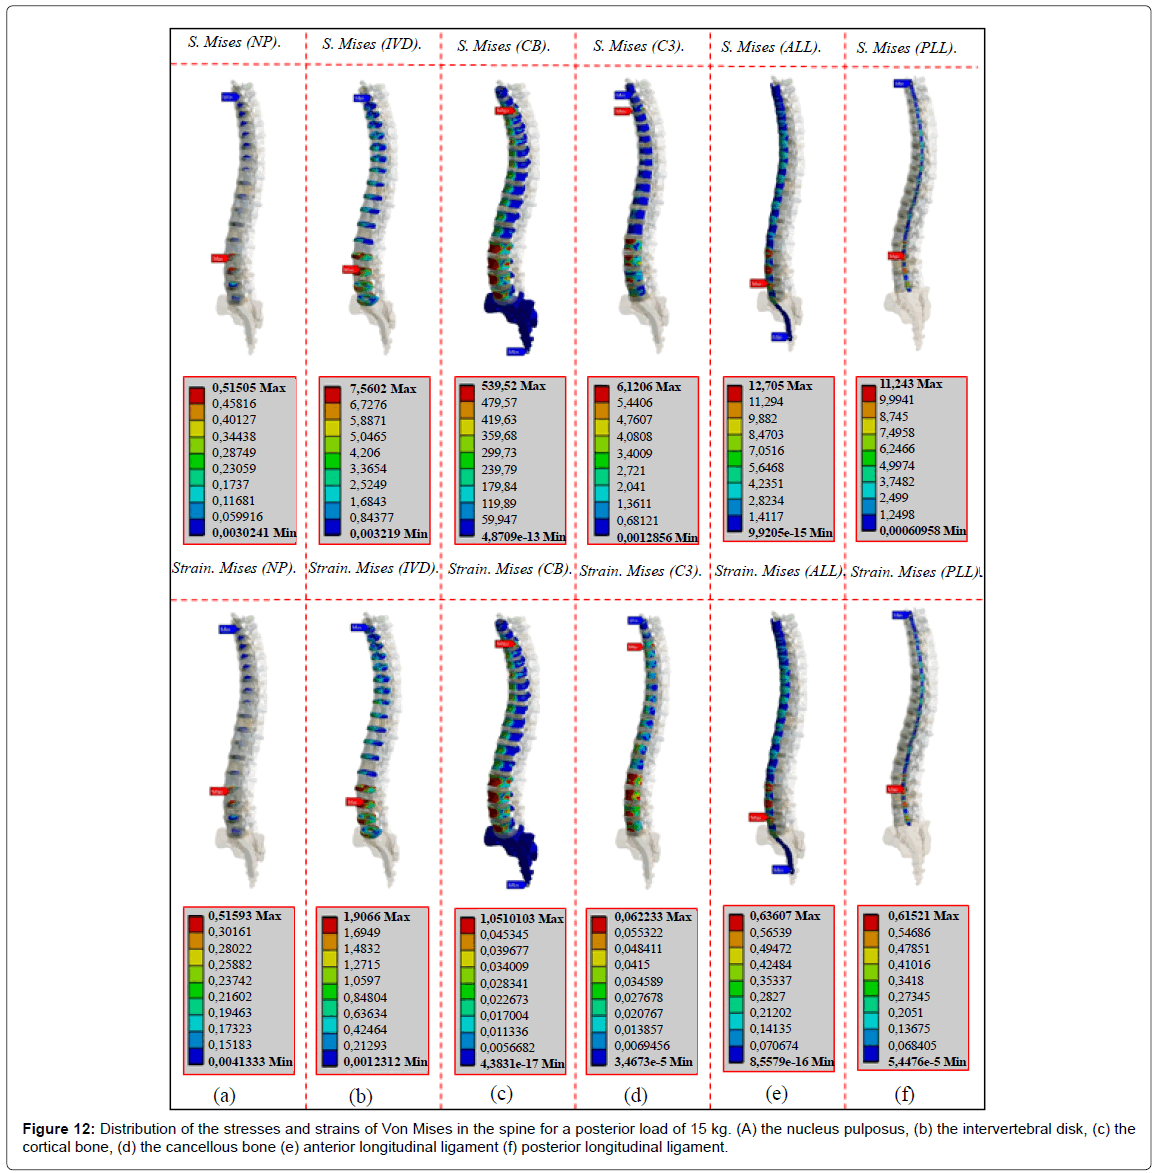
A quantitative analysis was performed based on a scale of progressive visual colors predefined by the software used (ANSYS Workbench 14.5), ranging from dark blue to red.
Results
We see in Figure 12 the stress distribution and strains Von Mises put in the components of the spine, we find that the posterior loading can cause long-term back pain and deformity of the spine. Figure 12 show a maximum value stress of Von Mises concentrated in the fourth intervertebral disk which are equal to 0.5150 MPa for the nucleus pulposus N4, 7.5682 MPa to the annulus fibrosis D4 and 539.52 MPa in the cortical bone of the vertebra thoracic TH3, 6.1206 MPa in the cancellous bone. A posterior loading shows that the distribution of the maximum Von stresses in the ligaments (anterior, posterior) concentrated at the back and equal to 12.705 MPa, 11.243 MPa (red part) (Figure 12). Regarding the strains of von Mises, we notice that the values are at a maximum in the fourth intervertebral disc which is equal to 0.5159 mm/mm for the nucleus N4, 1.9066 mm/mm for the annulus fibrosus D4 compared by the other discs of the spine (red part) (Figure 12). The posterior loading of 15 kg to the back indicated that the maximum strain of von Mises concentrated in the components of the thoracic vertebra TH3, 0.051013 mm/mm for cortical bone, and 0.06223 mm/mm for cancellous bone this mentioned in the Figure 12. We notice in Figure 12 that maximum strains legends of Von Mises in the two ligaments (LLA, LLP) are equal to 0.63607 mm/mm, 0.61521 mm/mm (red part).
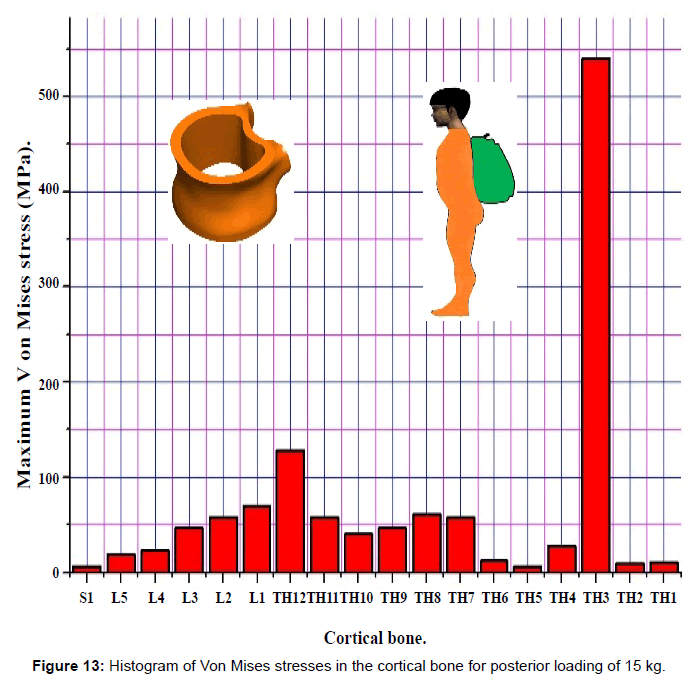
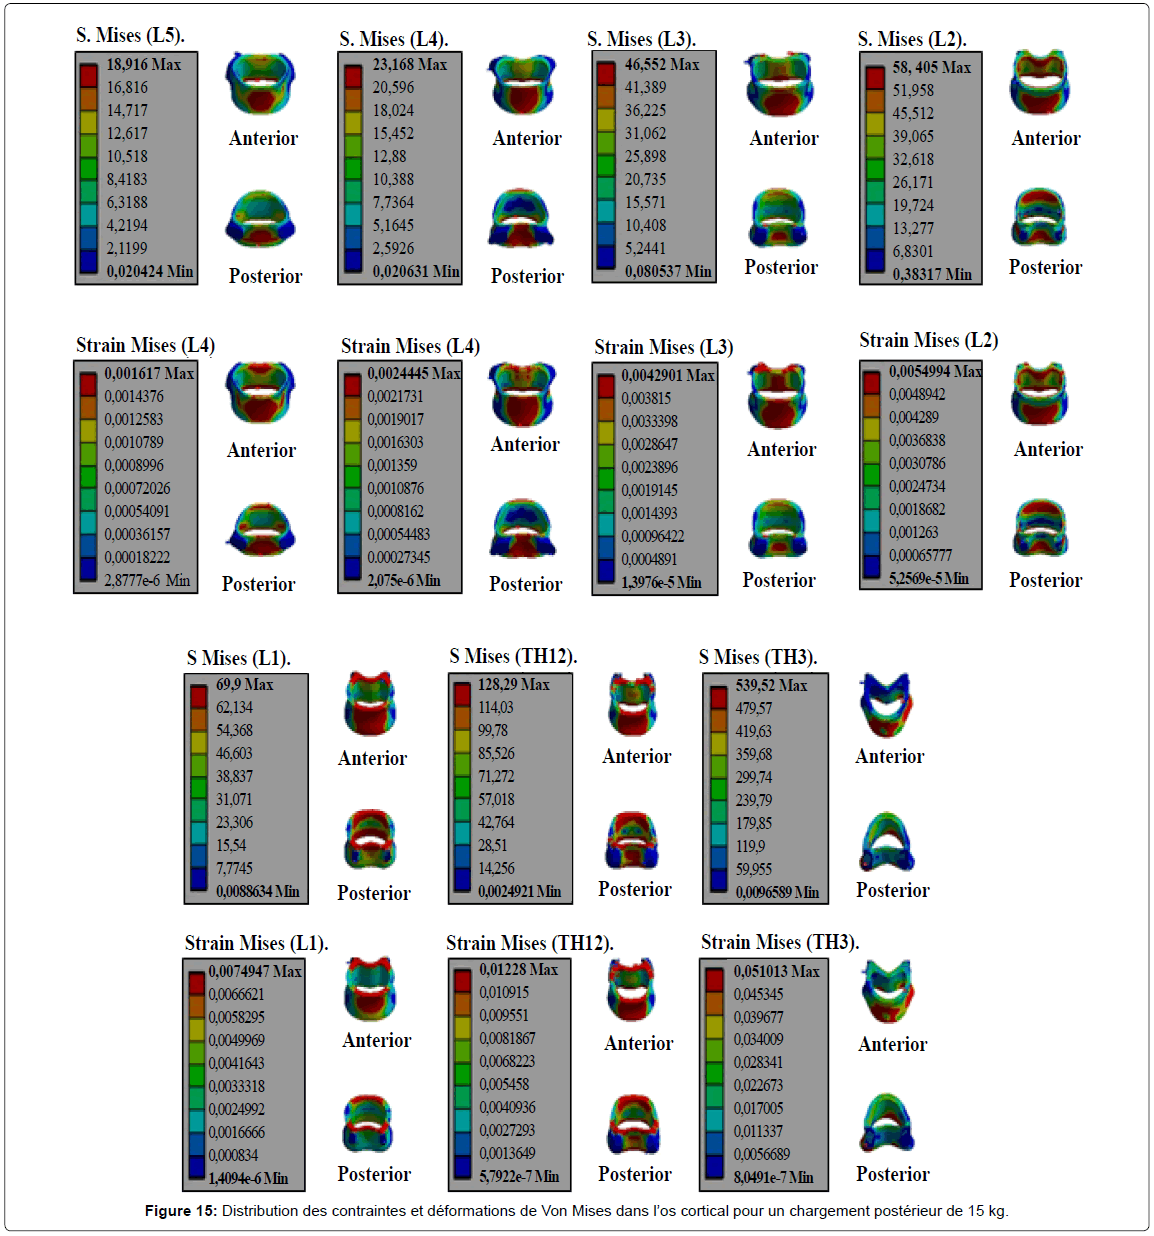
Figure 13 shows a histogram of the Von Mises stress put in the cortical bone, for a posterior load 15 kg, we find that the stress value concentrated in the six lumbar vertebrae L5, L4, L3, L2, L1, TH12, which are equal to 18,916 MPa, 23 168 MPa 46 552 MPa 58 405 MPa, 69.90 MPa, 128.29 MPa this mentioned in figure regarding that the stress of Von Mises will decrease from value of the cortical bone vertebra TH12 and increased up to 539.52 MPa which lie in the anterior and posterior part of the cortical bone TH3 (red part) (Figure 13).
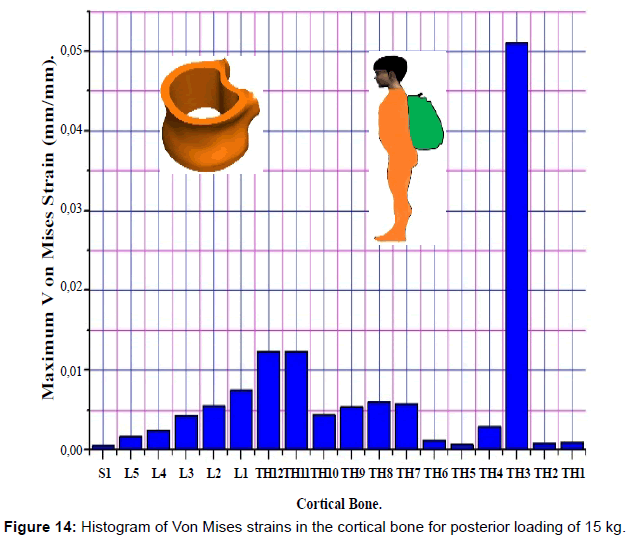
Figure 14 shows a histogram of von Mises strain in the cortical bone reached a maximum value concentrated in six vertebrae L5, L4, L3, L2, L1, TH12, which are equal to 0.001617 mm/mm 0.0024 mm/ mm 0.0042 mm/mm 0.0054 mm/mm 0.0074 mm/mm 0.01228 mm/ mm, this mentioned in Figure 15 follows regarding the strains of von mises will decrease from the value of cortical bone of the vertebra TH11 and increased up to 0.05110 mm/mm which lie in the anterior and posterior part of the cortical bone TH3 (red part) (Figure 15).
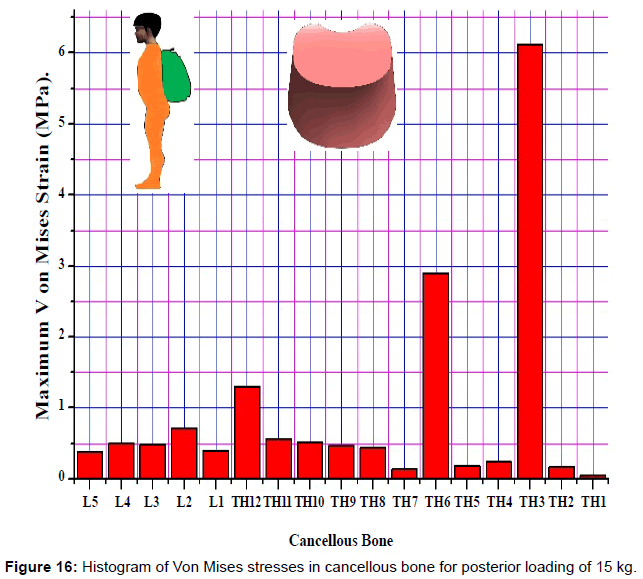
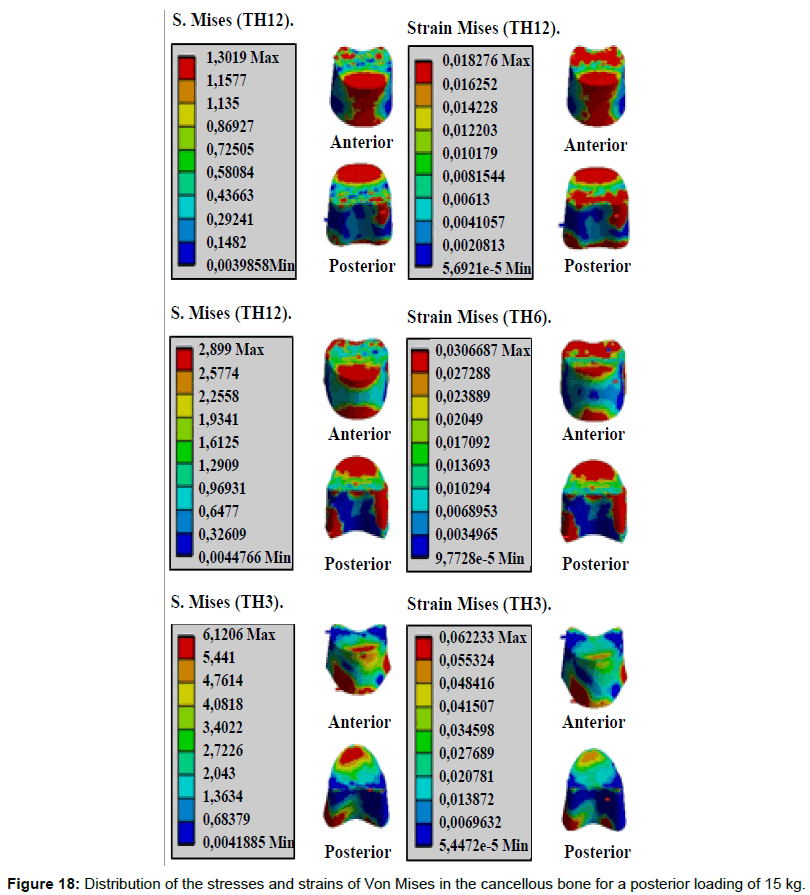
We see in Figure 16 the Von Mises stresses a maximum value concentrated in three cancellous bone TH12, TH6, TH3 are equal to 1.3019 MPa 2.899 MPa, 6.1206 MPa for a lifted load of 15 kg which are located in the anterior and posterior part of the cancellous bone (red area) (Figures 17 and 18).
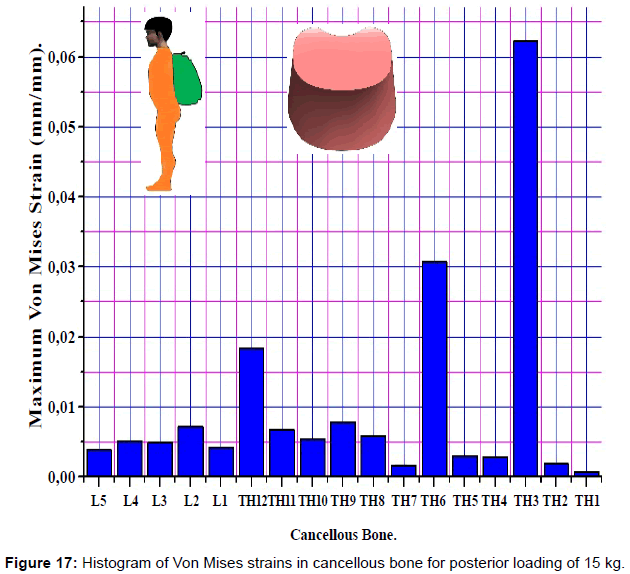
As regards the Von Mises strains (Figure 17) we notice that the values are maximal in the three cancellous bone TH12, TH6, TH3 0.0182 mm / mm, 0.03068 mm / mm 0.06223 mm / mm for a posterior load of 15 kg from the other components of the spine (red part) (Figure 18).
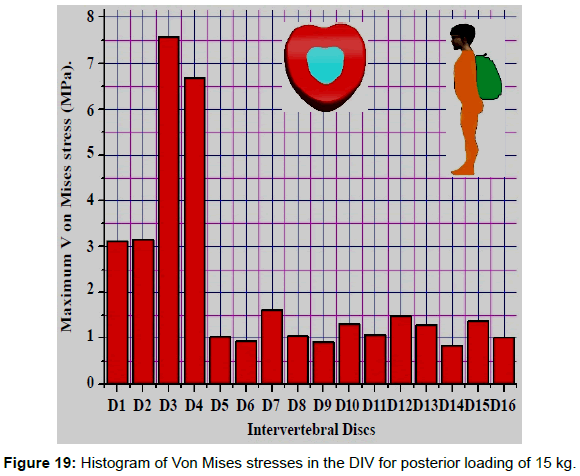
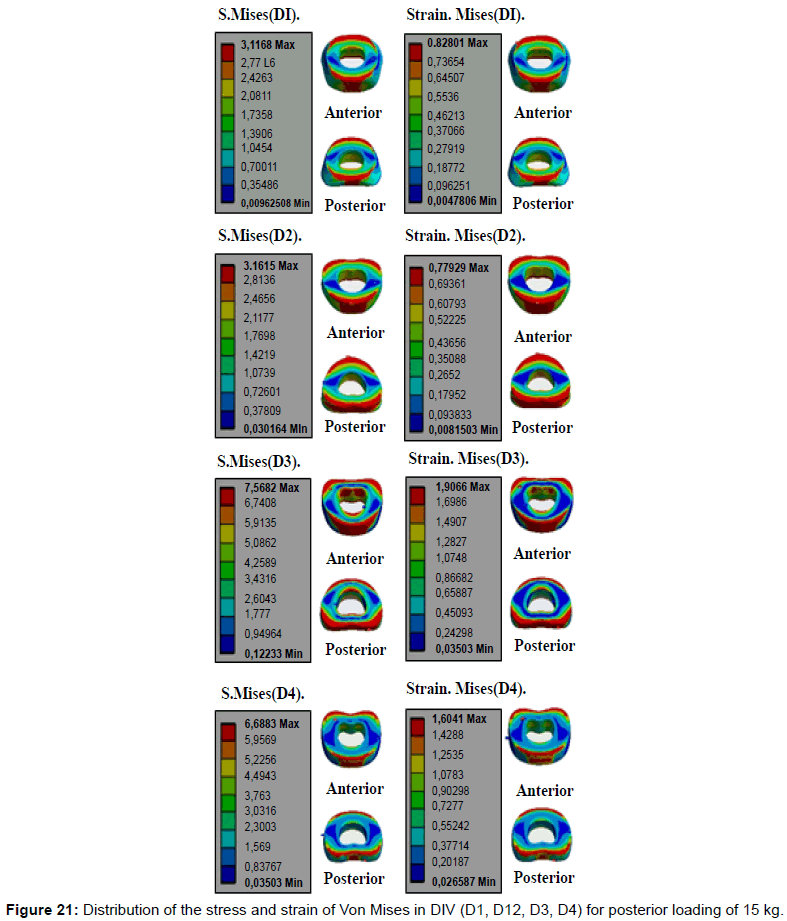
Figure 19 shows, schematically, the increase von Mises stresses in the intervertebral discs. On the one hand before a child carry a school bag 15 kg, 30 cm by the input axis (yy ‘) of the spine (30 cm behind the center of the intervertebral disc calculating the Von Mises stresses in intervertebral discs). We note in Figure 19 that the lifting of the load behind the abdomen the Von Mises stresses increased in the dorsal region that is to say the four intervertebral discs (D1, D2, D3, D4) are the most requested and are equal to (3.1168 MPa, 3.1615 MPa, 7.5682 MPa, 6.6882 MPa) mentioned in Figures 20 and 21.
Figure 19 shows, schematically, the increase von Mises stresses in the intervertebral discs. On the one hand before a school child carry a school bag 15 kg, 30 cm by the input axis (yy ‘) of the spine (30 cm behind the center of the intervertebral disc calculating the Von Mises stresses in intervertebral discs). we note in Figure 19 that the lifting of the load behind the abdomen the Von Mises stresses increased in the dorsal region that is to say the four intervertebral discs (D1, D2, D3, D4) are the most requested and are equal to (3.1168 MPa, 3.1615 MPa, 7.5682 MPa, 6.6882 MPa) mentioned in this Figure 21.
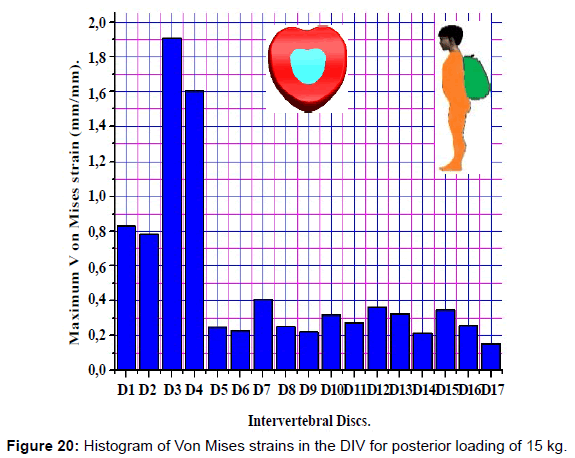
The posterior load (load attached to the back) showing the maximum strain of von Mises concentrated in the four intervertebral discs (D1, D2, D3, D4) which are equal to (0.82801 mm/mm 0.7792 mm/mm 1.9066 mm/mm, 1.6041 mm/mm) this is mentioned in the Figures 20 and 21. We see in Figure 21 Disc degeneration begins, after an asymptomatic phase dehydration of two intervertebral discs (D3, D4) by tearing of the annulus fibrosus (AF6, AF5, AF4, AF3, AF2, AF1). The two core (N3, N4) can then migrate into the thickness of the ring and cause acute or chronic back pain. If it moves more through the ring, the two core (N3, N4) can protrude to the rear side of the disc while forming a HERNIATED DISC. This hernia can migrate into the spinal canal and even exclude leaving the disc. This disc herniation can come compressed or “pinched” to one or more nerve roots in the vicinity of the disc.
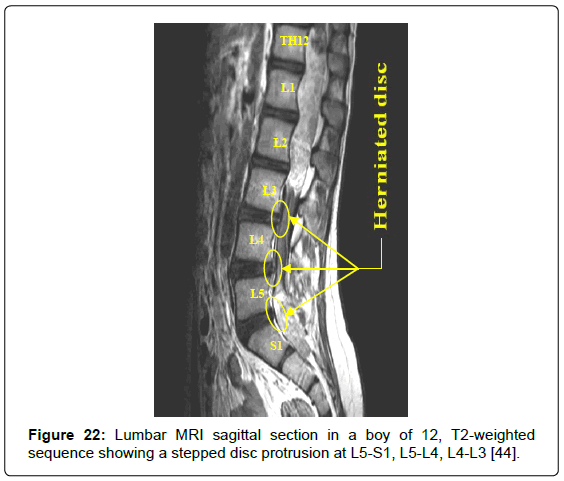
Figure 22 shows MRI of the spine in sagittal section in a boy of 12, we notice a stepped disc protrusion at L5-S1, L5-L4, L4-L3 under the posterior loading effect.
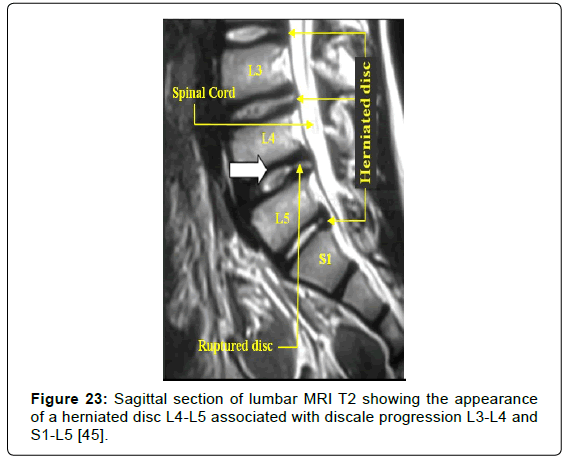
Figure 23 indicate a sagittal section of lumbar MRI, T2 showing the appearance of a herniated disc L4-L5 excluded associated with discale progression L3-L4 and S1--L5 under the posterior loading effect.
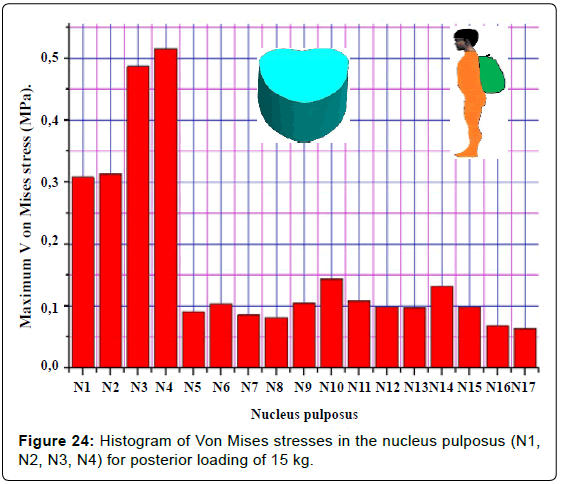
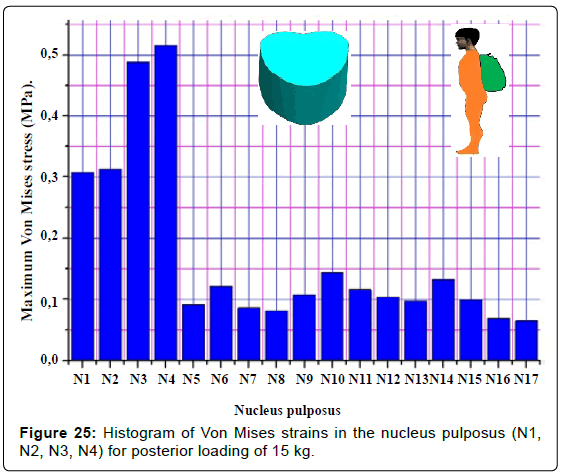
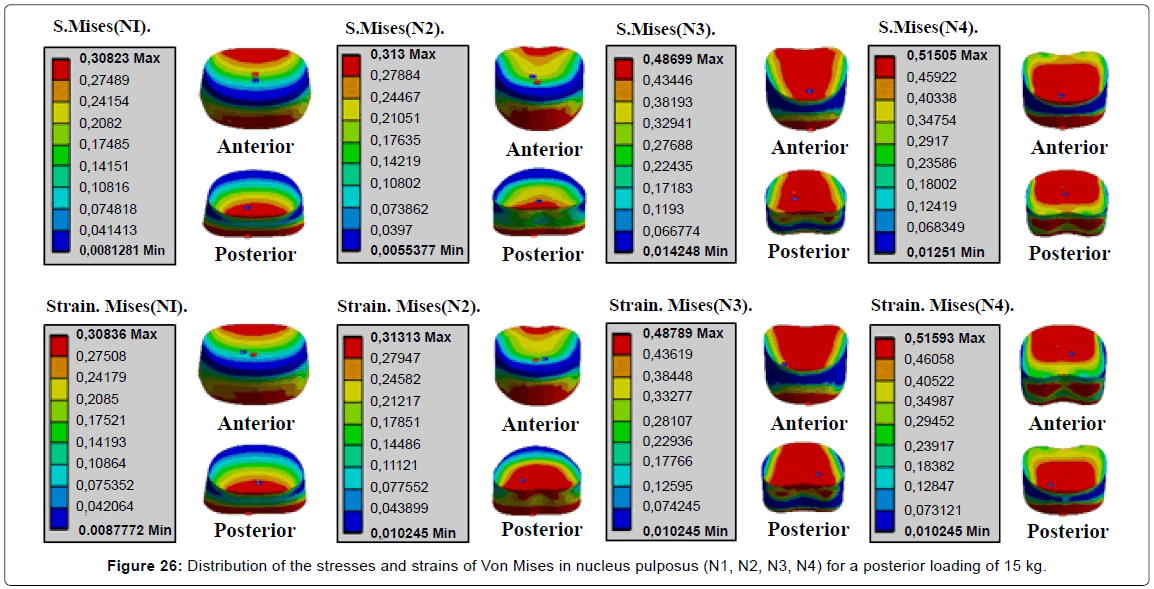
In standing position with a 15 kg load on the back of level we notice that the stress von Mises are maximum in the nucleus pulposus (N1, N2, N3, N4) and are equal to (0.3082 MPa, 0.313 MPa, 0.4869 MPa, 0.5150 MPa) (Figures 24 and 25).
Figure 25 shows the distribution of Von strains supported by the nucleus pulposus (N1, N2, N3, N4) and notes that the strain value is maximum in the two nucleus pulposus (N3, N4) by supplying the other systems of the spine (Figures 24-26).
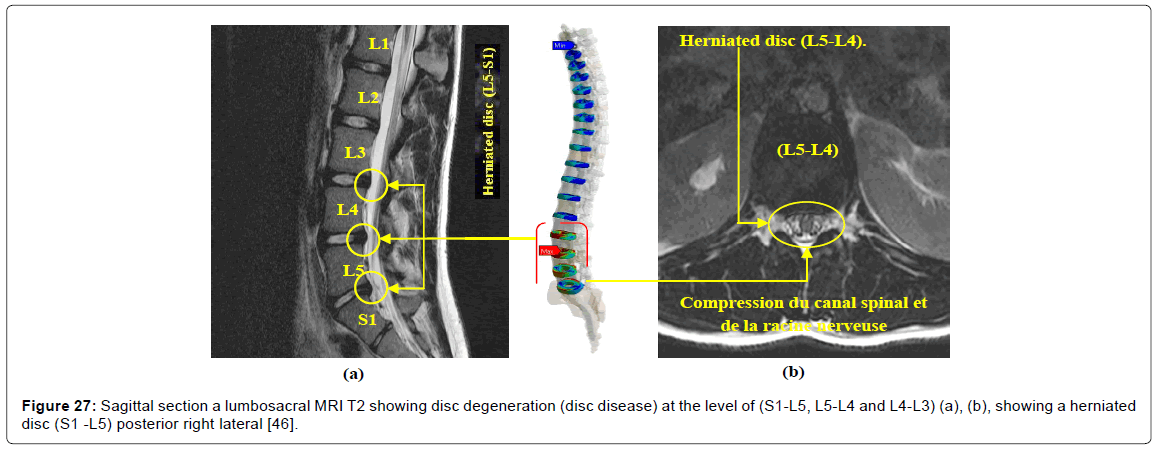
The posterior loading shows suffering on the back level, Figure 27 shows a sagittal section of an MRI lumbosacral T2 showing disc degeneration (discopathy) at (S1-L5, L5-L4 and L4-L3) (a ), (b) disc herniation (S1-L5) posterolateral right follows, we note in Figure 27 that the displacement of the central part of the two intervertebral discs (D1, D2) to the Exterior degenerative disc disease, and a traumatism / or more microtrauma can alter the two intervertebral disks and cause a tearing of the latter.
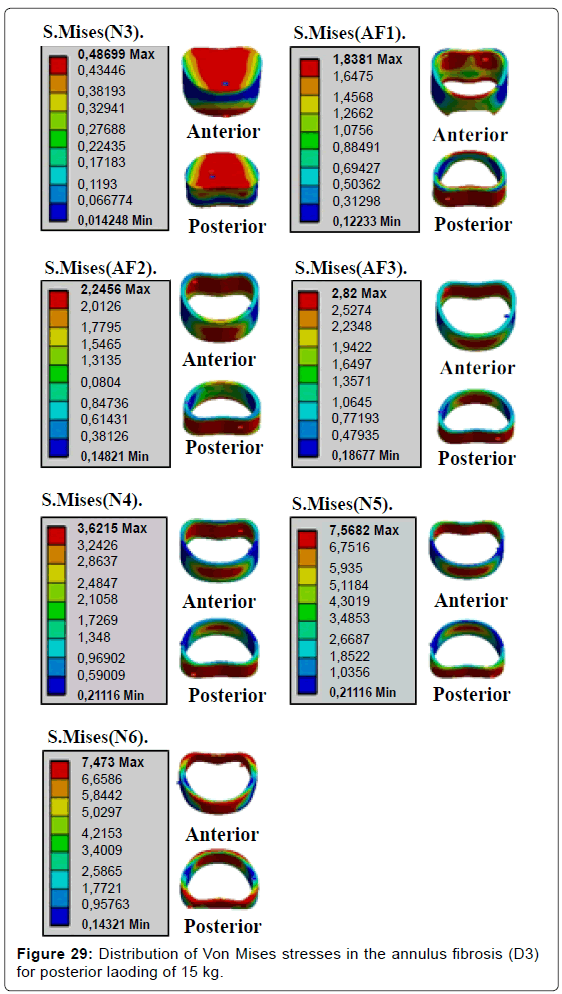
The two cores (N1, N2) moving can come compresses the spinal cord or a nerve root generating symptoms radiculopathy (Figures 27-29) above shows the stress distribution of Von Mises in the intervertebral disk (D3) and we see that disc degeneration starts, after a phase of asymptomatic dehydration, with tears in the annulus fibrosus (AF5, AF6).
The core (N3) can then migrate into the thickness of the annulus and cause acute or chronic back pain. If it moves further through the annulus, the core (N3) may protrude to the posterior face of the disc so forming a disc herniation. This hernia can migrate into the spinal canal and even exclude leaving the disc. This disc herniation can come compress or “stuck” in one or more nerve roots located near the disc.
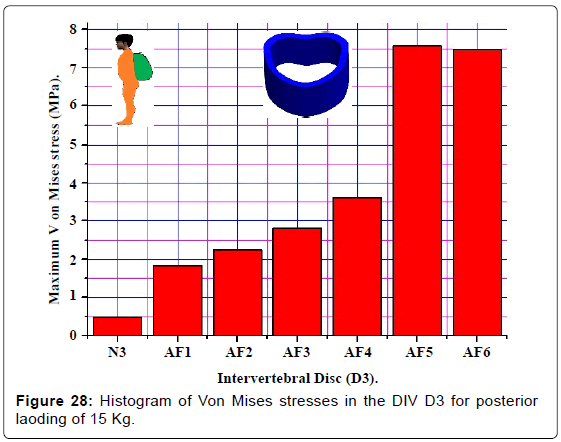
The Von Mises stresses in the fibrous rings (N3, AF1, AF2, AF3, AF4, AF5, AF6) are equal to (0.4869 MPa, 1.8381 MPa, 2.2456 MPa, 2.82 MPa, 3.6215 MPa, 7.5682 MPa, 7.473 MPa) by report the other system components of the spine (Figure 29).
Figure 28 shows a histogram of maximum Von Mises stress in the disc of fibrous rings D3 (N3, AF1, AF2, AF3, AF4, AF5, AF6), we note that the nucleus pulposus (N3) starts move to outside that is tearing commenced by the fibrous rings (AF6) (AF5), AF4, AF3, AF2, AF1, the core (N3) can come compress the spinal cord or multiple roots or the dural sheath.
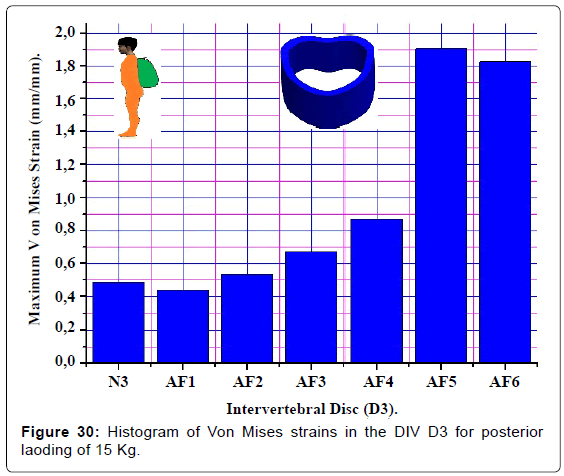
Figure 30 shows the histogram of Von Mises strains in the intervertebral disc components (D3) for a posterior load of 15 kg, we note that the maximum von Mises strain are concentrated in the two rings (AF5, AF6) are equal to (1.9066 mm/mm 1.8265 mm/mm) and say this disc degeneration starts, after a phase of asymptomatic dehydration by tears to two the annulus (AF5, AF6).
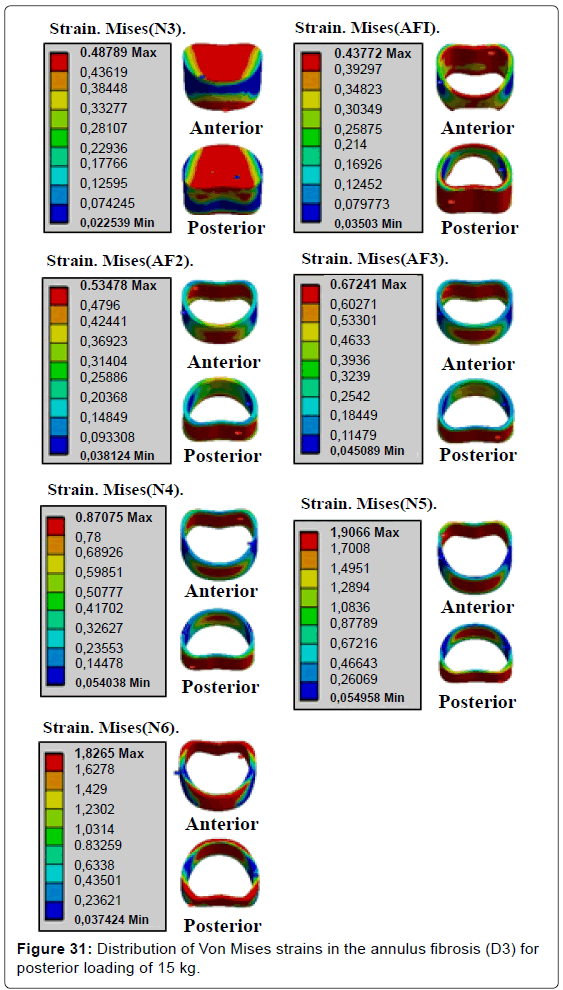
In Figure 31 the posterior loading shows maximum von mises strains concentrated in the disc D3 (N3, AF1, AF2, AF3 AF4, AF5, AF6) and are equal to (0.4878 mm/mm 0.4377 mm/mm 0.5347 mm/ mm 0.6724 mm/mm 0.8707 mm/mm 1.9066 mm/mm 1.8265 mm/ mm) according the other systems of the spine.
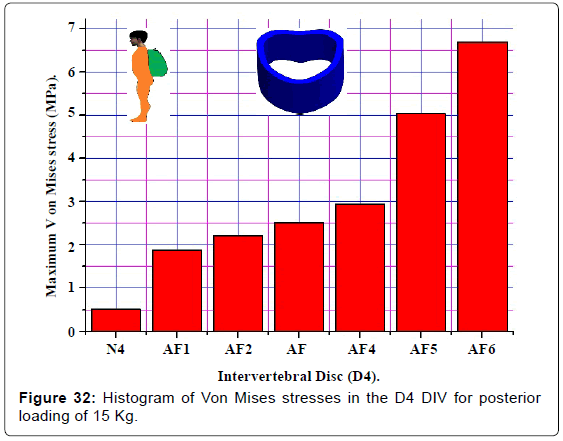
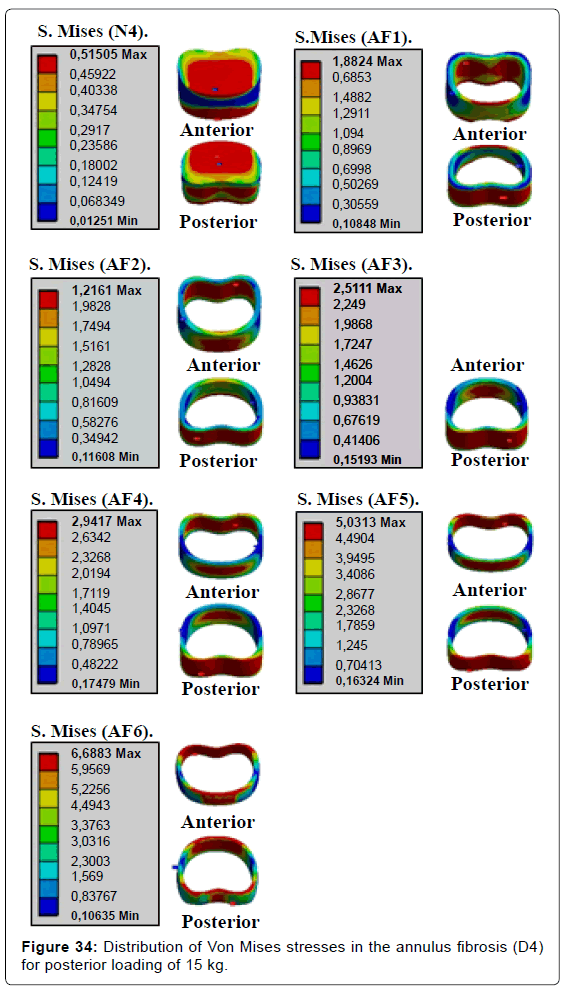
Figure 32 shows the distribution of Von Mises strains in the disk fibrosus rings (D4) under the effect of a load composed (compression P1 plus bending moment (P2, P3, P4)), the load axial compression P1 on the upper surface of the cores (N4) creates a radial inner pressure at fibrosus rings D4 disc, the pressure by the following will generated disc degeneration (discopathy), as regards the anterior bending (P2, P3, P4) causes repetitive movements, if the posterior augment load, we notice the posterior part of each S.Mises (AF1). Anterior Posterior S.Mises (N3). Anterior Posterior Anterior Posterior S.Mises (AF2). S.Mises (AF3). Anterior Posterior S.Mises (AF4 ). Posterior Anterior S.Mises (AF 6). Anterior Posterior Anterior S.Mises (AF 5). Posterior ring fibrosis compress part in red and the other former party tender that is to say six gelatinous cores ( AF1, AF2, AF3, AF4, AF5, AF6) stormed back (posterior compression), the (compression P1 produced by disc protrusion comes into contact with a nerve root called herniated disc.
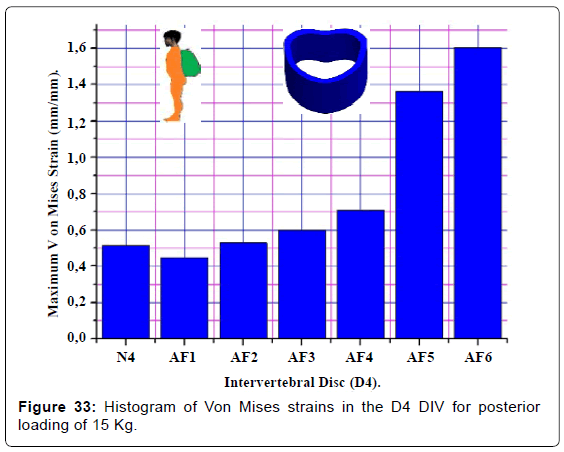
A posterior load applied on the upper surface of the thoracic vertebra TH1 of the spine resulting in a maximum concentration of normal stresses in the anterior and posterior of the disk D4 (the red part) this is mentioned in Figures 33 and 34.
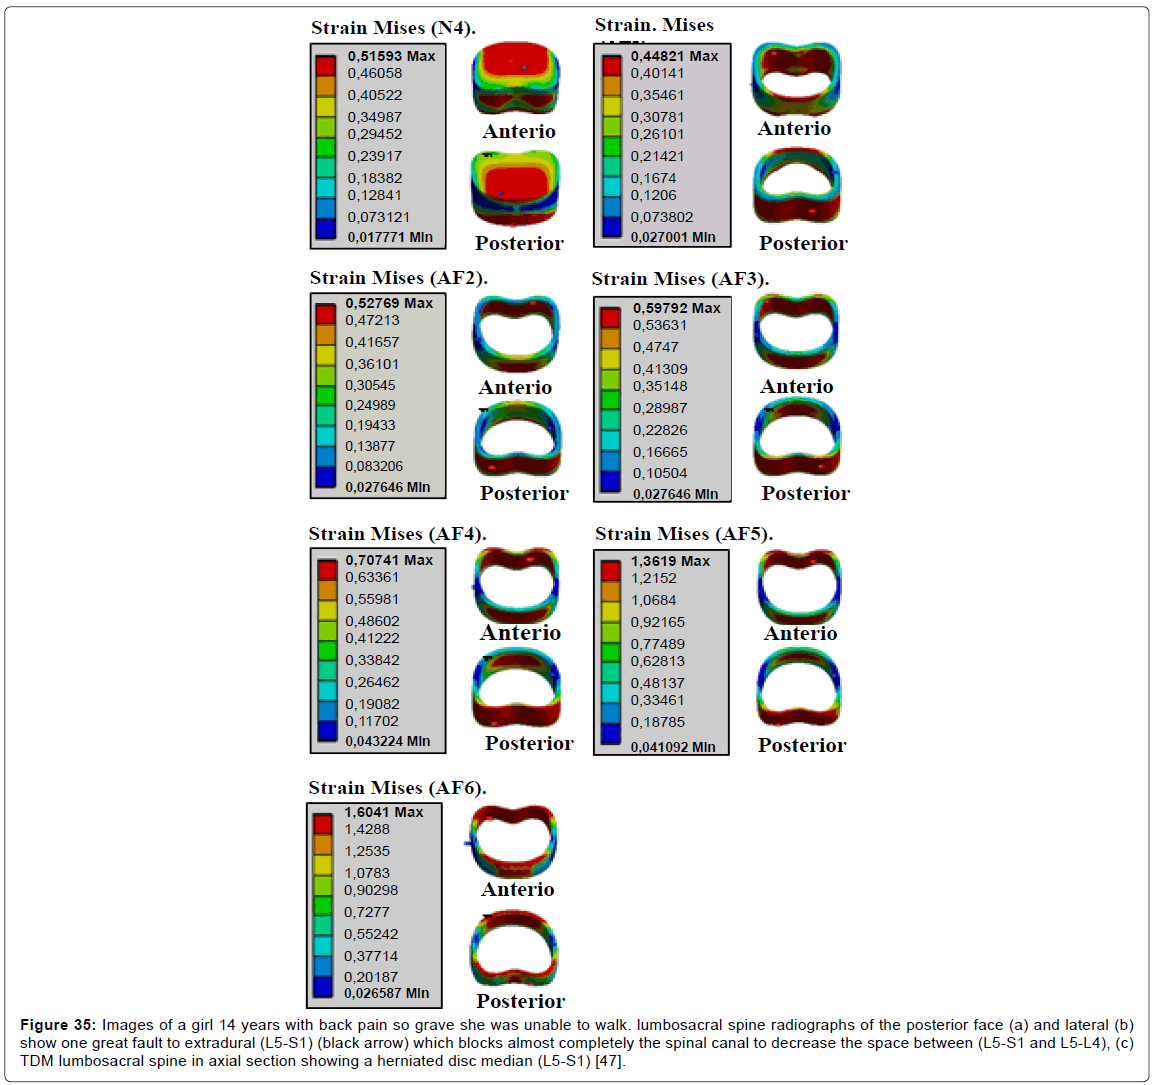
Figure 35 shows that the posterior loading presents a greater strain in the intervertebral disc D4, which means that the said disc is the most sought as posterior flexion thus thereby, it is noted in the Figure 35 that the towed part of the disc D4 is greater than the compressed portion (crushed).
Figure 35: Images of a girl 14 years with back pain so grave she was unable to walk. lumbosacral spine radiographs of the posterior face (a) and lateral (b) show one great fault to extradural (L5-S1) (black arrow) which blocks almost completely the spinal canal to decrease the space between (L5-S1 and L5-L4), (c) TDM lumbosacral spine in axial section showing a herniated disc median (L5-S1) [47].
We see in Figures 32 and 34 the Von Mises stresses affected a maximum value concentrated in the gelatinous core N3 with the rings fibrosis (AF1, AF2, AF3, AF4, AF5, AF6) of the disc intervertebral (D4) that are equal to 0.5150 MPa, 1.8824 MPa, 2.2162 MPa, 2.5111 MPa, 2.9417 MPa, 5.0313 MPa, 6.6883 MPa) for a posterior load of 15 kg which are in the anterior part and posterior of the intervertebral disk (red part).
The posterior loading shows that the von Mises strain value in the components of intervertebral disc D3 are maximum in the two last annulus fibrosus (AF5, AF6) (Figure 34).
On the other hand, the Figure 35 show the contour of the von Mises strains in the annulus fibrosus of the disk (D4) are equal (0.5159 mm/ mm 0.4482 mm/mm 0.5276 mm/mm 0.5979 mm/mm 0.7074 mm/ mm 1.3613 mm/mm 1.6041 mm/mm) according to the other system components of the spine.
Discussion
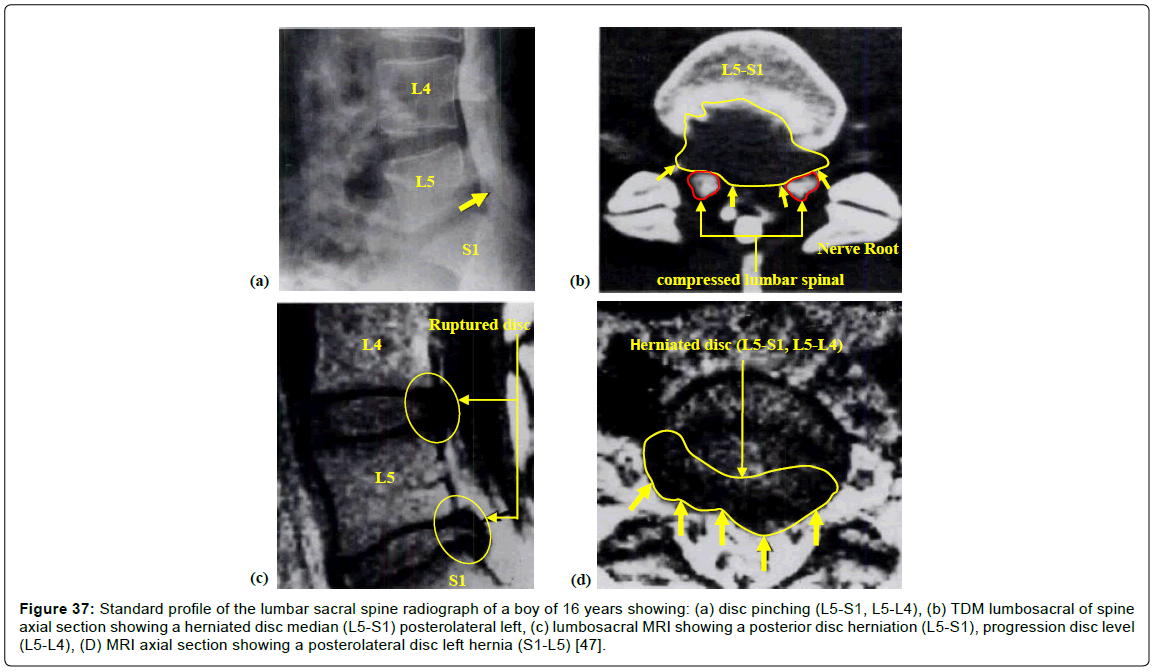
In sum, we concluded that wearing too heavy schoolbag 15 kg is certainly an aggravating factor, and may cause a long-term back problems and deformations of the spine, the 3D model of the spine of a child under the effect of an eccentric load and calculate by the FEM provokes stress and strains maximum of Von Mises concentrated in the four intervertebral discs (D1, D2, D3, D4) and are equal to (3.1168 MPa, 3.1615 MPa, 7.5682 MPa, 6.6882 MPa) (0.82801 mm/mm 0.7792 mm/mm 1.9066 mm/mm 1.6041 mm/mm) this is mentioned in the (Figures 19-23) in regards to the (Figures 19 and 20) show that the two discs intervertebral (D3, D4) are most damaged that is disc degeneration often begins after a phase of asymptomatic dehydration by cracks, tears two annulus (D3, D4), the two cores (N3, N4) can then along these cracks migrate into the thickness of two rings (D3, D4) and cause acute or chronic back pain, If the two cores (N3 , N4) move further through two rings (D3, D4), the two cores may project to the posterior face of the disc while forming a herniated disc (Figures 36 and 37), This hernia can through a complete rupture of the annulus, migrate laterally into the vertebral canal, or up or down, and even exclude leaving the disc, herniated disc that can come compress “stuck “one or more nerve roots near the disk, it is the cause of symptoms” sciatica “pain when the seat back of the thigh or” cruralgie “when pain seat in front of the thigh. This justifies that the distance between the load which is the point of application of the load and the axis of the spine plays an important role in the increase of stresses in the intervertebral discs.
Figure 36: Standard profile of the lumbar sacral spine radiograph of a boy of 16 years showing: (a) disc pinching (L5-S1, L5-L4), (b) TDM lumbosacral of spine axial section showing a herniated disc median (L5-S1) posterolateral left, (c) lumbosacral MRI showing a posterior disc herniation (L5-S1), progression disc level (L5-L4), (D) MRI axial section showing a posterolateral disc le ft hernia (S1-L5) [47].
Figure 37: Standard profile of the lumbar sacral spine radiograph of a boy of 16 years showing: (a) disc pinching (L5-S1, L5-L4), (b) TDM lumbosacral of spine axial section showing a herniated disc median (L5-S1) posterolateral left, (c) lumbosacral MRI showing a posterior disc herniation (L5-S1), progression disc level (L5-L4), (D) MRI axial section showing a posterolateral disc le ft hernia (S1-L5) [47].
Conclusion
In sum, we concluded the case of posterior loading, a 300 mm lever with a 150 N montreent force maximum normal stresses of Von Mises in four intervertebral discs (D1, D2, D3, D4) and are equal to (3.1168 MPa, 3.1615 MPa, 7.5682 MPa, 6.6882 MPa). Figures 19-22 clearly shows that the amount of elastic deformation is highest in the four intervertebral discs (D1, D2, D3, D4) which are equal to (0.82801 mm/ mm 0.7792 mm/mm 1.9066 mm/mm 1.6041 mm/mm) This justifies that the distance between the load which is the point of application of the load and the axis of the spine plays a very important role in increasing the solitation of the latter.
Acknowledgements
The authors extend their appreciation to the Director of Scientific Research at LaBPS for funding the work through the Biomechanics Research Group.
References
- Palfai TP, Monti PM, Ostafin B, Hutchison K (2000) Effects of nicotine deprivation on alcohol-related information processing and drinking behavior. J Abnorm Psychol 109: 96-105.
- Harrison EL, Hinson RE, McKee SA (2009) Experimenting and daily smokers: episodic patterns of alcohol and cigarette use. Addict Behav 34: 484-486.
- Howell A, Leyro T, Hogan J, Buckner J, Zvolensky M (2010) Anxiety sensitivity, distress tolerance, and discomfort intolerance in relation to coping and conformity motives for alcohol use and alcohol use problems among young adult drinkers. Addictive Behaviors 35:1144-1147.
- Krukowski RA, Solomon LJ, Naud S (2005) Triggers of heavier and lighter cigarette smoking in college students. J Behav Med 28: 335-345.
- Reed MB, Wang R, Shillington AM, Clapp JD, Lange JE (2007) The relationship between alcohol use and cigarette smoking in a sample of undergraduate college students. Addictive Behaviors 32: 449-464.
- Hughes JR, Kalman D (2006) Do smokers with alcohol problems has more difficulty quitting? Drug Alcohol Depend 82: 91-102.
- Hurt RD, Offord KP, Croghan IT, Gomez-Dahl L, Kottke TE, et al. (1996) Mortality following inpatient addictions treatment: Role of tobacco use in a community-based cohort. JAMA: Journal of the American Medical Association 275: 1097-1103.
- Lisha NE, Carmody TP2, Humfleet GL2, Delucchi KL2 (2014) Reciprocal effects of alcohol and nicotine in smoking cessation treatment studies. Addict Behav 39: 637-643.
- Taylor B, Rehm J (2006) When risk factors combine: The interaction between alcohol and smoking for aerodigestive cancer, coronary heart disease, and traffic and fire injury. Addictive Behaviors 31: 1522-1535.
- Jarvis CM, Hayman LL, Braun LT, Schwertz DW, Ferrans CE, et al. (2007) Cardiovascular risk factors and metabolic syndrome in alcohol- and nicotine-dependent men and women. J CardiovascNurs 22: 429-435.
- Joseph AM, Willenbring ML, Nugent SM, Nelson DB (2004) A randomized trial of concurrent versus delayed smoking intervention for patients in alcohol dependence treatment. Journal of Studies on Alcohol, 65: 681-691.
- Kodl M, Fu SS, Joseph AM (2006) Tobacco cessation treatment for alcohol-dependent smokers: when is the best time? Alcohol Res Health 29: 203-207.
- Fu S, Kodl M, Willenbring M, Nelson D, Nugent S, et al. (2008) Ethnic differences in alcohol treatment outcomes and the effect of concurrent smoking cessation treatment. Drug and Alcohol Dependence 92: 61-68.
- Holt LJ, Litt MD, Cooney NL (2012) Prospective analysis of early lapse to drinking and smoking among individuals in concurrent alcohol and tobacco treatment. Psychology of Addictive Behaviors 26:561-572.
- Centers for Disease Control and Prevention (CDC) (2009) Cigarette smoking among adults and trends in smoking cessation - United States, 2008. MMWR Morb Mortal Wkly Rep 58: 1227-1232.
- Irving LM, Seidner AL, Burling TA, Thomas RG, Brenner GF (1994) Drug and alcohol abuse inpatients' attitudes about smoking cessation. J Subst Abuse 6: 267-278.
- Macnee CL, Talsma A (1995) Development and testing of the barriers to cessation scale. Nurs Res 44: 214-219.
- Orleans CT, Rimer BK, Cristinzio S, Keintz MK, Fleisher L (1991) A national survey of older smokers: treatment needs of a growing population. Health Psychol 10: 343-351.
- Kristeller JL (1994) Treatment of hard-core, high-risk smokers using FDA approved pharmaceutical agents: An oral health team perspective. Health Values 18: 25-32.
- Asher MK, Martin RA, Rohsenow DJ, MacKinnon S, Traficante R, et al. (2003) Perceived barriers to quitting smoking among alcohol dependent patients in treatment. Journal of Substance Abuse Treatment 24: 169-174.
- Martin RA, Rohsenow DJ, MacKinnon SV, Abrams DB, Monti PM (2006) Correlates of motivation to quit smoking among alcohol dependent patients in residential treatment. Drug Alcohol Depend 83: 73-78.
- Marlatt GA, Gordon JR (1985) Relapse prevention. New York: Guilford Press.
- Velicer WF, DiClemente CC, Prochaska JO, Brandenburg N (1985) Decisional balance measure for assessing and predicting smoking status. J PersSoc Psychol 48: 1279-1289.
- DiClemente CC, Prochaska JO (1982) Self-change and therapy change of smoking behavior: a comparison of processes of change in cessation and maintenance. Addict Behav 7: 133-142.
- Curry SJ, Grothaus L, McBride C (1997) Reasons for quitting: intrinsic and extrinsic motivation for smoking cessation in a population-based sample of smokers. Addict Behav 22: 727-739.
- Baha M, Le Faou AL (2010) Smokers' reasons for quitting in an anti-smoking social context. Public Health 124: 225-231.
- Curry SJ, McBride C, Grothaus LC, Louie D, Wagner EH (1995) A randomized trial of self-help materials, personalized feedback, and telephone counseling with nonvolunteer smokers. J Consult Clin Psychol 63: 1005-1014.
- Saunders JB, Aasland OG, Babor TF, de la Fuente JR, Grant M (1993) Development of the Alcohol Use Disorders Identification Test (AUDIT): WHO Collaborative Project on Early Detection of Persons with Harmful Alcohol Consumption--II. Addiction 88: 791-804.
- First MB, Williams JB, Spitzer RL, Gibbon M (2002) Structured Clinical Interview for DSM-IV-TR Axis I Disorders, Clinical Trials Version (SCID-CT). New York: Biometrics Research, New York State Psychiatric Institute.
- Brown RA, Lejuez CW, Kahler CW, Strong DR (2002) Distress tolerance and duration of past smoking cessation attempts. J Abnorm Psychol 111: 180-185.
- Heatherton TF, Kozlowski LT, Frecker RC, Fagerström KO (1991) The Fagerström Test for Nicotine Dependence: a revision of the Fagerström Tolerance Questionnaire. Br J Addict 86: 1119-1127.
- Pomerleau CS, Carton SM, Lutzke ML, Flessland KA, Pomerleau OF (1994) Reliability of the Fagerstrom Tolerance Questionnaire and the Fagerstrom Test for Nicotine Dependence. Addict Behav 19: 33-39.
- Fagerstrom KO, Heatherton TF, Kozlowski LT (1990) Nicotine addiction and its assessment. Ear Nose Throat J 69: 763-765.
- Filbey FM, Claus E, Audette AR, Niculescu M, Banich MT, et al. (2007) Exposure to the taste of alcohol elicits activation of the mesocorticolimbicneurocircuitry. Neuropsychopharmacology 33: 1391-1401.
- Fleming MF, Barry KL, MacDonald R (1991) The alcohol use disorders identification test (AUDIT) in a college sample. Int J Addict 26: 1173-1185.
- Cherpitel CJ (1995) Analysis of cut points for screening instruments for alcohol problems in the emergency room. J Stud Alcohol 56: 695-700.
- Macnee CL, Talsma A (1995) Predictors of progress in smoking cessation. Public Health Nurs 12: 242-248.
- Curry S, Wagner EH, Grothaus LC (1990) Intrinsic and extrinsic motivation for smoking cessation. J Consult Clin Psychol 58: 310-316.
- McBride CM, Pollak KI, Bepler G, Lyna P, Lipkus IM, et al. (2001) Reasons for quitting smoking among low-income African American smokers. Health Psychol 20: 334-340.
- Bonn-Miller MO, Zvolensky MJ (2009) An evaluation of the nature of marijuana use and its motives among young adult active users. Am J Addict 18: 409-416.
- Buckner JD, Zvolensky MJ, Schmidt NB (2012) Cannabis-related impairment and social anxiety: the roles of gender and cannabis use motives. Addict Behav 37: 1294-1297.
- Agrawal A, Budney AJ, Lynskey MT (2012) The co-occurring use and misuse of cannabis and tobacco: a review. Addiction 107: 1221-1233.
- Degenhardt L, Hall W, Lynskey M (2001) The relationship between cannabis use and other substance use in the general population. Drug Alcohol Depend 64: 319-327.
- Cohen J, Cohen P (1983) Applied multiple regression/correlation analysis for the behavioral sciences. Hillsdale, NJ: Lawrence Erlbaum.
- Cohen J, Cohen P, West SG, Aiken LS (2003) Applied multiple regression/correlation analysis for the behavioral sciences (3rd ed.). Mahwah, NJ US: Lawrence Erlbaum Associates Publishers.
- Lipkus IM, Feaganes JR, Green JD, Sedikides C (2001) The Relationship Between Attitudinal Ambivalence and Desire to Quit Smoking Among College Smokers. Journal of Applied Social Psychology, 31: 113-133.
- Wilson SJ, Creswell KG, Sayette MA, Fiez JA (2013) Ambivalence about smoking and cue-elicited neural activity in quitting-motivated smokers faced with an opportunity to smoke. Addict Behav 38: 1541-1549.
- Festinger LA (1957) A theory of cognitive dissonance. Evanston, IL: Row, Peterson.
- Markowitz LJ (2000) Smoker's perceived self-exemption from health risks. Psi Chi Journal of Undergraduate Research 5: 119-124.
- Jamieson P, Romer D (2001)What do young people think they know about the risks of smoking? In P. Slovic (Ed.), Smoking: Risk, perception, and policy (pp. 51-63). Thousand Oaks, CA US: Sage Publications, Inc.
- Schane RE, Glantz SA, Ling PM (2009) Social smoking implications for public health, clinical practice, and intervention research. American Journal of Preventive Medicine 37: 124-131.
- DaniJA, De Biasi M (2001) Cellular mechanisms of nicotine addiction. PharmacolBiochemBehav 70: 439-446.
- Nestler EJ (2005) Is there a common molecular pathway for addiction? Nat Neurosci 8: 1445-1449.
- Ehrman RN, Robbins SJ, Bromwell MA, Lankford ME, Monterosso JR, et al. (2002) Comparing attentional bias to smoking cues in current smokers, former smokers, and non-smokers using a dot-probe task. Drug Alcohol Depend 67: 185-191.
- Kerst WF, Waters AJ (2014)Attentional retraining administered in the field reduces smokers’ attentional bias and craving.
- Wiers RW, Rinck M, Kordts R, Houben K, Strack F (2010) Retraining automatic action-tendencies to approach alcohol in hazardous drinkers. Addiction 105: 279-287.
- Raupach T, West R, Brown J (2013) The most "successful" method for failing to quit smoking is unassisted cessation. Nicotine Tob Res 15: 748-749.
- Korte KJ, Capron DW, Zvolensky M, Schmidt NB (2013) The Fagerström test for nicotine dependence: do revisions in the item scoring enhance the psychometric properties? Addict Behav 38: 1757-1763.
Relevant Topics
- 3D Mammograms
- Alternative Cancer Medicines
- Aromatase Inhibitors
- Breast Reconstruction Surgery
- Cancer and Nutrition
- Cancer Prevention from Nuts
- Cancer Screening
- Chemoprevention
- Dietary Supplements
- Exercise and Cancer
- Naturopathic Treatments
- Oncoplastic Surgery
- Scintimammography
- Stem Cell Transplants for Cancer Prevention
Recommended Journals
Article Tools
Article Usage
- Total views: 22036
- [From(publication date):
October-2016 - Aug 29, 2025] - Breakdown by view type
- HTML page views : 21072
- PDF downloads : 964

